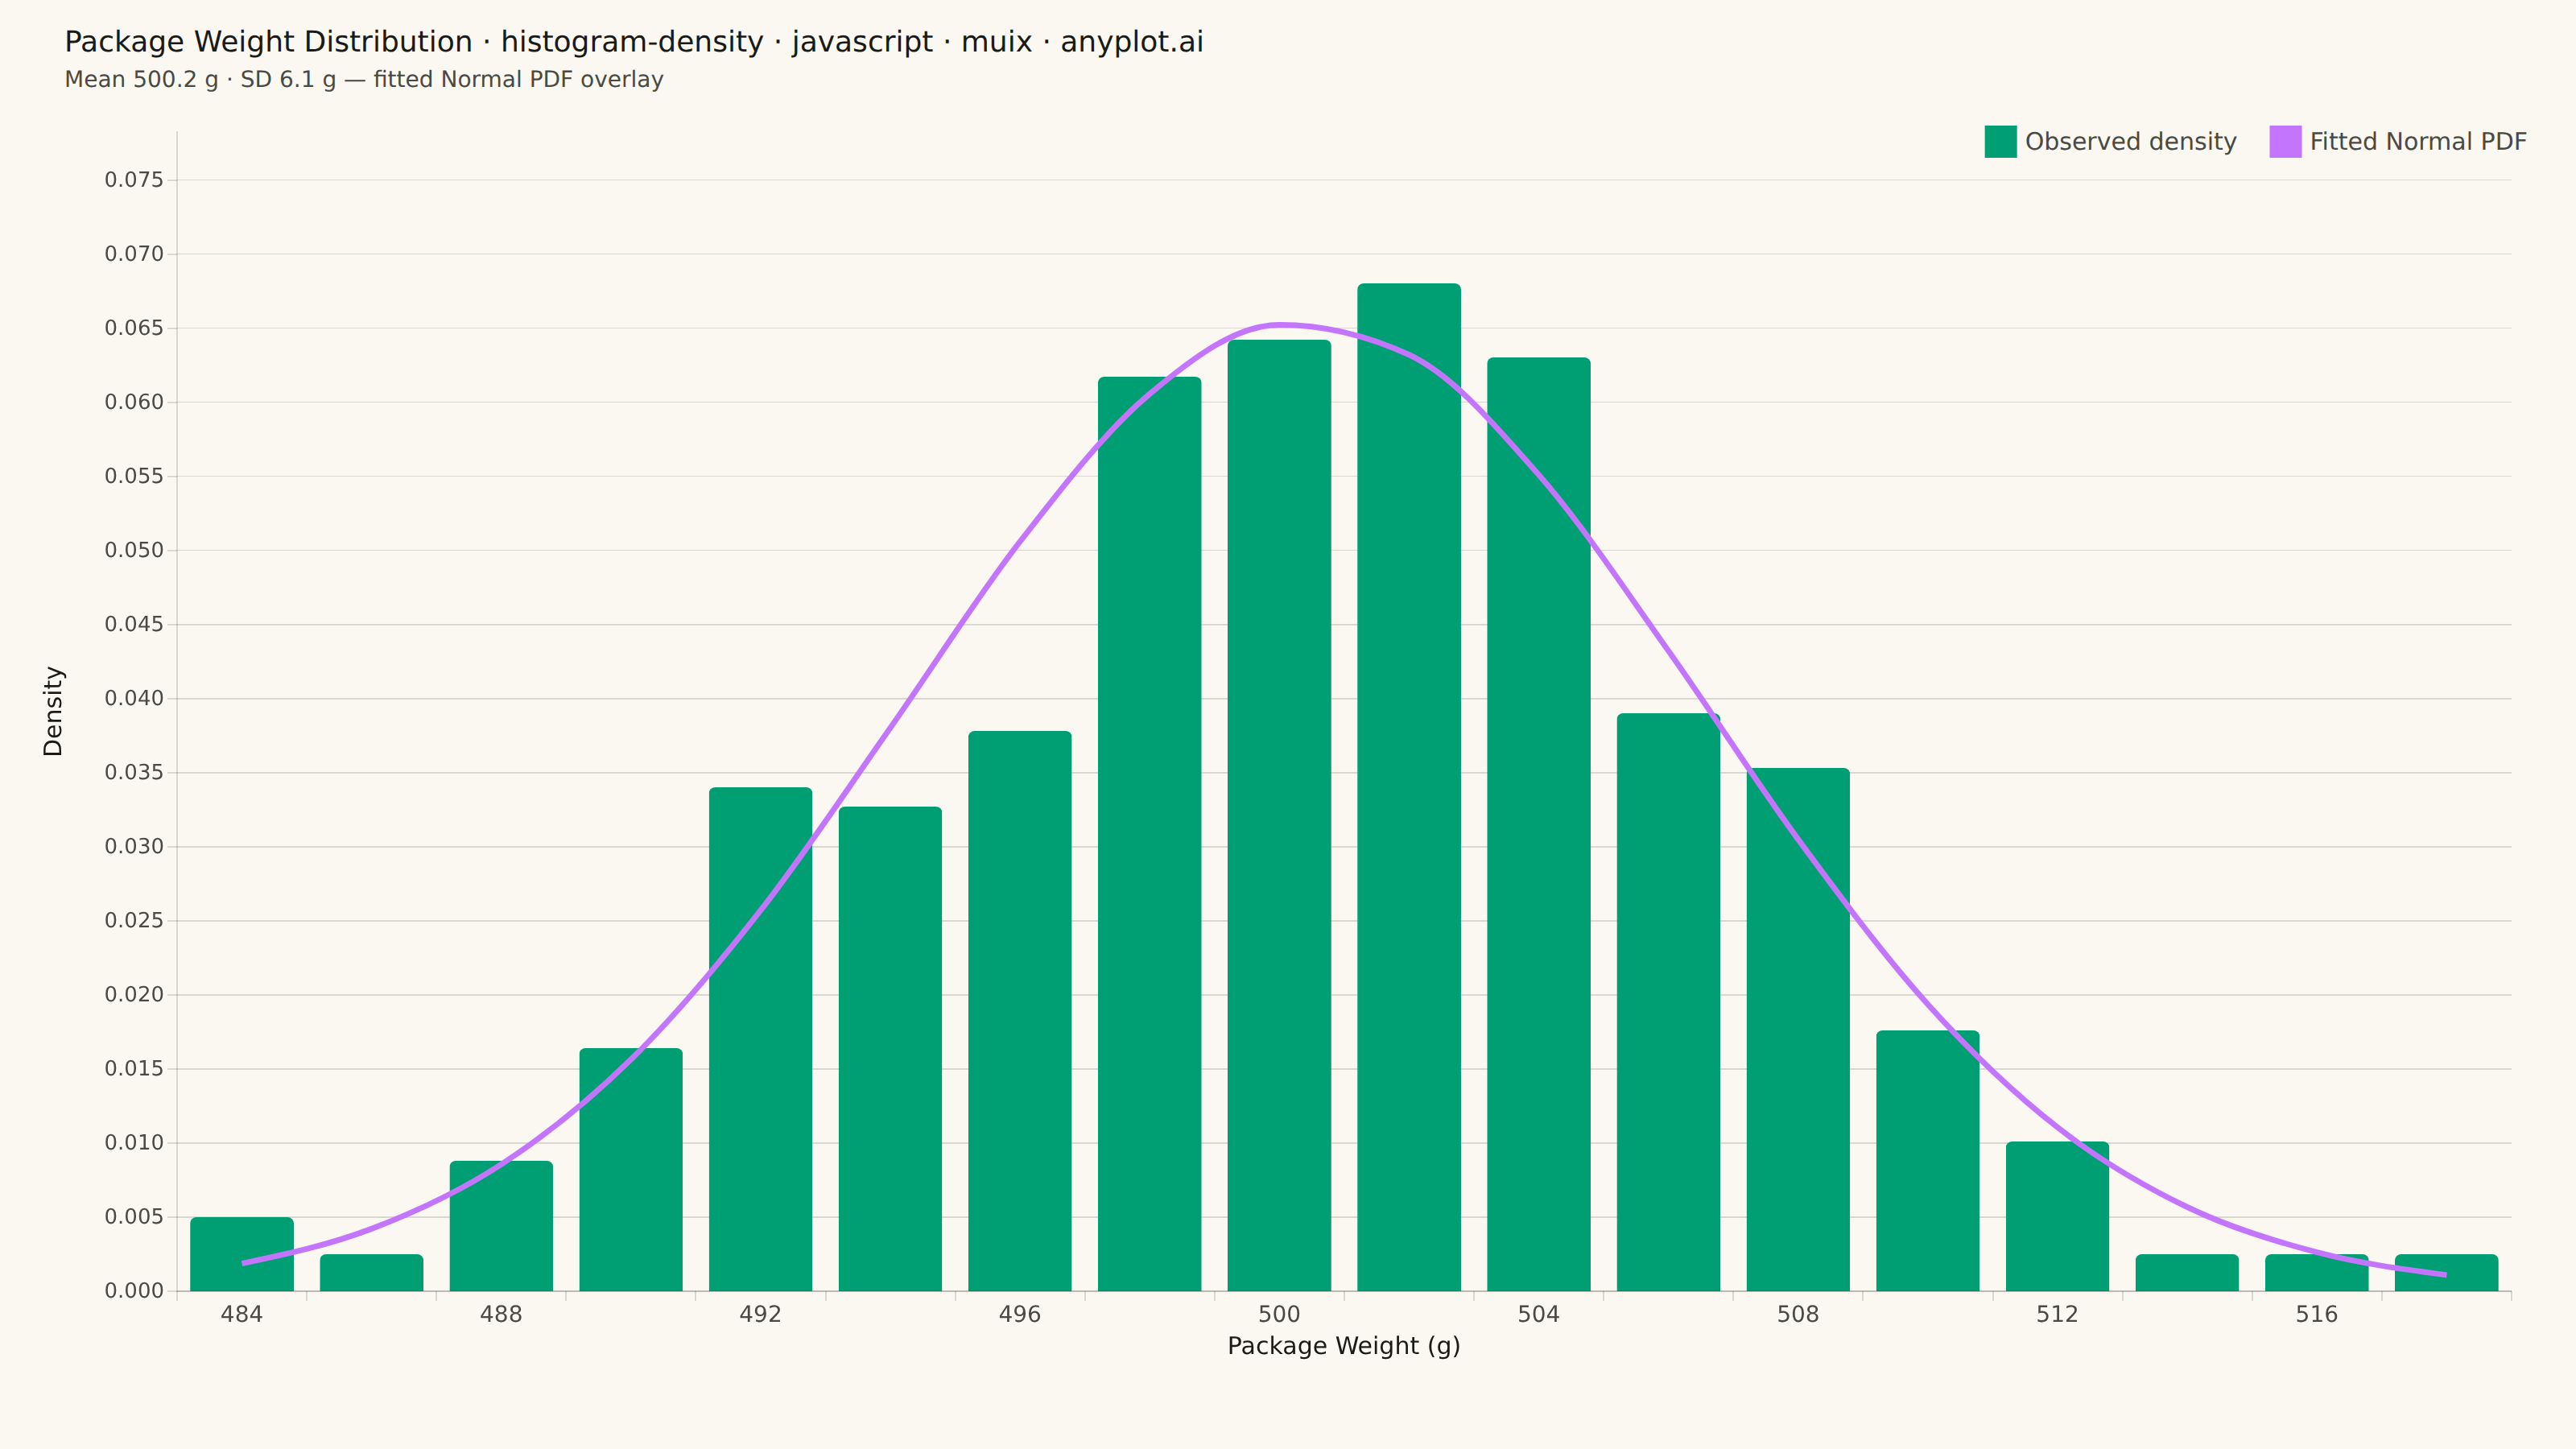
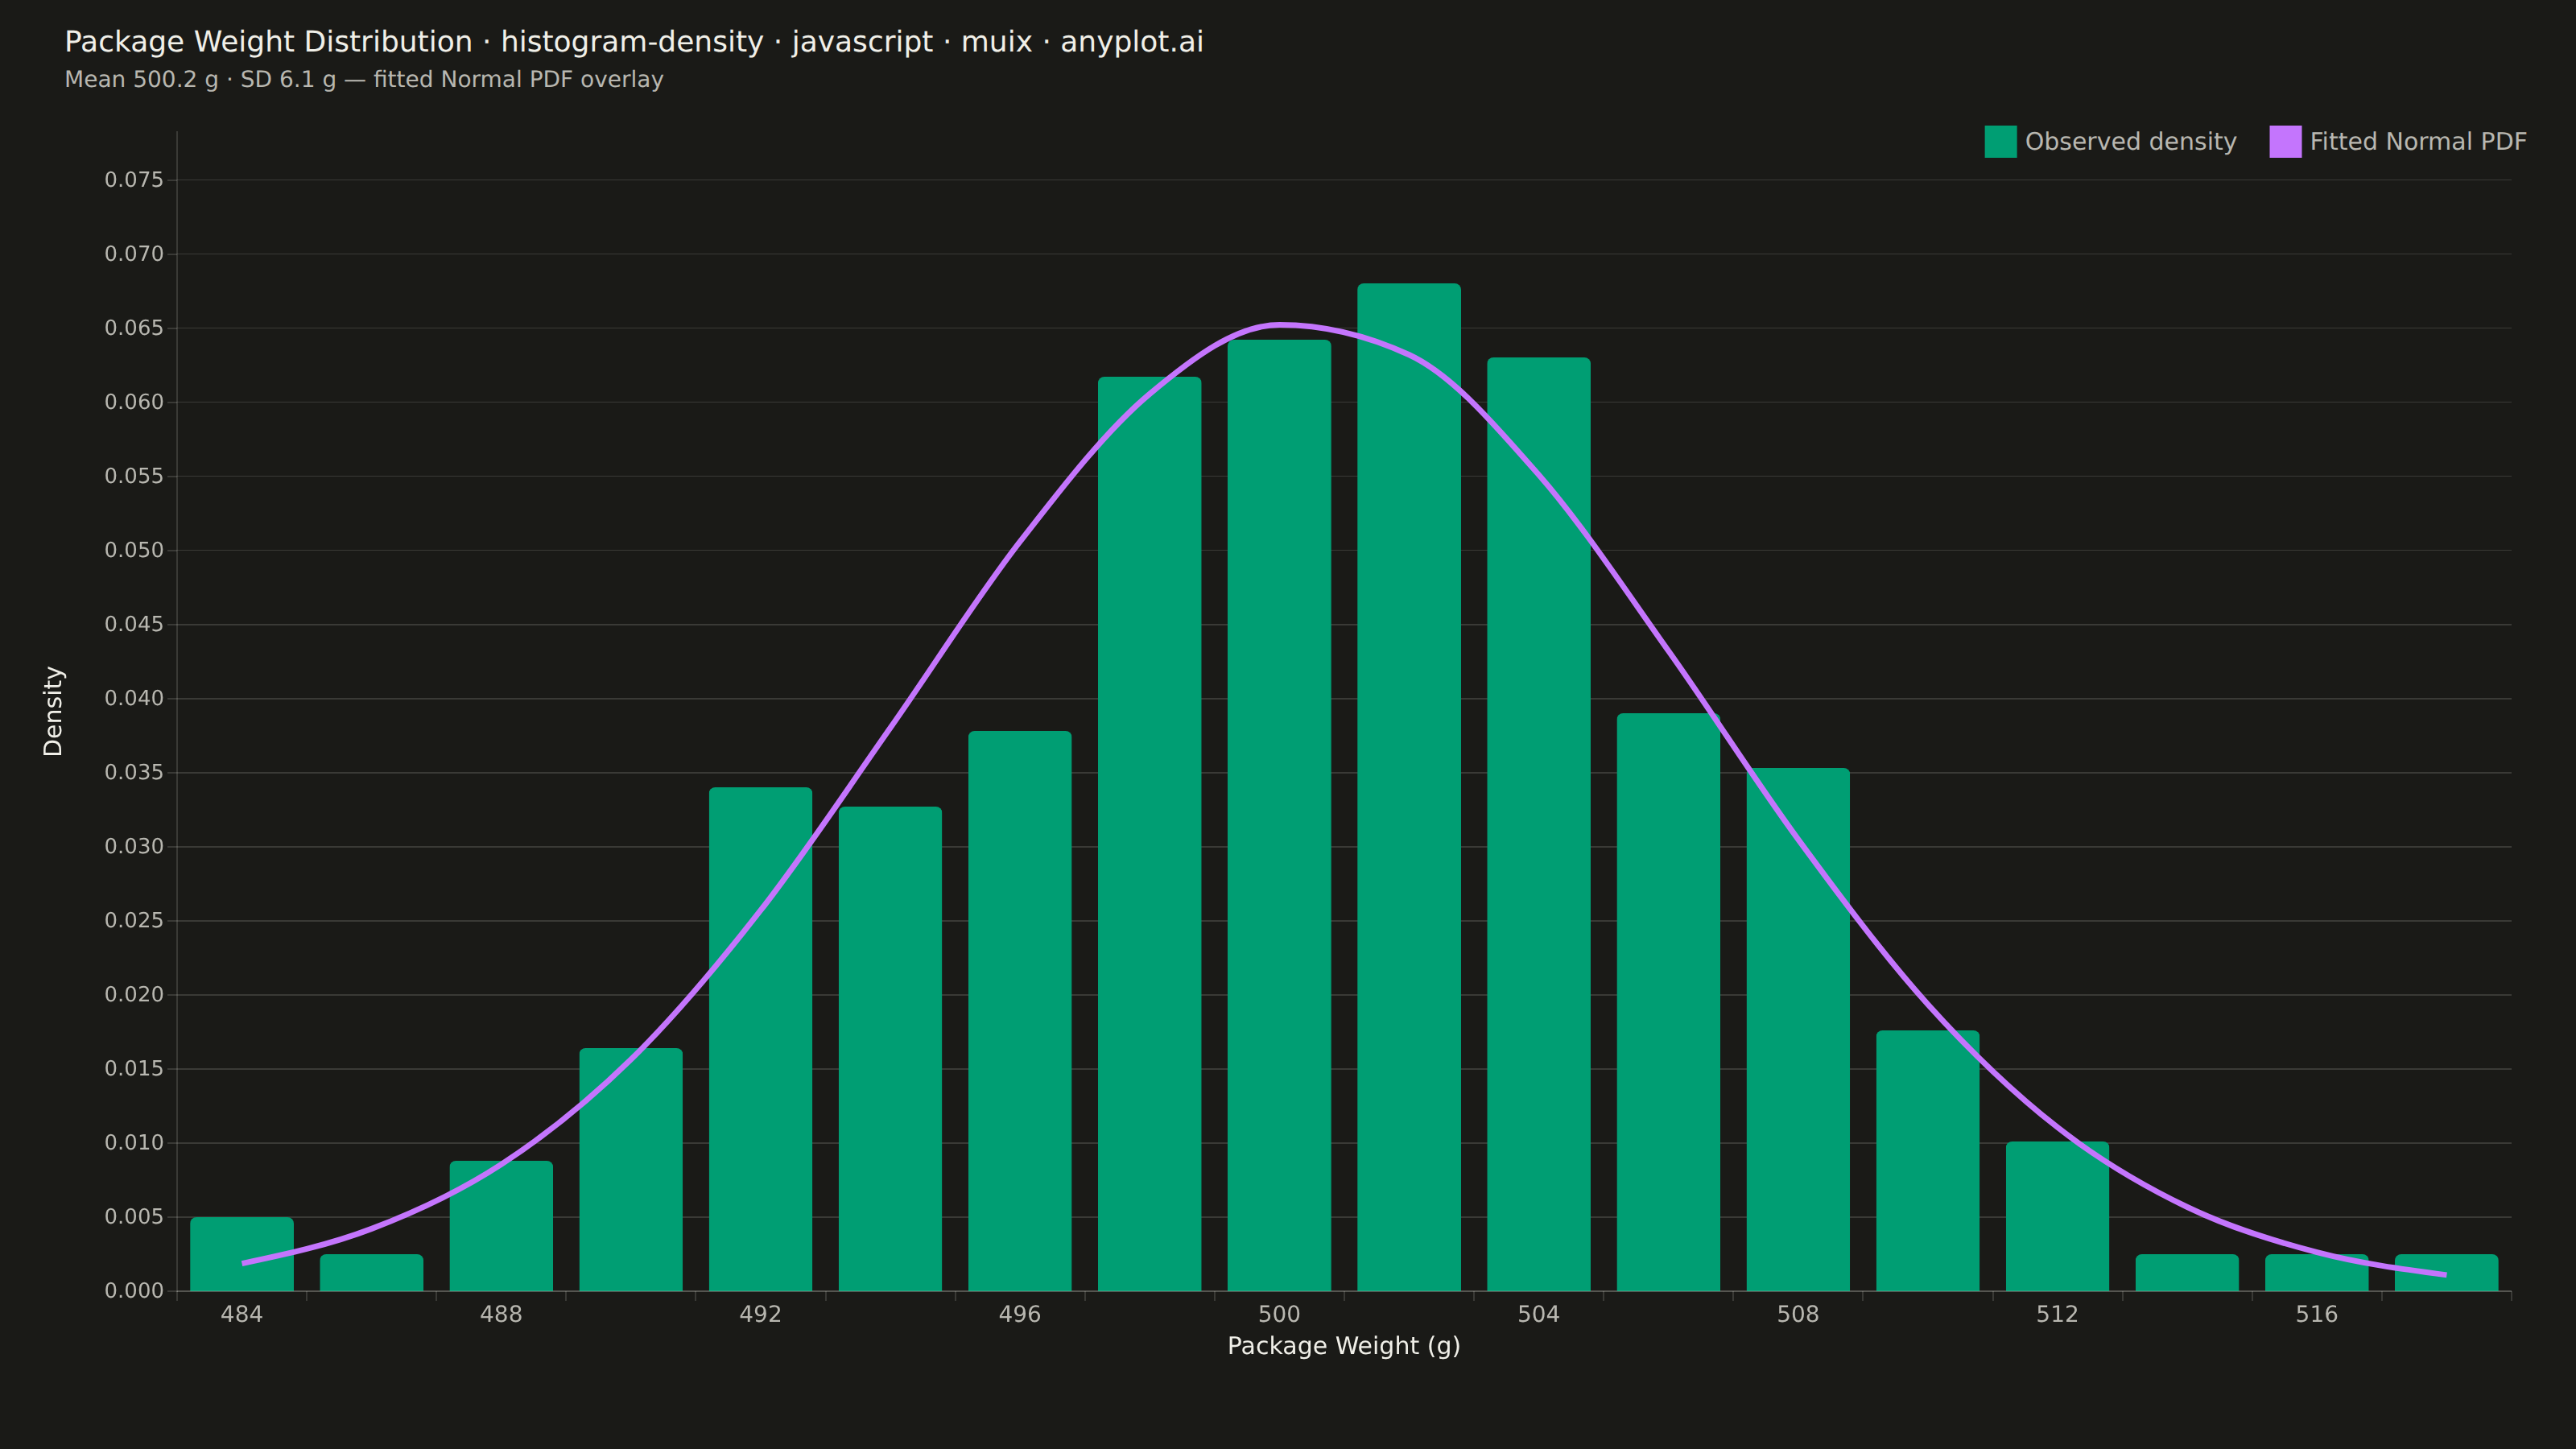
The same plot in 14 other libraries — JavaScript: Chart.js, D3.js, Apache ECharts, Highcharts; Python: Altair, Bokeh, lets-plot, Matplotlib, Plotly, plotnine, Pygal, Seaborn; R: ggplot2; Julia: Makie.jl. Compare all 15 side by side: Density Histogram in Python, R, Julia and JavaScript.
A density histogram displays the distribution of a continuous variable normalized so that the total area under the histogram equals 1, representing probability density instead of raw counts. This normalization allows direct comparison between distributions with different sample sizes and enables overlaying theoretical probability density functions (PDFs) for statistical analysis.
// anyplot.ai
// histogram-density: Density Histogram
// Library: muix 7.29.1 | JavaScript 22.23.2
// Quality: 91/100 | Created: 2026-09-05
import { ChartContainer } from "@mui/x-charts/ChartContainer";
import { BarPlot } from "@mui/x-charts/BarChart";
import { LinePlot } from "@mui/x-charts/LineChart";
import { ChartsXAxis } from "@mui/x-charts/ChartsXAxis";
import { ChartsYAxis } from "@mui/x-charts/ChartsYAxis";
import { ChartsGrid } from "@mui/x-charts/ChartsGrid";
import { ChartsLegend } from "@mui/x-charts/ChartsLegend";
import { axisClasses } from "@mui/x-charts/ChartsAxis";
import Box from "@mui/material/Box";
import Typography from "@mui/material/Typography";

const t = window.ANYPLOT_TOKENS;
const FONT = "system-ui, -apple-system, sans-serif";

// --- Data (in-memory, deterministic) ----------------------------------------
// Fixed-seed LCG + Box-Muller — the browser has no seeded Math.random.
let seed = 7;
function lcg() {
  seed = (Math.imul(1664525, seed) + 1013904223) >>> 0;
  return seed / 0x100000000;
}
function randn() {
  const u1 = Math.max(lcg(), 1e-10);
  const u2 = lcg();
  return Math.sqrt(-2 * Math.log(u1)) * Math.cos(2 * Math.PI * u2);
}

// A filling line's package weights (g). Nominal fill is 500g with small,
// roughly-Gaussian process variability — the classic case for checking
// observed density against a fitted Normal curve.
const N = 400;
const NOMINAL_WEIGHT = 500;
const PROCESS_SD = 6;
const weights = Array.from(
  { length: N },
  () => NOMINAL_WEIGHT + randn() * PROCESS_SD
);

// --- Bin into a density histogram (bar area sums to 1) -----------------------
const dataMin = Math.min(...weights);
const dataMax = Math.max(...weights);
const BIN_COUNT = 18;
const binWidth = (dataMax - dataMin) / BIN_COUNT;
const binCounts = new Array(BIN_COUNT).fill(0);
weights.forEach((w) => {
  const idx = Math.min(BIN_COUNT - 1, Math.floor((w - dataMin) / binWidth));
  binCounts[idx] += 1;
});
const density = binCounts.map((c) => c / (N * binWidth));
const binCenters = binCounts.map((_, i) => dataMin + (i + 0.5) * binWidth);

// --- Fitted Normal PDF, sampled at the same bin centers ----------------------
// Sampled at the bin centers (not a finer grid) so it shares the histogram's
// band-scale x-axis as a genuine MUI X combo chart, no manual SVG positioning.
// The `curve: "monotoneX"` on the line series interpolates a smooth spline
// through those points so the fit still reads as a continuous PDF.
const sampleMean = weights.reduce((s, w) => s + w, 0) / N;
const sampleSd = Math.sqrt(
  weights.reduce((s, w) => s + (w - sampleMean) ** 2, 0) / (N - 1)
);
const normalPdf = binCenters.map((x) => {
  const z = (x - sampleMean) / sampleSd;
  return Math.exp(-0.5 * z * z) / (sampleSd * Math.sqrt(2 * Math.PI));
});

const Y_MAX = Math.max(...density, ...normalPdf) * 1.15;

// Imprint palette colors — canonical order (bars = position 1, curve = position 2)
const BRAND = t.palette[0]; // #009E73
const CURVE = t.palette[1]; // #C475FD

// Title sizing (scale down for longer-than-67-char titles)
const TITLE =
  "Package Weight Distribution · histogram-density · javascript · muix · anyplot.ai";
const titleSize = Math.max(11, Math.round(22 * (67 / TITLE.length)));
const SUBTITLE = `Mean ${sampleMean.toFixed(1)} g · SD ${sampleSd.toFixed(1)} g — fitted Normal PDF overlay`;

// --- Main component (default-exported — the harness mounts it) --------------
export default function Chart() {
  const { width, height } = window.ANYPLOT_SIZE;
  const TITLE_H = 76;

  return (
    <Box
      sx={{
        width,
        height,
        bgcolor: t.pageBg,
        display: "flex",
        flexDirection: "column",
        overflow: "hidden",
      }}
    >
      <Typography
        sx={{
          fontSize: titleSize,
          fontWeight: 500,
          color: t.ink,
          pt: "16px",
          px: "40px",
          pb: 0,
          lineHeight: 1.2,
          fontFamily: FONT,
        }}
      >
        {TITLE}
      </Typography>
      <Typography
        sx={{
          fontSize: 14,
          fontWeight: 400,
          color: t.inkSoft,
          px: "40px",
          pt: "4px",
          pb: 0,
          lineHeight: 1.2,
          fontFamily: FONT,
        }}
      >
        {SUBTITLE}
      </Typography>

      <ChartContainer
        width={width}
        height={height - TITLE_H}
        series={[
          {
            type: "bar",
            id: "observed",
            data: density,
            label: "Observed density",
            color: BRAND,
          },
          {
            type: "line",
            id: "fitted",
            data: normalPdf,
            label: "Fitted Normal PDF",
            color: CURVE,
            showMark: false,
            curve: "monotoneX",
          },
        ]}
        xAxis={[
          {
            id: "weight-axis",
            scaleType: "band",
            data: binCenters,
            label: "Package Weight (g)",
            valueFormatter: (v) => v.toFixed(0),
            tickLabelInterval: (_v, i) => i % 2 === 0,
            labelStyle: { fontSize: 15, fill: t.ink, fontFamily: FONT },
            tickLabelStyle: { fontSize: 14, fill: t.inkSoft, fontFamily: FONT },
          },
        ]}
        yAxis={[
          {
            min: 0,
            max: Y_MAX,
            label: "Density",
            labelStyle: { fontSize: 15, fill: t.ink, fontFamily: FONT },
            tickLabelStyle: { fontSize: 13, fill: t.inkSoft, fontFamily: FONT },
          },
        ]}
        margin={{ top: 24, right: 40, bottom: 80, left: 110 }}
        skipAnimation
      >
        <ChartsGrid horizontal sx={{ "& line": { stroke: t.grid, strokeWidth: 0.8 } }} />
        <BarPlot skipAnimation borderRadius={4} />
        <LinePlot skipAnimation slotProps={{ line: { sx: { strokeWidth: 3.5 } } }} />
        {/* Softened axis lines/ticks (t.grid instead of full-ink) for a less
            default-MUI-X, more refined chrome — data ink stays untouched. */}
        <ChartsXAxis
          axisId="weight-axis"
          sx={{
            [`& .${axisClasses.line}`]: { stroke: t.grid },
            [`& .${axisClasses.tick}`]: { stroke: t.grid },
          }}
        />
        {/* Explicit axisLabel x offset — the default offset formula assumes
            short tick labels and clips against our 4-char decimal density values. */}
        <ChartsYAxis
          slotProps={{ axisLabel: { x: -72 } }}
          sx={{
            [`& .${axisClasses.line}`]: { stroke: t.grid },
            [`& .${axisClasses.tick}`]: { stroke: t.grid },
          }}
        />
        <ChartsLegend
          position={{ vertical: "top", horizontal: "right" }}
          slotProps={{
            legend: {
              labelStyle: { fontSize: 15, fill: t.inkSoft, fontFamily: FONT },
              itemGap: 20,
            },
          }}
        />
      </ChartContainer>
    </Box>
  );
}
Runnable source as JSON, for any HTTP client: https://api.anyplot.ai/specs/histogram-density/muix/code. Any spec id and library id listed in llms-full.txt fit the same URL shape; every URL below is complete and callable.
{
  "spec_id": "histogram-density",
  "language": "javascript",
  "library": "muix",
  "page": "https://anyplot.ai/histogram-density/javascript/muix",
  "hub": "https://anyplot.ai/histogram-density",
  "code_json": "https://api.anyplot.ai/specs/histogram-density/muix/code",
  "spec_json": "https://api.anyplot.ai/specs/histogram-density",
  "render_light_png": "https://storage.googleapis.com/anyplot-images/plots/histogram-density/javascript/muix/plot-light.png",
  "render_dark_png": "https://storage.googleapis.com/anyplot-images/plots/histogram-density/javascript/muix/plot-dark.png",
  "interactive_light_html": "https://storage.googleapis.com/anyplot-images/plots/histogram-density/javascript/muix/plot-light.html",
  "interactive_dark_html": "https://storage.googleapis.com/anyplot-images/plots/histogram-density/javascript/muix/plot-dark.html",
  "quality_score": 91.0,
  "license": "MIT",
  "guide": "https://anyplot.ai/llms.txt"
}
Part of Density Histogram on anyplot.ai.