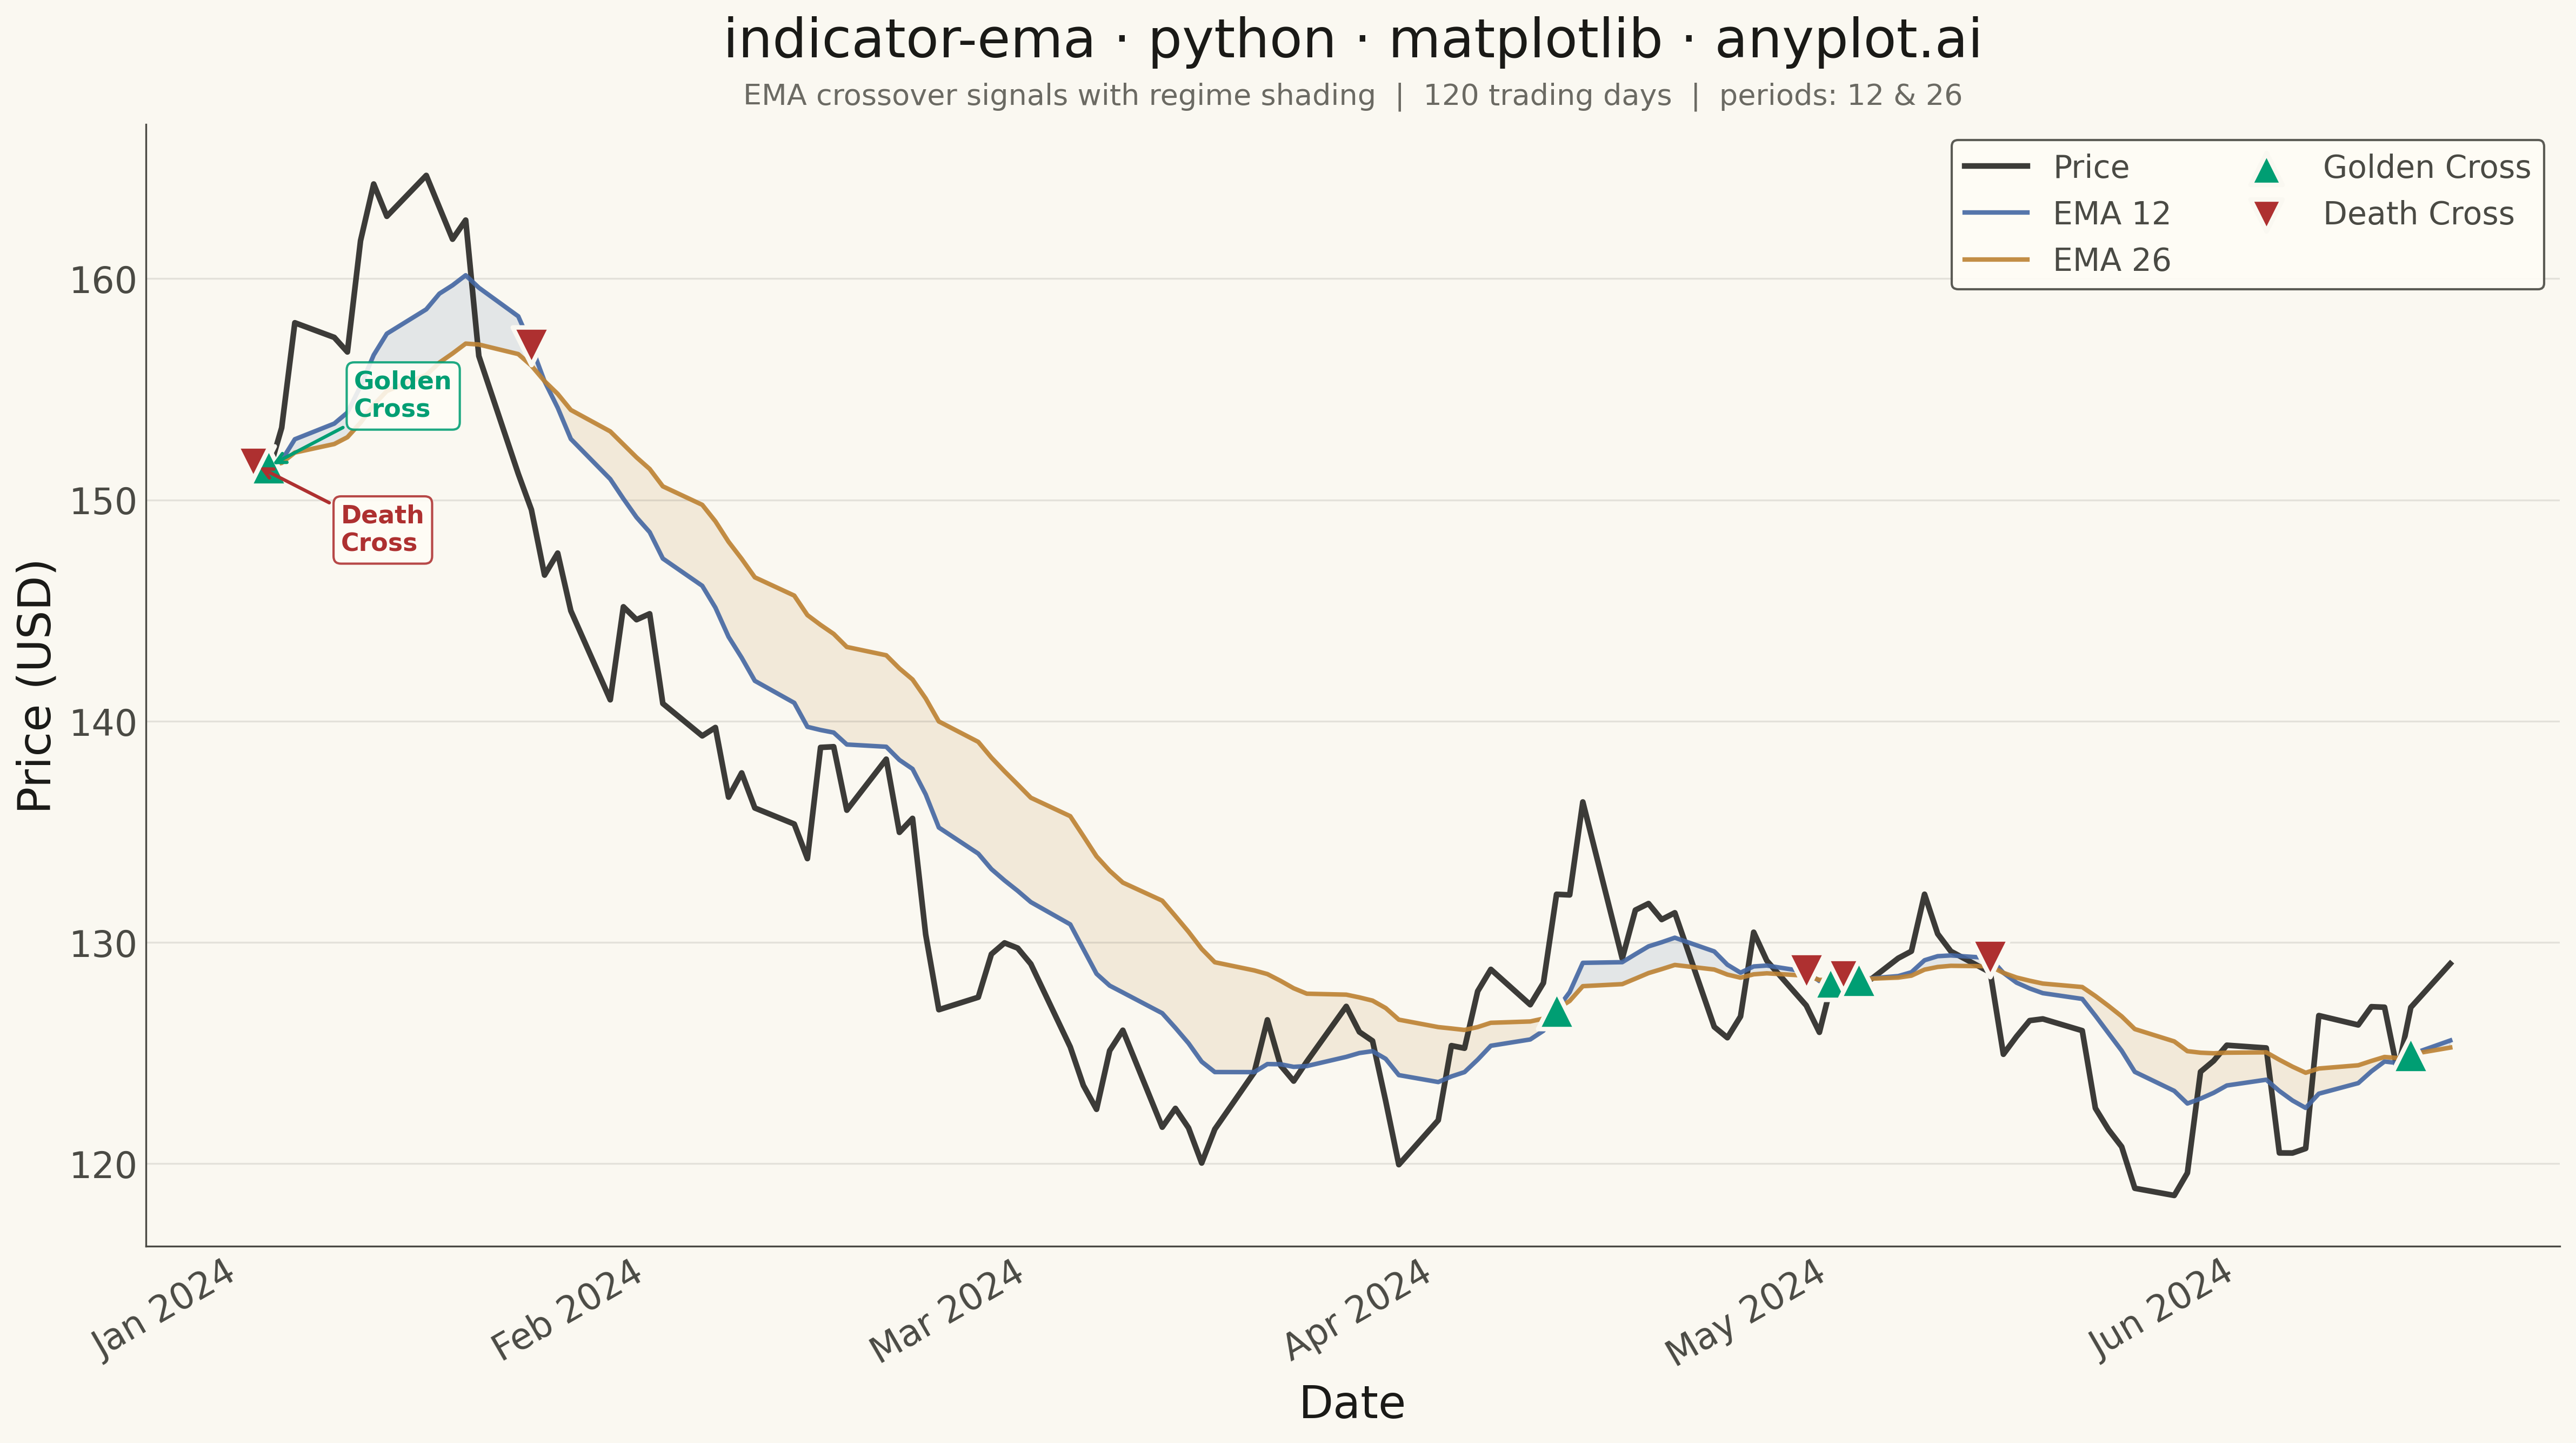
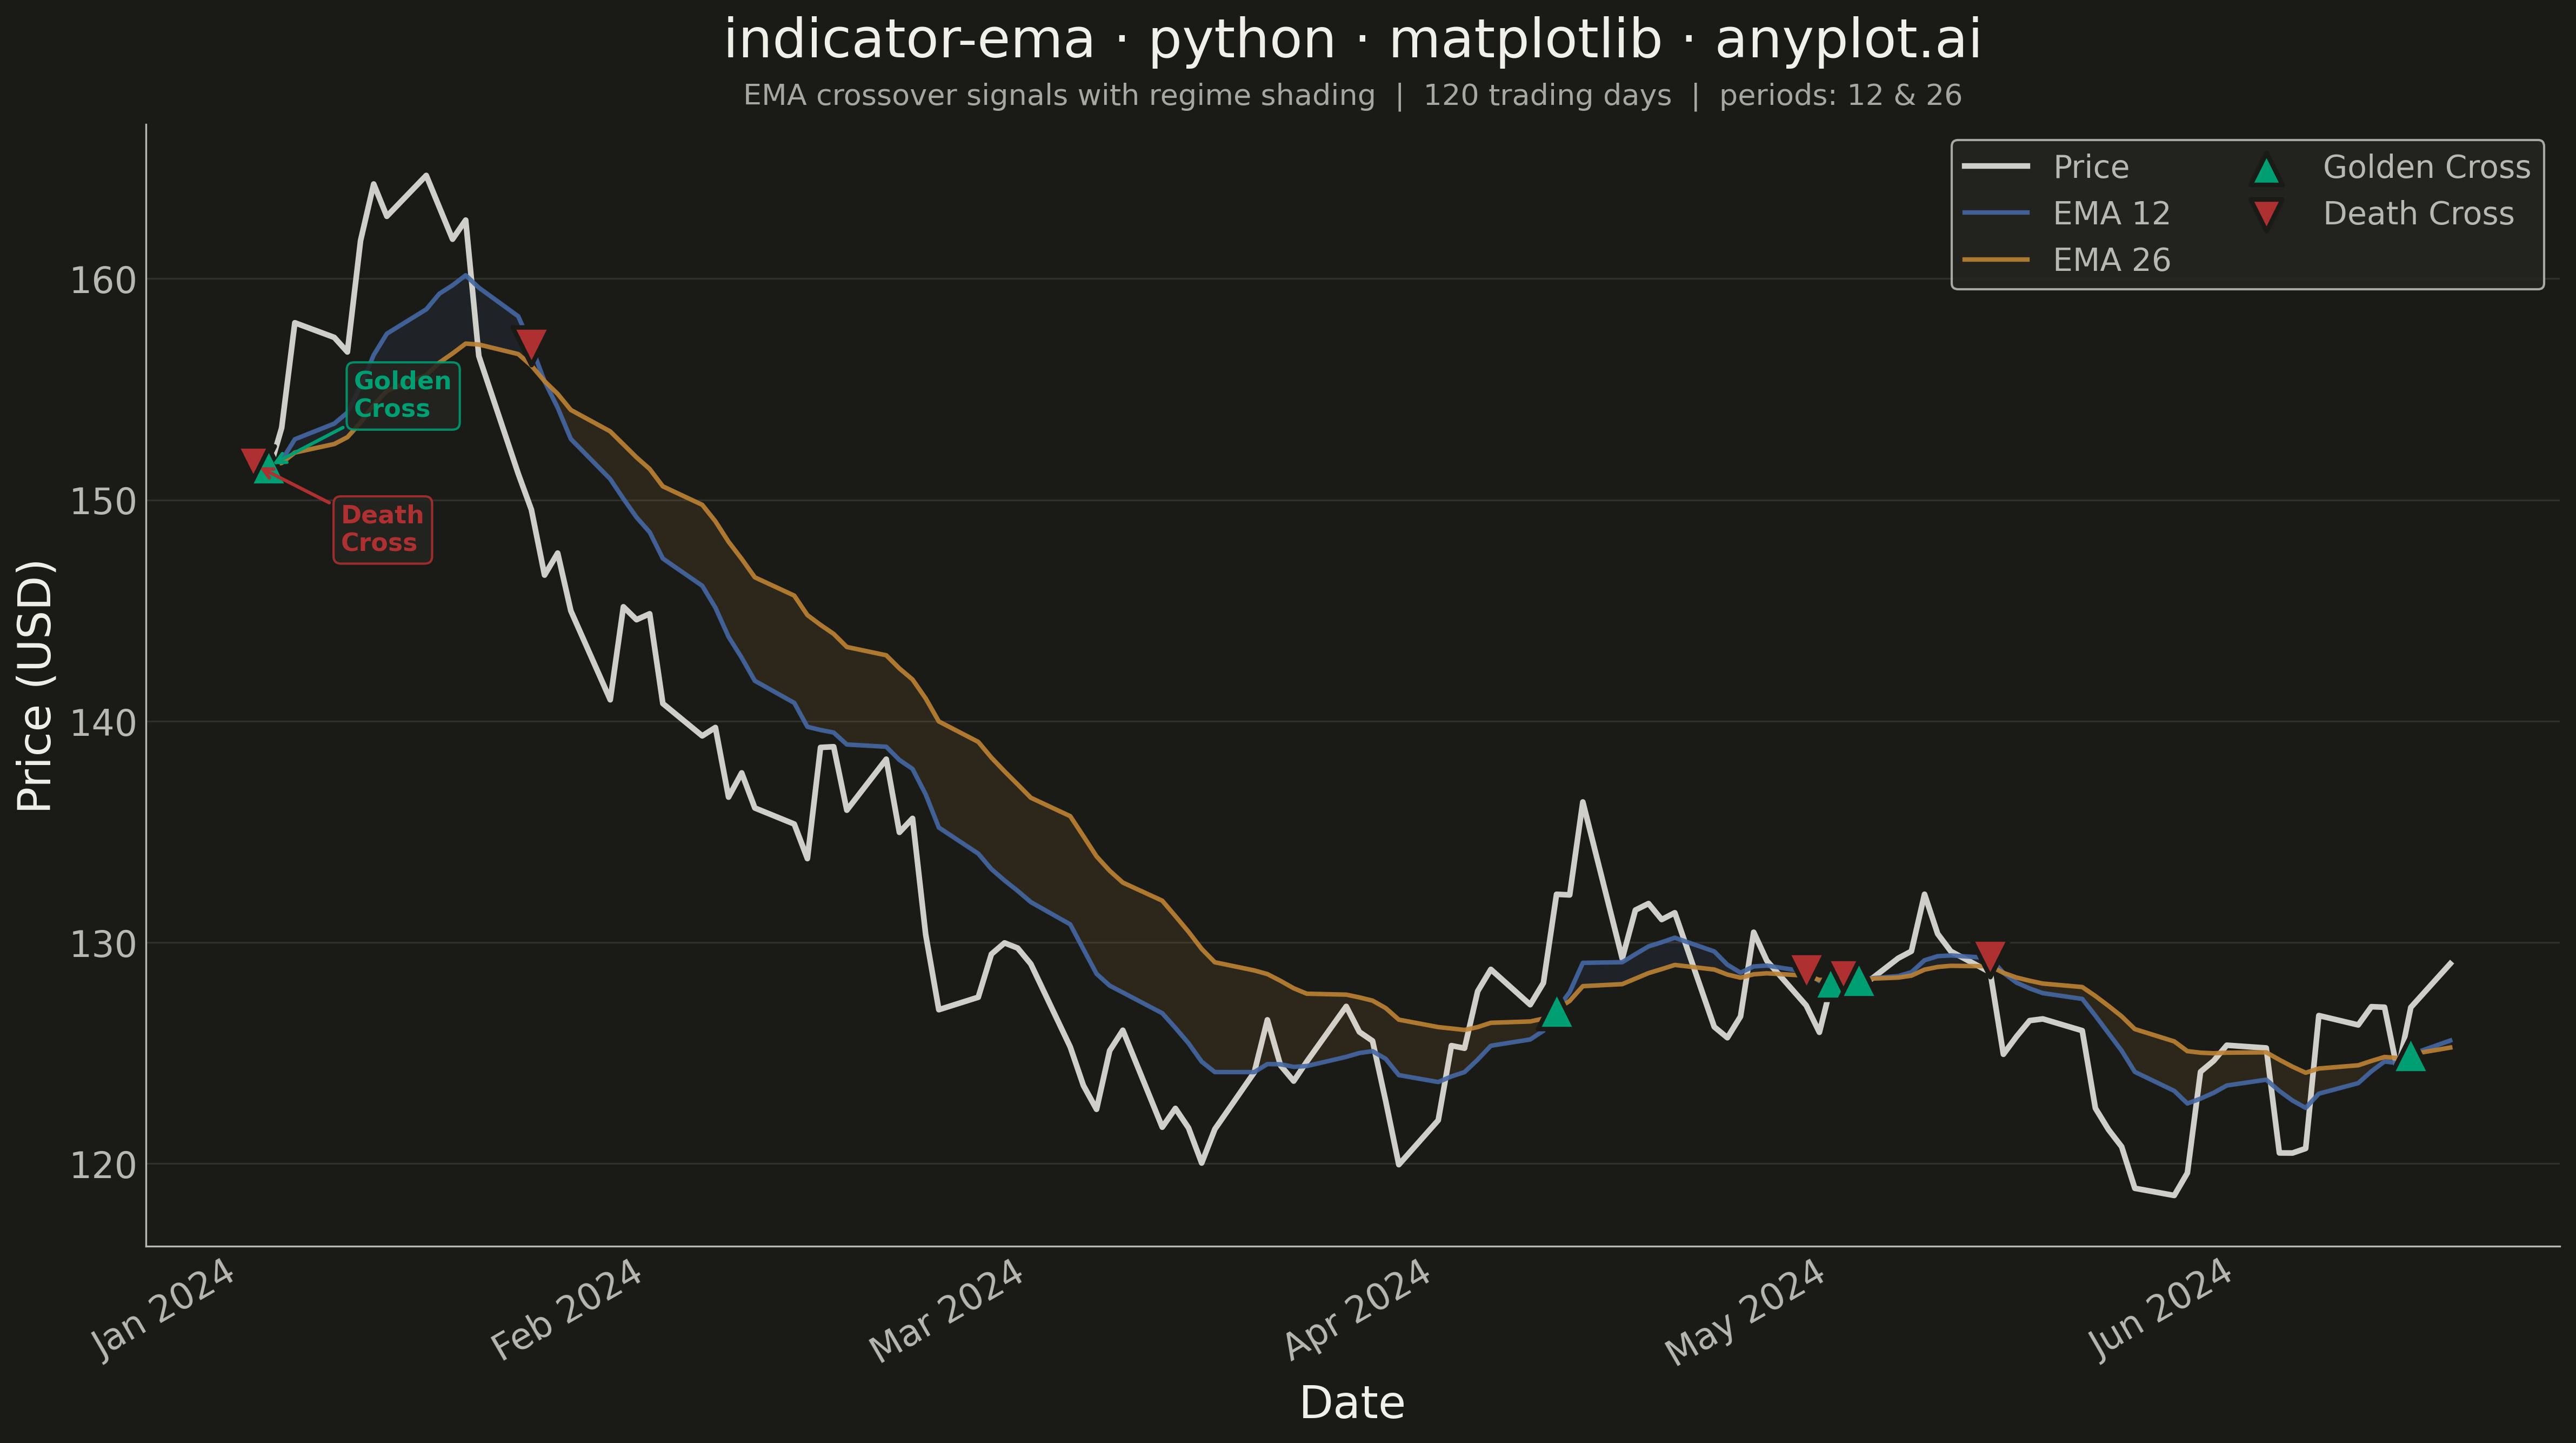
An Exponential Moving Average (EMA) overlay chart displays price data with one or more EMA lines that give greater weight to recent prices, making them more responsive to new information than simple moving averages. The EMA calculation applies an exponential weighting factor that decreases with each older data point, allowing traders to identify trends faster. This technical indicator is fundamental in trading for spotting trend direction, dynamic support/resistance levels, and crossover signals.
Preview render from the Matplotlib implementation.