The same plot in 14 other libraries — JavaScript: D3.js, Apache ECharts, Highcharts, MUI X Charts; Python: Altair, Bokeh, lets-plot, Matplotlib, Plotly, plotnine, Pygal, Seaborn; R: ggplot2; Julia: Makie.jl. Compare all 15 side by side: Exponential Moving Average (EMA) Indicator Chart in Python, R, Julia and JavaScript.
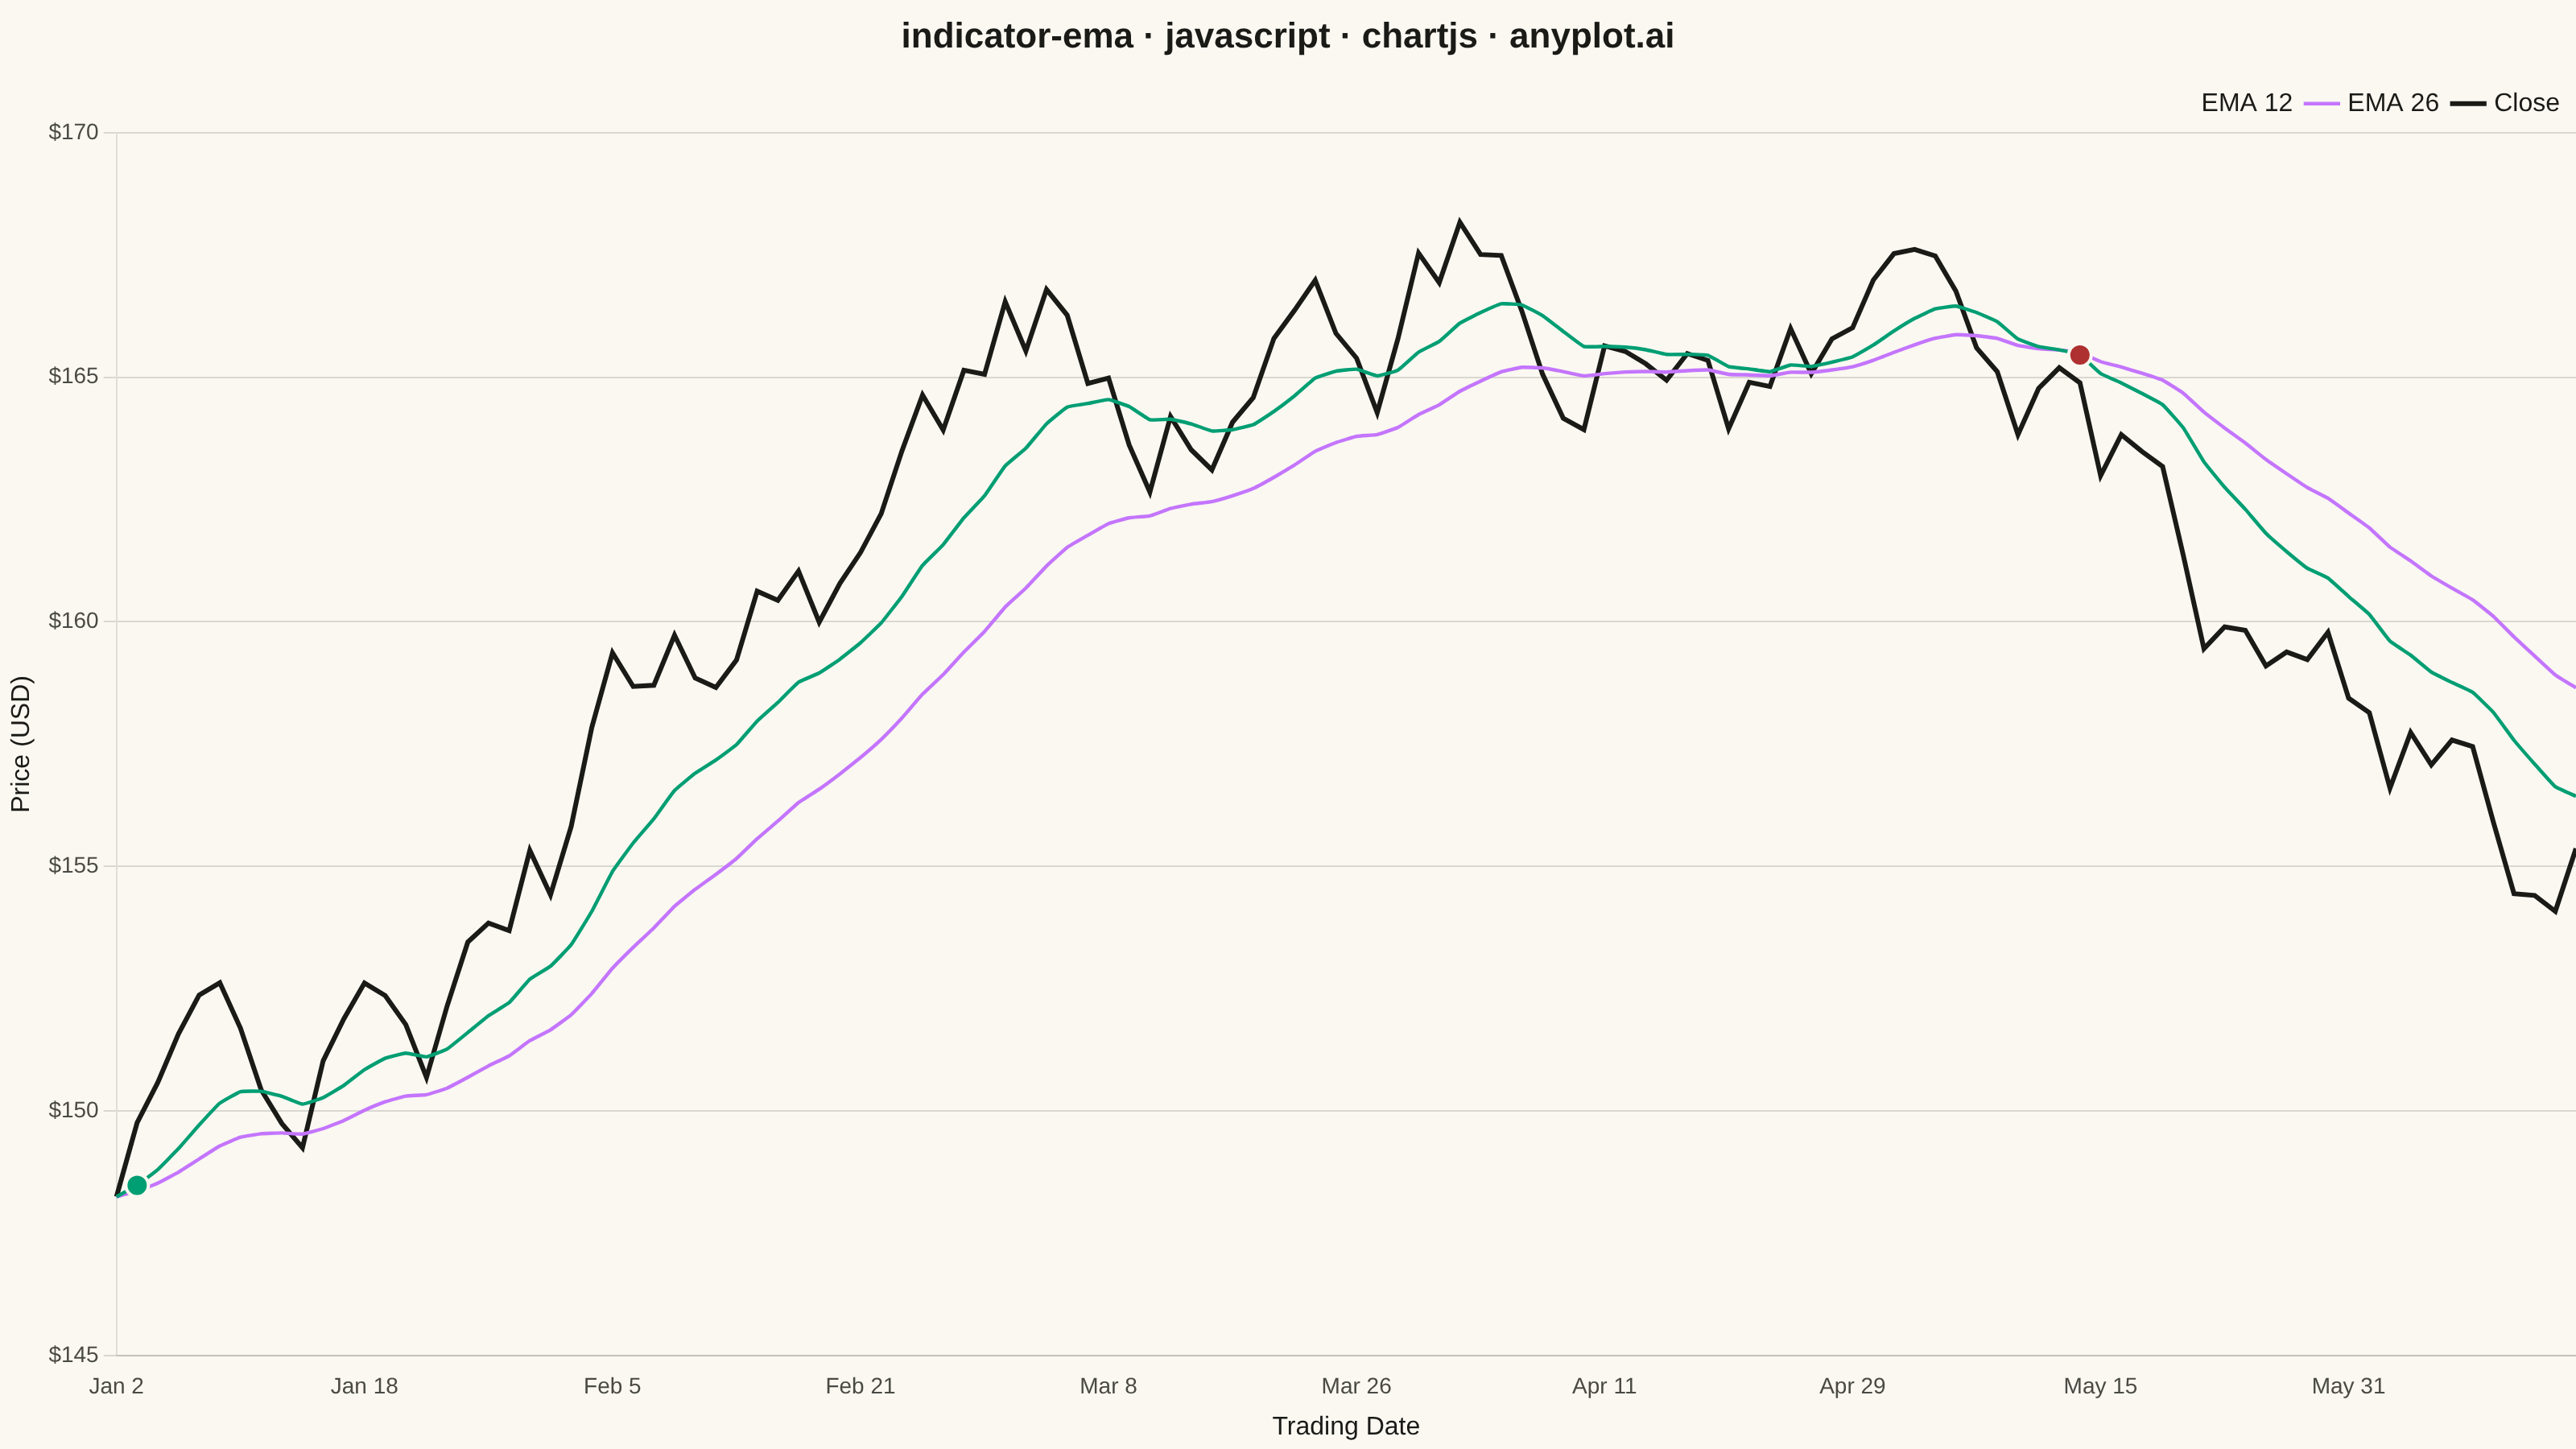
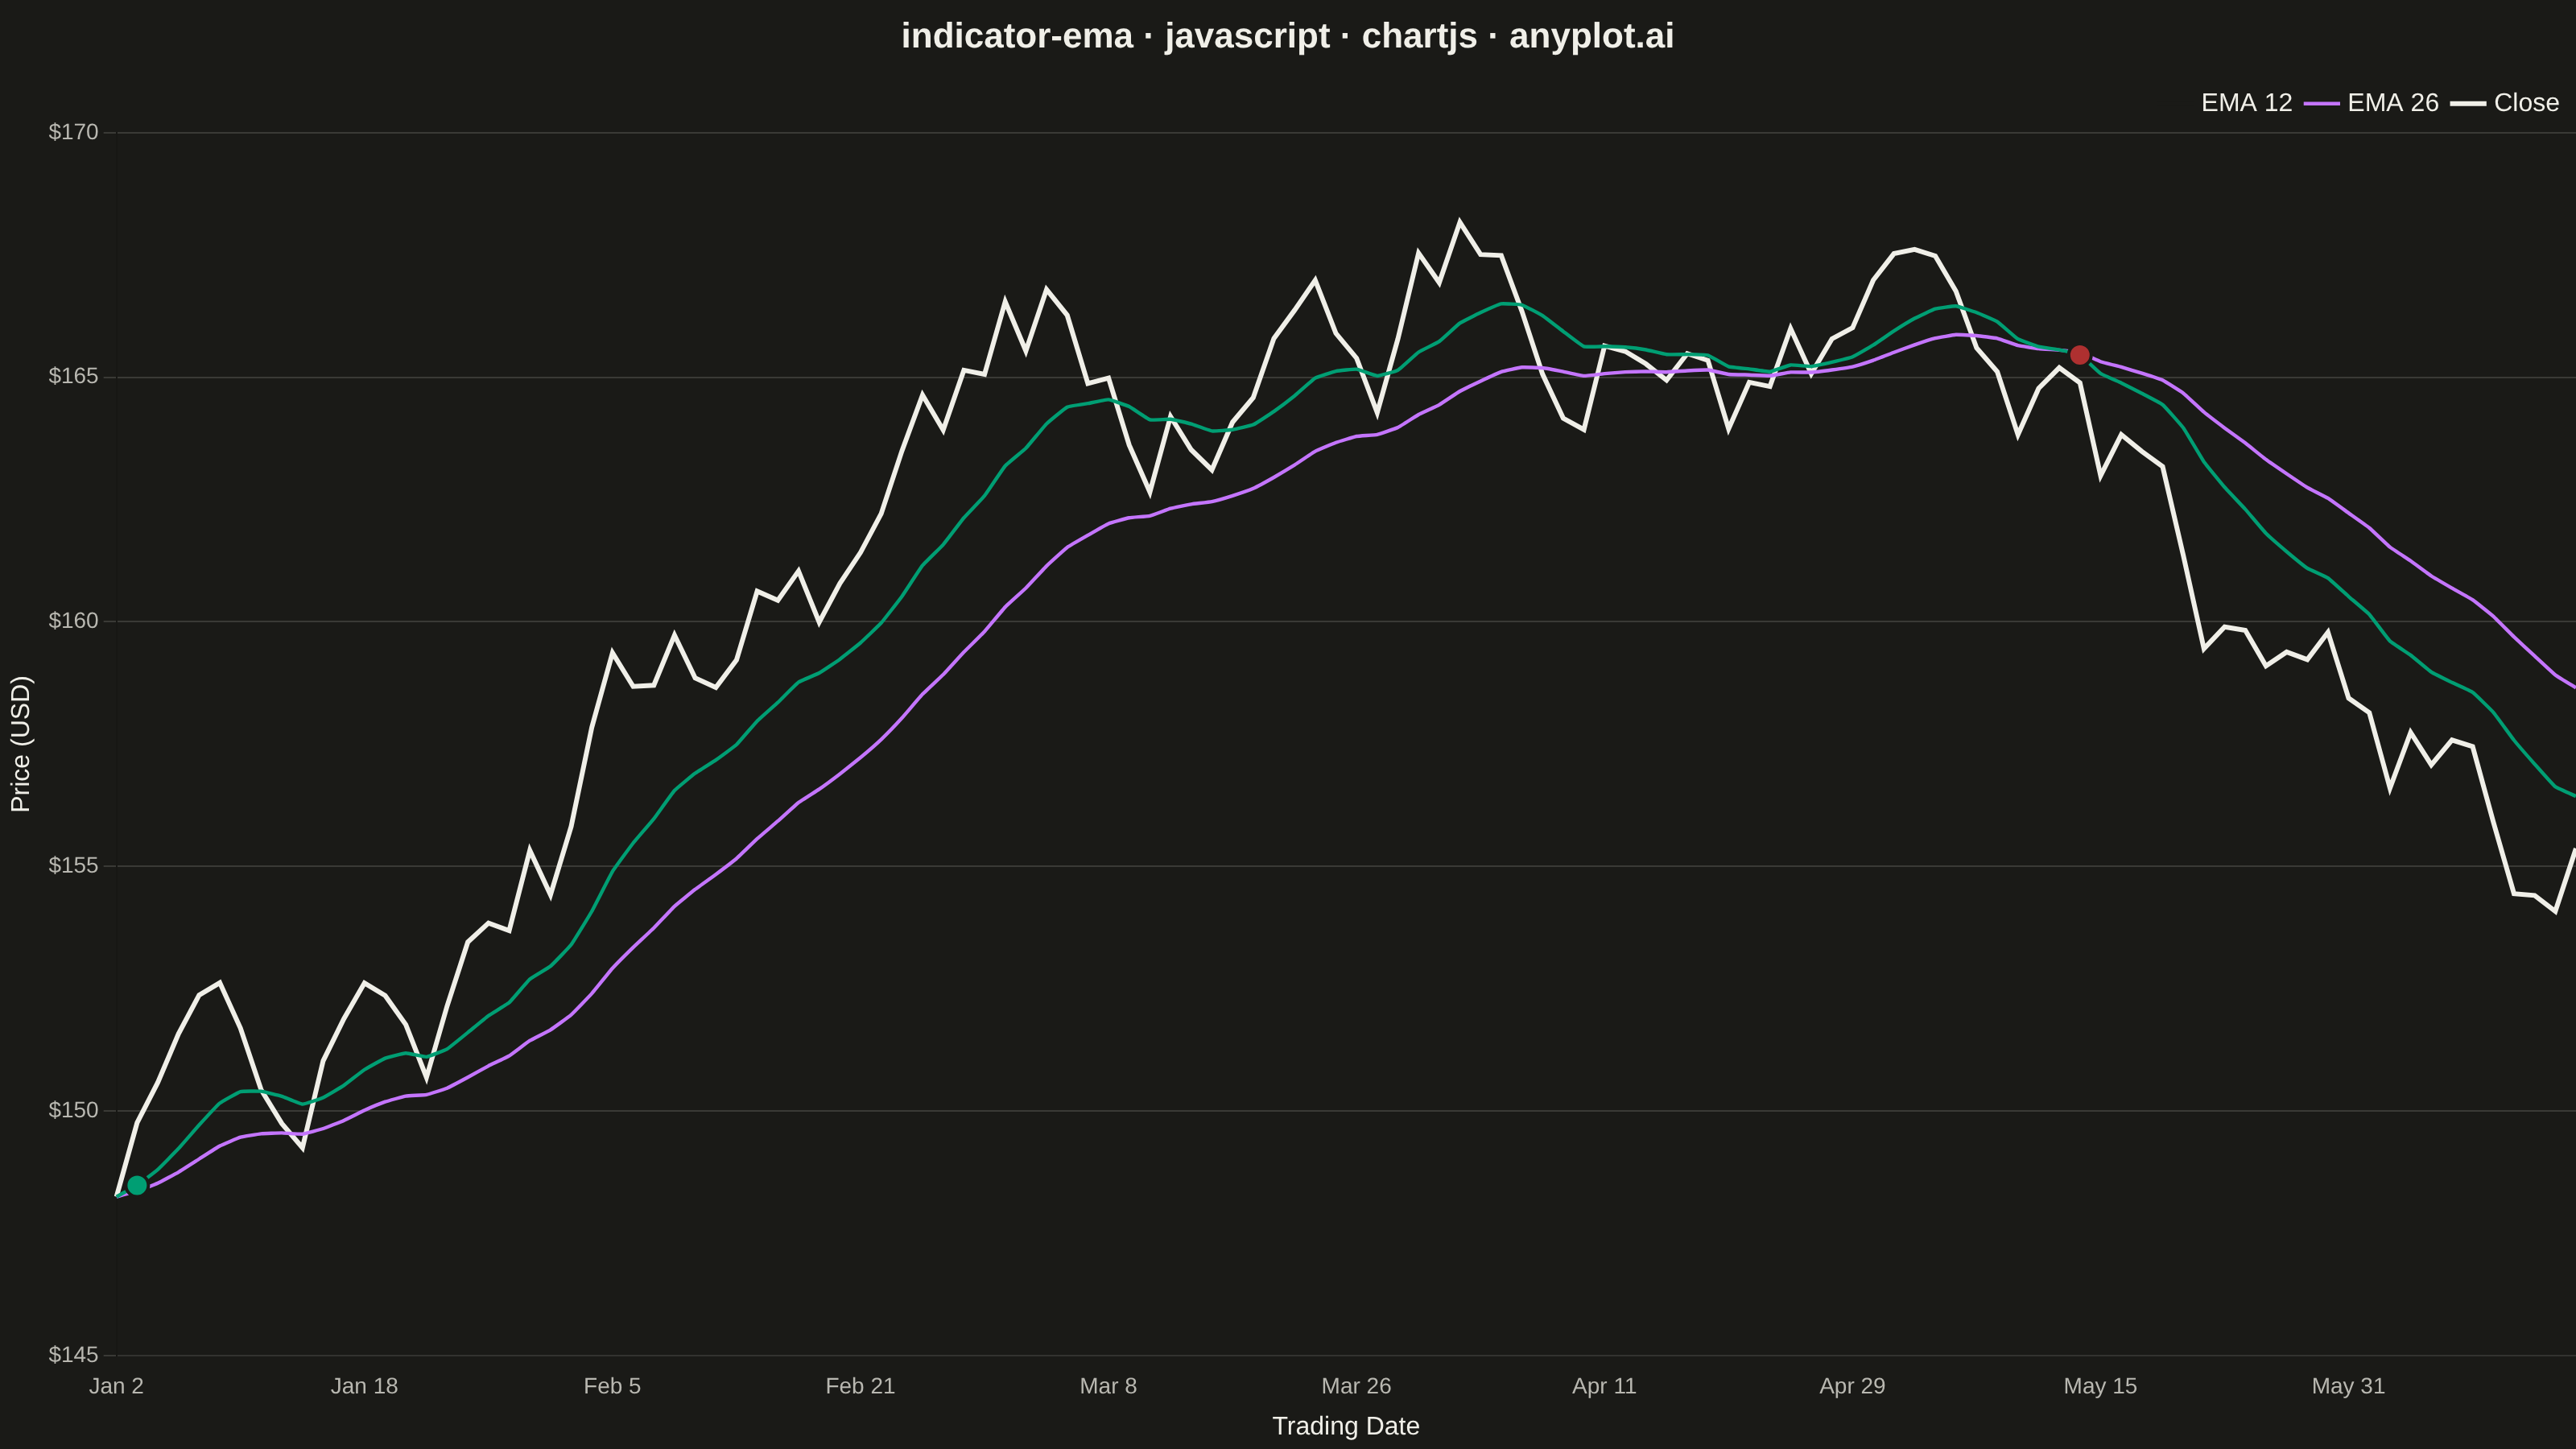
An Exponential Moving Average (EMA) overlay chart displays price data with one or more EMA lines that give greater weight to recent prices, making them more responsive to new information than simple moving averages. The EMA calculation applies an exponential weighting factor that decreases with each older data point, allowing traders to identify trends faster. This technical indicator is fundamental in trading for spotting trend direction, dynamic support/resistance levels, and crossover signals.
// anyplot.ai
// indicator-ema: Exponential Moving Average (EMA) Indicator Chart
// Library: chartjs 4.4.7 | JavaScript 22.23.2
// Quality: 86/100 | Created: 2026-09-02

//# anyplot-orientation: landscape
const t = window.ANYPLOT_TOKENS;

// --- Data (in-memory, deterministic fixed-seed LCG) -------------------------
let seed = 42;
function rand() {
  seed = (seed * 1103515245 + 12345) & 0x7fffffff;
  return seed / 0x7fffffff;
}

const periods = 120;
const shortPeriod = 12;
const longPeriod = 26;

const dates = [];
let cursor = new Date(2024, 0, 2);
while (dates.length < periods) {
  const day = cursor.getDay();
  if (day !== 0 && day !== 6) {
    dates.push(new Date(cursor));
  }
  cursor.setDate(cursor.getDate() + 1);
}
const labels = dates.map((d) => d.toLocaleDateString("en-US", { month: "short", day: "numeric" }));

const close = [];
let price = 148;
let drift = 0.35;
for (let i = 0; i < periods; i++) {
  if (i % 18 === 0) drift = (rand() - 0.45) * 1.4;
  price += drift + (rand() - 0.5) * 3.2;
  price = Math.max(price, 40);
  close.push(price);
}

function ema(values, period) {
  const alpha = 2 / (period + 1);
  const out = [values[0]];
  for (let i = 1; i < values.length; i++) {
    out.push(values[i] * alpha + out[i - 1] * (1 - alpha));
  }
  return out;
}

const emaShort = ema(close, shortPeriod);
const emaLong = ema(close, longPeriod);

// Crossover markers on the short EMA line: bullish (golden cross) → brand
// green, bearish (death cross) → matte red — the finance color convention.
const crossPointRadius = new Array(periods).fill(0);
const crossPointColor = new Array(periods).fill("rgba(0,0,0,0)");
for (let i = 1; i < periods; i++) {
  const prevDiff = emaShort[i - 1] - emaLong[i - 1];
  const currDiff = emaShort[i] - emaLong[i];
  if (prevDiff <= 0 && currDiff > 0) {
    crossPointRadius[i] = 7;
    crossPointColor[i] = t.palette[0];
  } else if (prevDiff >= 0 && currDiff < 0) {
    crossPointRadius[i] = 7;
    crossPointColor[i] = t.palette[4];
  }
}

// --- Mount -------------------------------------------------------------------
const canvas = document.createElement("canvas");
document.getElementById("container").appendChild(canvas);

// --- Chart ---------------------------------------------------------------
new Chart(canvas, {
  type: "line",
  data: {
    labels,
    datasets: [
      {
        label: "Close",
        data: close,
        borderColor: t.ink,
        backgroundColor: t.ink,
        borderWidth: 3,
        pointRadius: 0,
        tension: 0,
        order: 3,
      },
      {
        label: `EMA ${longPeriod}`,
        data: emaLong,
        borderColor: t.palette[1],
        backgroundColor: t.palette[1],
        borderWidth: 2.2,
        pointRadius: 0,
        tension: 0.1,
        order: 2,
      },
      {
        label: `EMA ${shortPeriod}`,
        data: emaShort,
        borderColor: t.palette[0],
        backgroundColor: t.palette[0],
        borderWidth: 2.2,
        tension: 0.1,
        pointRadius: crossPointRadius,
        pointBackgroundColor: crossPointColor,
        pointBorderColor: t.pageBg,
        pointBorderWidth: 2,
        order: 1,
      },
    ],
  },
  options: {
    responsive: true,
    maintainAspectRatio: false,
    animation: false,
    interaction: { intersect: false, mode: "index" },
    plugins: {
      title: {
        display: true,
        text: "indicator-ema · javascript · chartjs · anyplot.ai",
        color: t.ink,
        font: { size: 22 },
      },
      legend: {
        position: "top",
        align: "end",
        labels: { color: t.ink, font: { size: 16 }, boxWidth: 24, usePointStyle: true, pointStyle: "line" },
      },
    },
    scales: {
      x: {
        ticks: { color: t.inkSoft, font: { size: 14 }, autoSkip: true, maxRotation: 0, maxTicksLimit: 10 },
        grid: { display: false },
        title: { display: true, text: "Trading Date", color: t.ink, font: { size: 16 } },
      },
      y: {
        ticks: { color: t.inkSoft, font: { size: 14 }, callback: (v) => `$${v.toFixed(0)}` },
        grid: { color: t.grid },
        title: { display: true, text: "Price (USD)", color: t.ink, font: { size: 16 } },
      },
    },
  },
});
Runnable source as JSON, for any HTTP client: https://api.anyplot.ai/specs/indicator-ema/chartjs/code. Any spec id and library id listed in llms-full.txt fit the same URL shape; every URL below is complete and callable.
{
  "spec_id": "indicator-ema",
  "language": "javascript",
  "library": "chartjs",
  "page": "https://anyplot.ai/indicator-ema/javascript/chartjs",
  "hub": "https://anyplot.ai/indicator-ema",
  "code_json": "https://api.anyplot.ai/specs/indicator-ema/chartjs/code",
  "spec_json": "https://api.anyplot.ai/specs/indicator-ema",
  "render_light_png": "https://storage.googleapis.com/anyplot-images/plots/indicator-ema/javascript/chartjs/plot-light.png",
  "render_dark_png": "https://storage.googleapis.com/anyplot-images/plots/indicator-ema/javascript/chartjs/plot-dark.png",
  "interactive_light_html": "https://storage.googleapis.com/anyplot-images/plots/indicator-ema/javascript/chartjs/plot-light.html",
  "interactive_dark_html": "https://storage.googleapis.com/anyplot-images/plots/indicator-ema/javascript/chartjs/plot-dark.html",
  "quality_score": 86.0,
  "license": "MIT",
  "guide": "https://anyplot.ai/llms.txt"
}
Part of Exponential Moving Average (EMA) Indicator Chart on anyplot.ai.