The same plot in 14 other libraries — Python: Altair, Bokeh, lets-plot, Matplotlib, Plotly, plotnine, Pygal, Seaborn; R: ggplot2; JavaScript: Chart.js, D3.js, Apache ECharts, Highcharts, MUI X Charts. Compare all 15 side by side: Exponential Moving Average (EMA) Indicator Chart in Python, R, Julia and JavaScript.
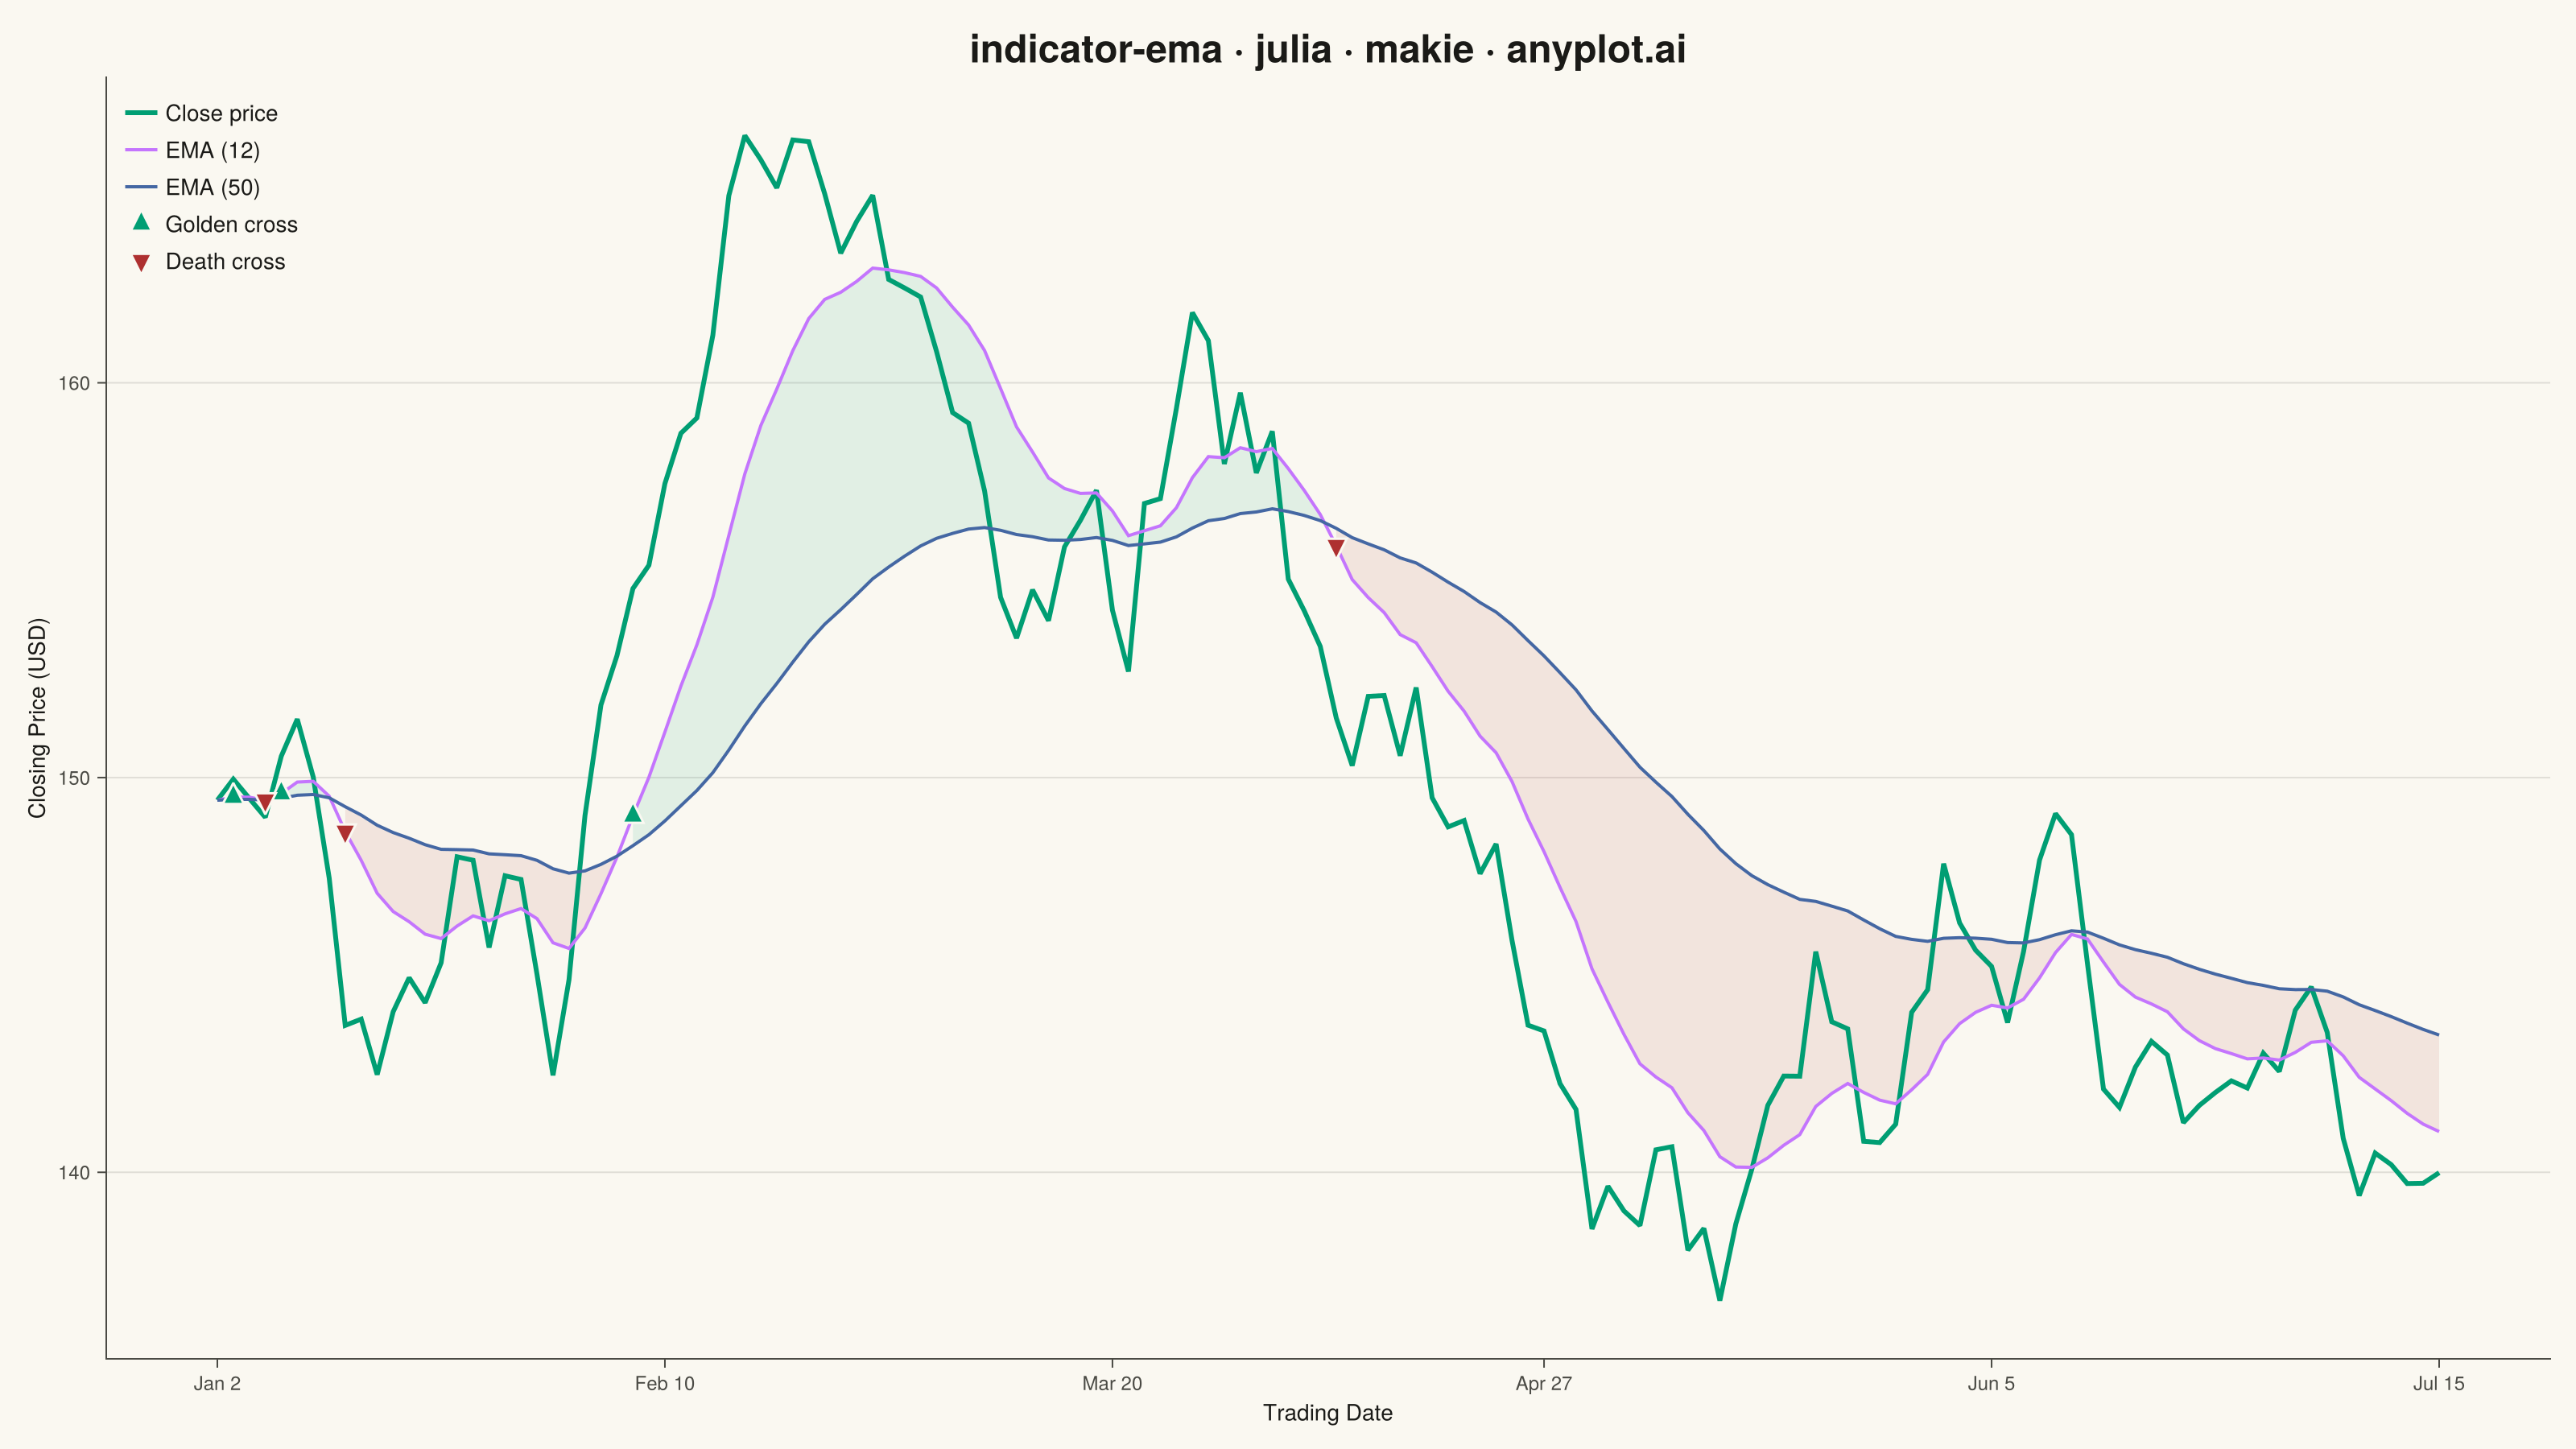
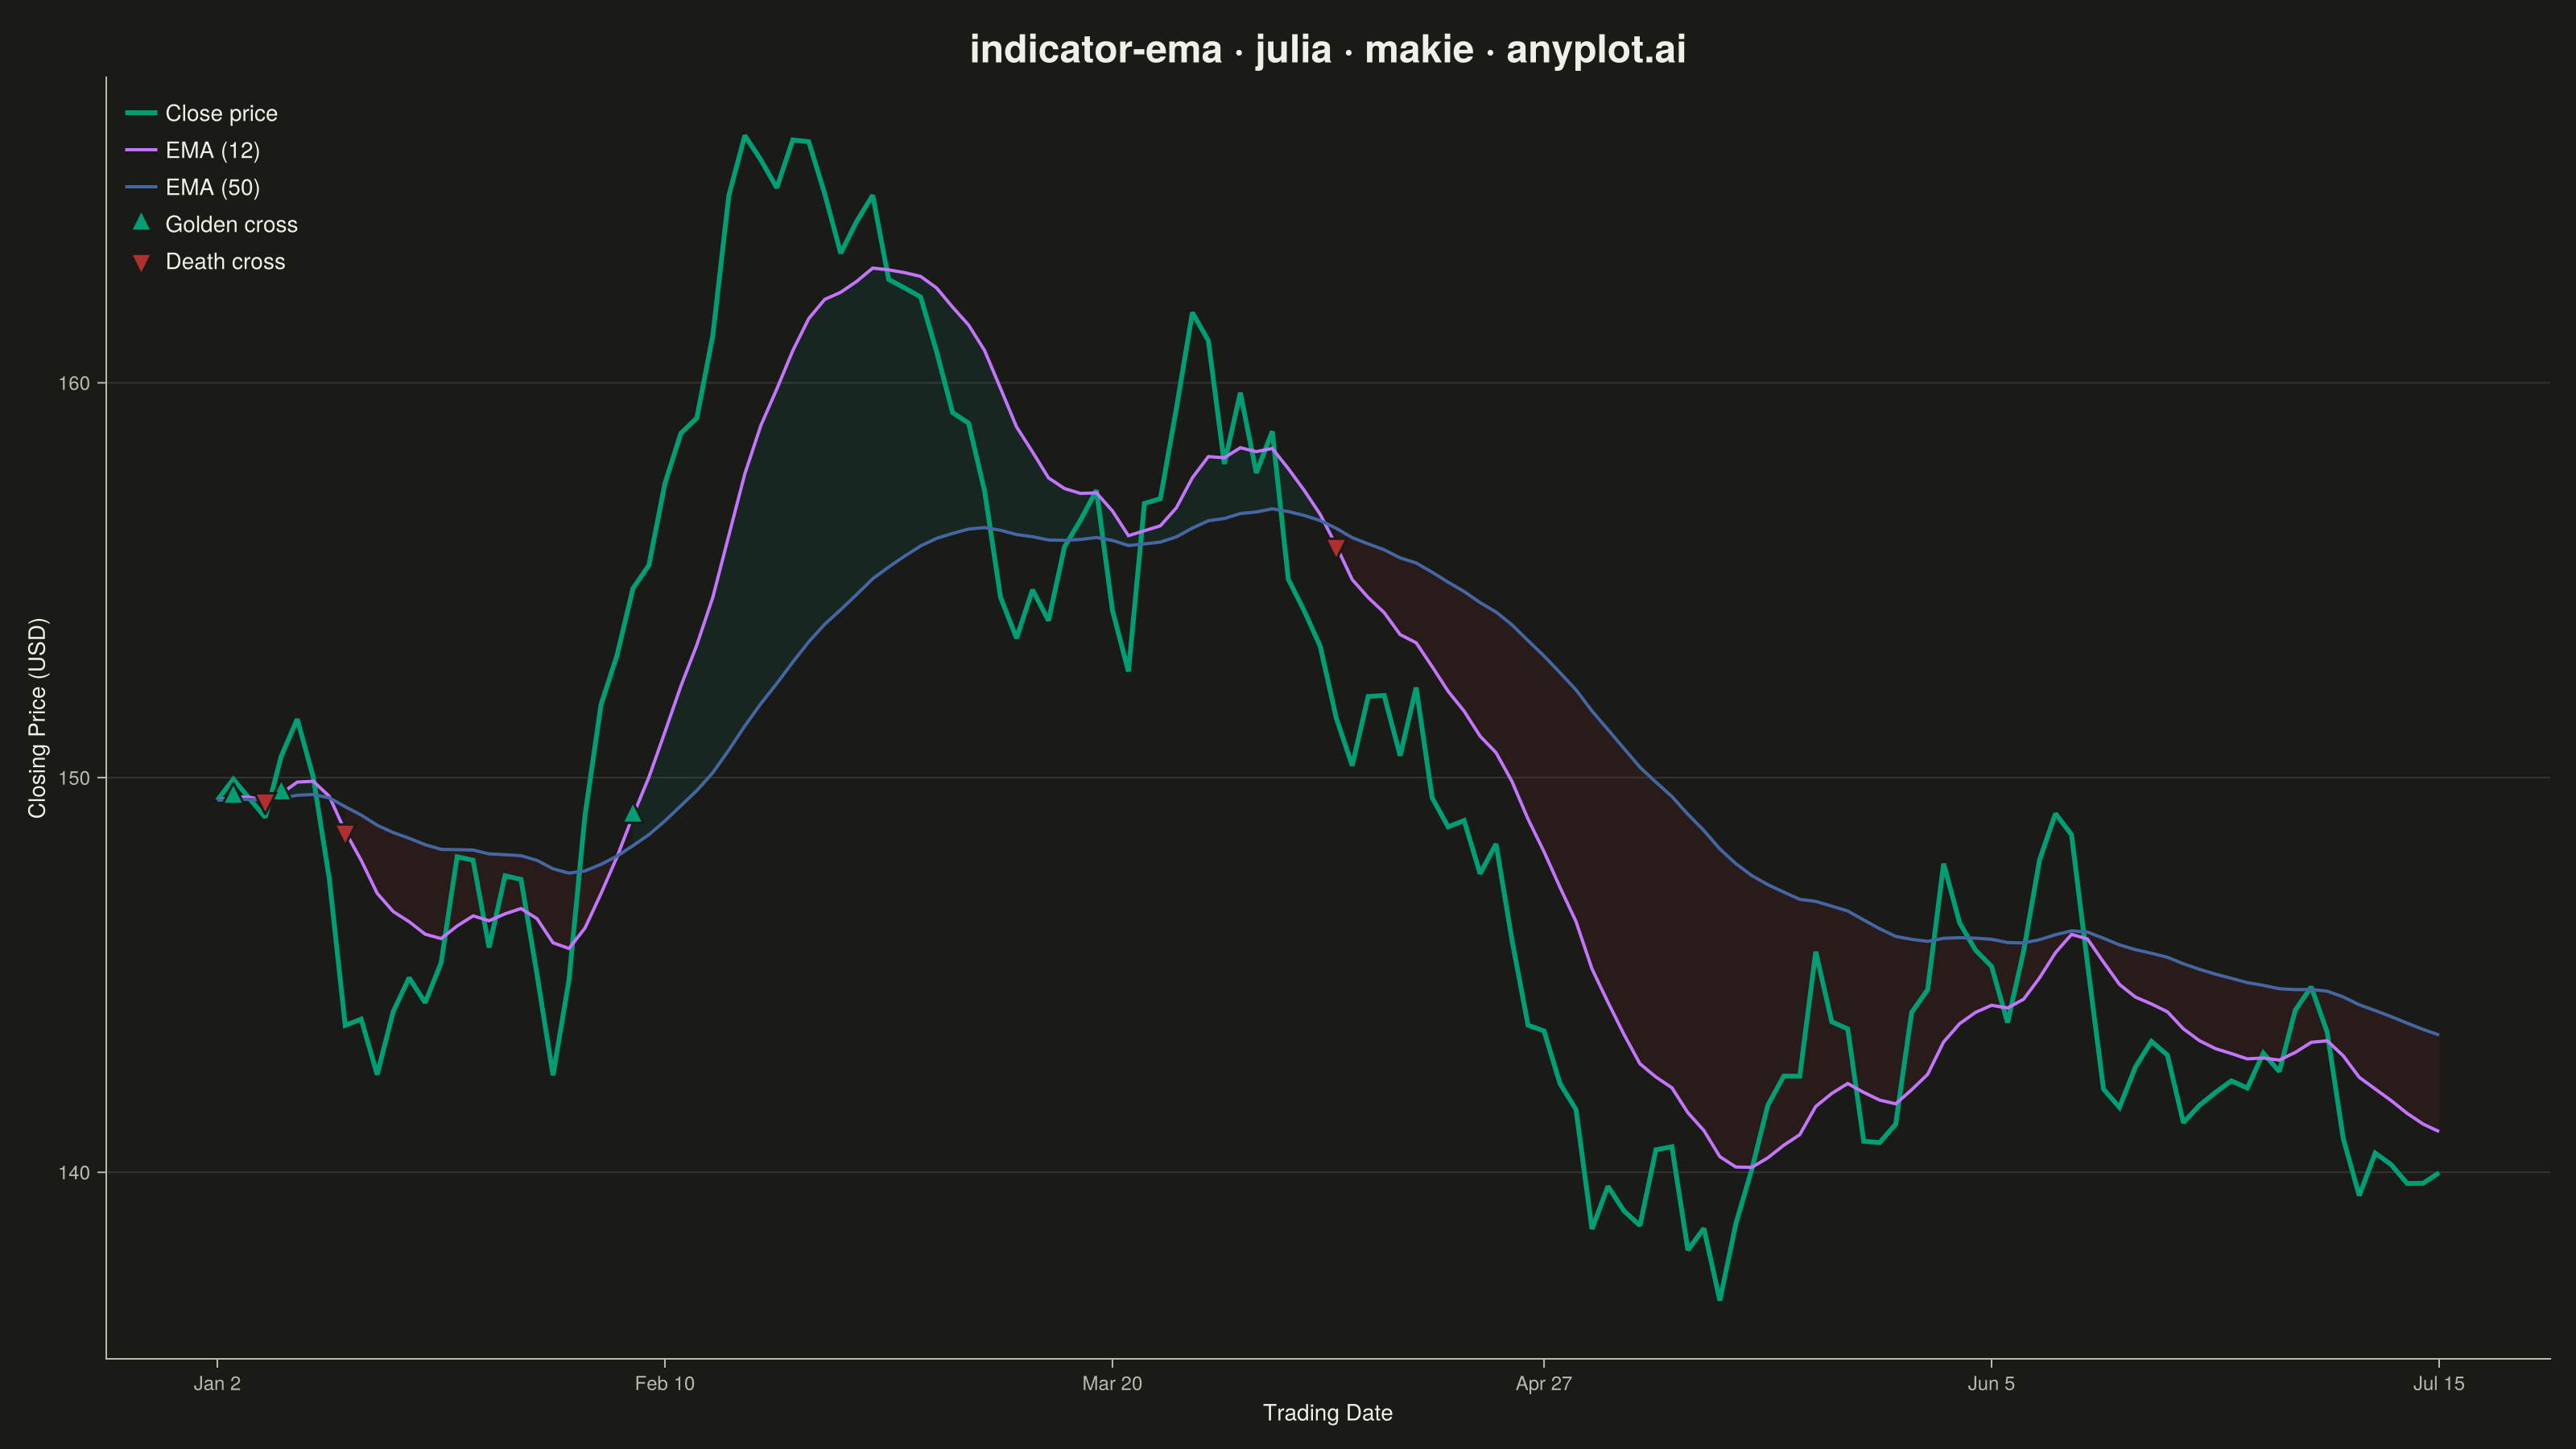
An Exponential Moving Average (EMA) overlay chart displays price data with one or more EMA lines that give greater weight to recent prices, making them more responsive to new information than simple moving averages. The EMA calculation applies an exponential weighting factor that decreases with each older data point, allowing traders to identify trends faster. This technical indicator is fundamental in trading for spotting trend direction, dynamic support/resistance levels, and crossover signals.
# anyplot.ai
# indicator-ema: Exponential Moving Average (EMA) Indicator Chart
# Library: makie 0.21.9 | Julia 1.11.9
# Quality: 88/100 | Created: 2026-09-02

using CairoMakie
using Colors
using Random
using Dates

Random.seed!(42)

# --- Theme tokens -------------------------------------------------------
const THEME    = get(ENV, "ANYPLOT_THEME", "light")
const PAGE_BG  = THEME == "light" ? colorant"#FAF8F1" : colorant"#1A1A17"
const INK      = THEME == "light" ? colorant"#1A1A17" : colorant"#F0EFE8"
const INK_SOFT = THEME == "light" ? colorant"#4A4A44" : colorant"#B8B7B0"
const IMPRINT_PALETTE = [
    colorant"#009E73", colorant"#C475FD", colorant"#4467A3", colorant"#BD8233",
    colorant"#AE3030", colorant"#2ABCCD", colorant"#954477", colorant"#99B314",
]

# --- Data -----------------------------------------------------------------
n_days = 140
trading_days = 1:n_days
start_date = Date(2024, 1, 2)
dates = [start_date + Day(round(Int, 1.4 * (i - 1))) for i in trading_days]

daily_returns = randn(n_days) .* 1.8 .+ 0.08
close_price = 150.0 .+ cumsum(daily_returns)

# 12-day EMA (short-term momentum)
alpha_short = 2 / (12 + 1)
ema_short = similar(close_price)
ema_short[1] = close_price[1]
for i in 2:n_days
    ema_short[i] = alpha_short * close_price[i] + (1 - alpha_short) * ema_short[i - 1]
end

# 50-day EMA (long-term trend)
alpha_long = 2 / (50 + 1)
ema_long = similar(close_price)
ema_long[1] = close_price[1]
for i in 2:n_days
    ema_long[i] = alpha_long * close_price[i] + (1 - alpha_long) * ema_long[i - 1]
end

# Crossover points: sign changes of (short - long)
diff_ema = ema_short .- ema_long
crossover_idx = Int[]
for i in 2:n_days
    if sign(diff_ema[i]) != sign(diff_ema[i - 1])
        push!(crossover_idx, i)
    end
end

# Golden cross (bullish, short EMA moves above long EMA) vs. death cross (bearish)
golden_idx = filter(i -> diff_ema[i] > 0, crossover_idx)
death_idx = filter(i -> diff_ema[i] < 0, crossover_idx)

# Trend-regime segments (for band shading): contiguous runs of one sign
regime_bounds = sort(unique(vcat(1, crossover_idx, n_days + 1)))

# --- Plot -------------------------------------------------------------------
fig = Figure(
    size            = (1600, 900),
    fontsize        = 14,
    backgroundcolor = PAGE_BG,
)

ax = Axis(
    fig[1, 1];
    title             = "indicator-ema · julia · makie · anyplot.ai",
    titlesize         = 24,
    titlecolor        = INK,
    xlabel            = "Trading Date",
    ylabel            = "Closing Price (USD)",
    xlabelsize        = 14,
    ylabelsize        = 14,
    xlabelcolor       = INK,
    ylabelcolor       = INK,
    xticklabelsize    = 12,
    yticklabelsize    = 12,
    xticklabelcolor   = INK_SOFT,
    yticklabelcolor   = INK_SOFT,
    xtickcolor        = INK_SOFT,
    ytickcolor        = INK_SOFT,
    backgroundcolor   = PAGE_BG,
    topspinevisible   = false,
    rightspinevisible = false,
    leftspinecolor    = INK_SOFT,
    bottomspinecolor  = INK_SOFT,
    xgridvisible      = false,
    ygridcolor        = RGBAf(INK.r, INK.g, INK.b, 0.12),
)

tick_positions = round.(Int, range(1, n_days; length = 6))
ax.xticks = (tick_positions, [Dates.format(dates[i], "u d") for i in tick_positions])

# Trend-regime shading: tint the band between the two EMAs by prevailing
# direction (bullish short-over-long vs. bearish), so the golden/death cross
# story reads at a glance before you even spot the marker.
bullish_fill = RGBAf(IMPRINT_PALETTE[1].r, IMPRINT_PALETTE[1].g, IMPRINT_PALETTE[1].b, 0.10)
bearish_fill = RGBAf(IMPRINT_PALETTE[5].r, IMPRINT_PALETTE[5].g, IMPRINT_PALETTE[5].b, 0.10)
for k in 1:(length(regime_bounds) - 1)
    seg_start = regime_bounds[k]
    seg_end = regime_bounds[k + 1] - 1
    seg_end < seg_start && continue
    seg = seg_start:seg_end
    band!(
        ax, trading_days[seg], ema_long[seg], ema_short[seg];
        color = diff_ema[seg_start] >= 0 ? bullish_fill : bearish_fill,
    )
end

lines!(ax, trading_days, close_price; color = IMPRINT_PALETTE[1], linewidth = 3.0, label = "Close price")
lines!(ax, trading_days, ema_short; color = IMPRINT_PALETTE[2], linewidth = 2.0, label = "EMA (12)")
lines!(ax, trading_days, ema_long; color = IMPRINT_PALETTE[3], linewidth = 2.0, label = "EMA (50)")

scatter!(
    ax, trading_days[golden_idx], ema_short[golden_idx];
    color = IMPRINT_PALETTE[1], markersize = 18, marker = :utriangle,
    strokewidth = 1.5, strokecolor = PAGE_BG, label = "Golden cross",
)
scatter!(
    ax, trading_days[death_idx], ema_short[death_idx];
    color = IMPRINT_PALETTE[5], markersize = 18, marker = :dtriangle,
    strokewidth = 1.5, strokecolor = PAGE_BG, label = "Death cross",
)

axislegend(ax; position = :lt, framevisible = false, labelcolor = INK, backgroundcolor = :transparent)

# --- Save -------------------------------------------------------------------
save("plot-$(THEME).png", fig; px_per_unit = 2)
Runnable source as JSON, for any HTTP client: https://api.anyplot.ai/specs/indicator-ema/makie/code. Any spec id and library id listed in llms-full.txt fit the same URL shape; every URL below is complete and callable.
{
  "spec_id": "indicator-ema",
  "language": "julia",
  "library": "makie",
  "page": "https://anyplot.ai/indicator-ema/julia/makie",
  "hub": "https://anyplot.ai/indicator-ema",
  "code_json": "https://api.anyplot.ai/specs/indicator-ema/makie/code",
  "spec_json": "https://api.anyplot.ai/specs/indicator-ema",
  "render_light_png": "https://storage.googleapis.com/anyplot-images/plots/indicator-ema/julia/makie/plot-light.png",
  "render_dark_png": "https://storage.googleapis.com/anyplot-images/plots/indicator-ema/julia/makie/plot-dark.png",
  "quality_score": 88.0,
  "license": "MIT",
  "guide": "https://anyplot.ai/llms.txt"
}
Part of Exponential Moving Average (EMA) Indicator Chart on anyplot.ai.