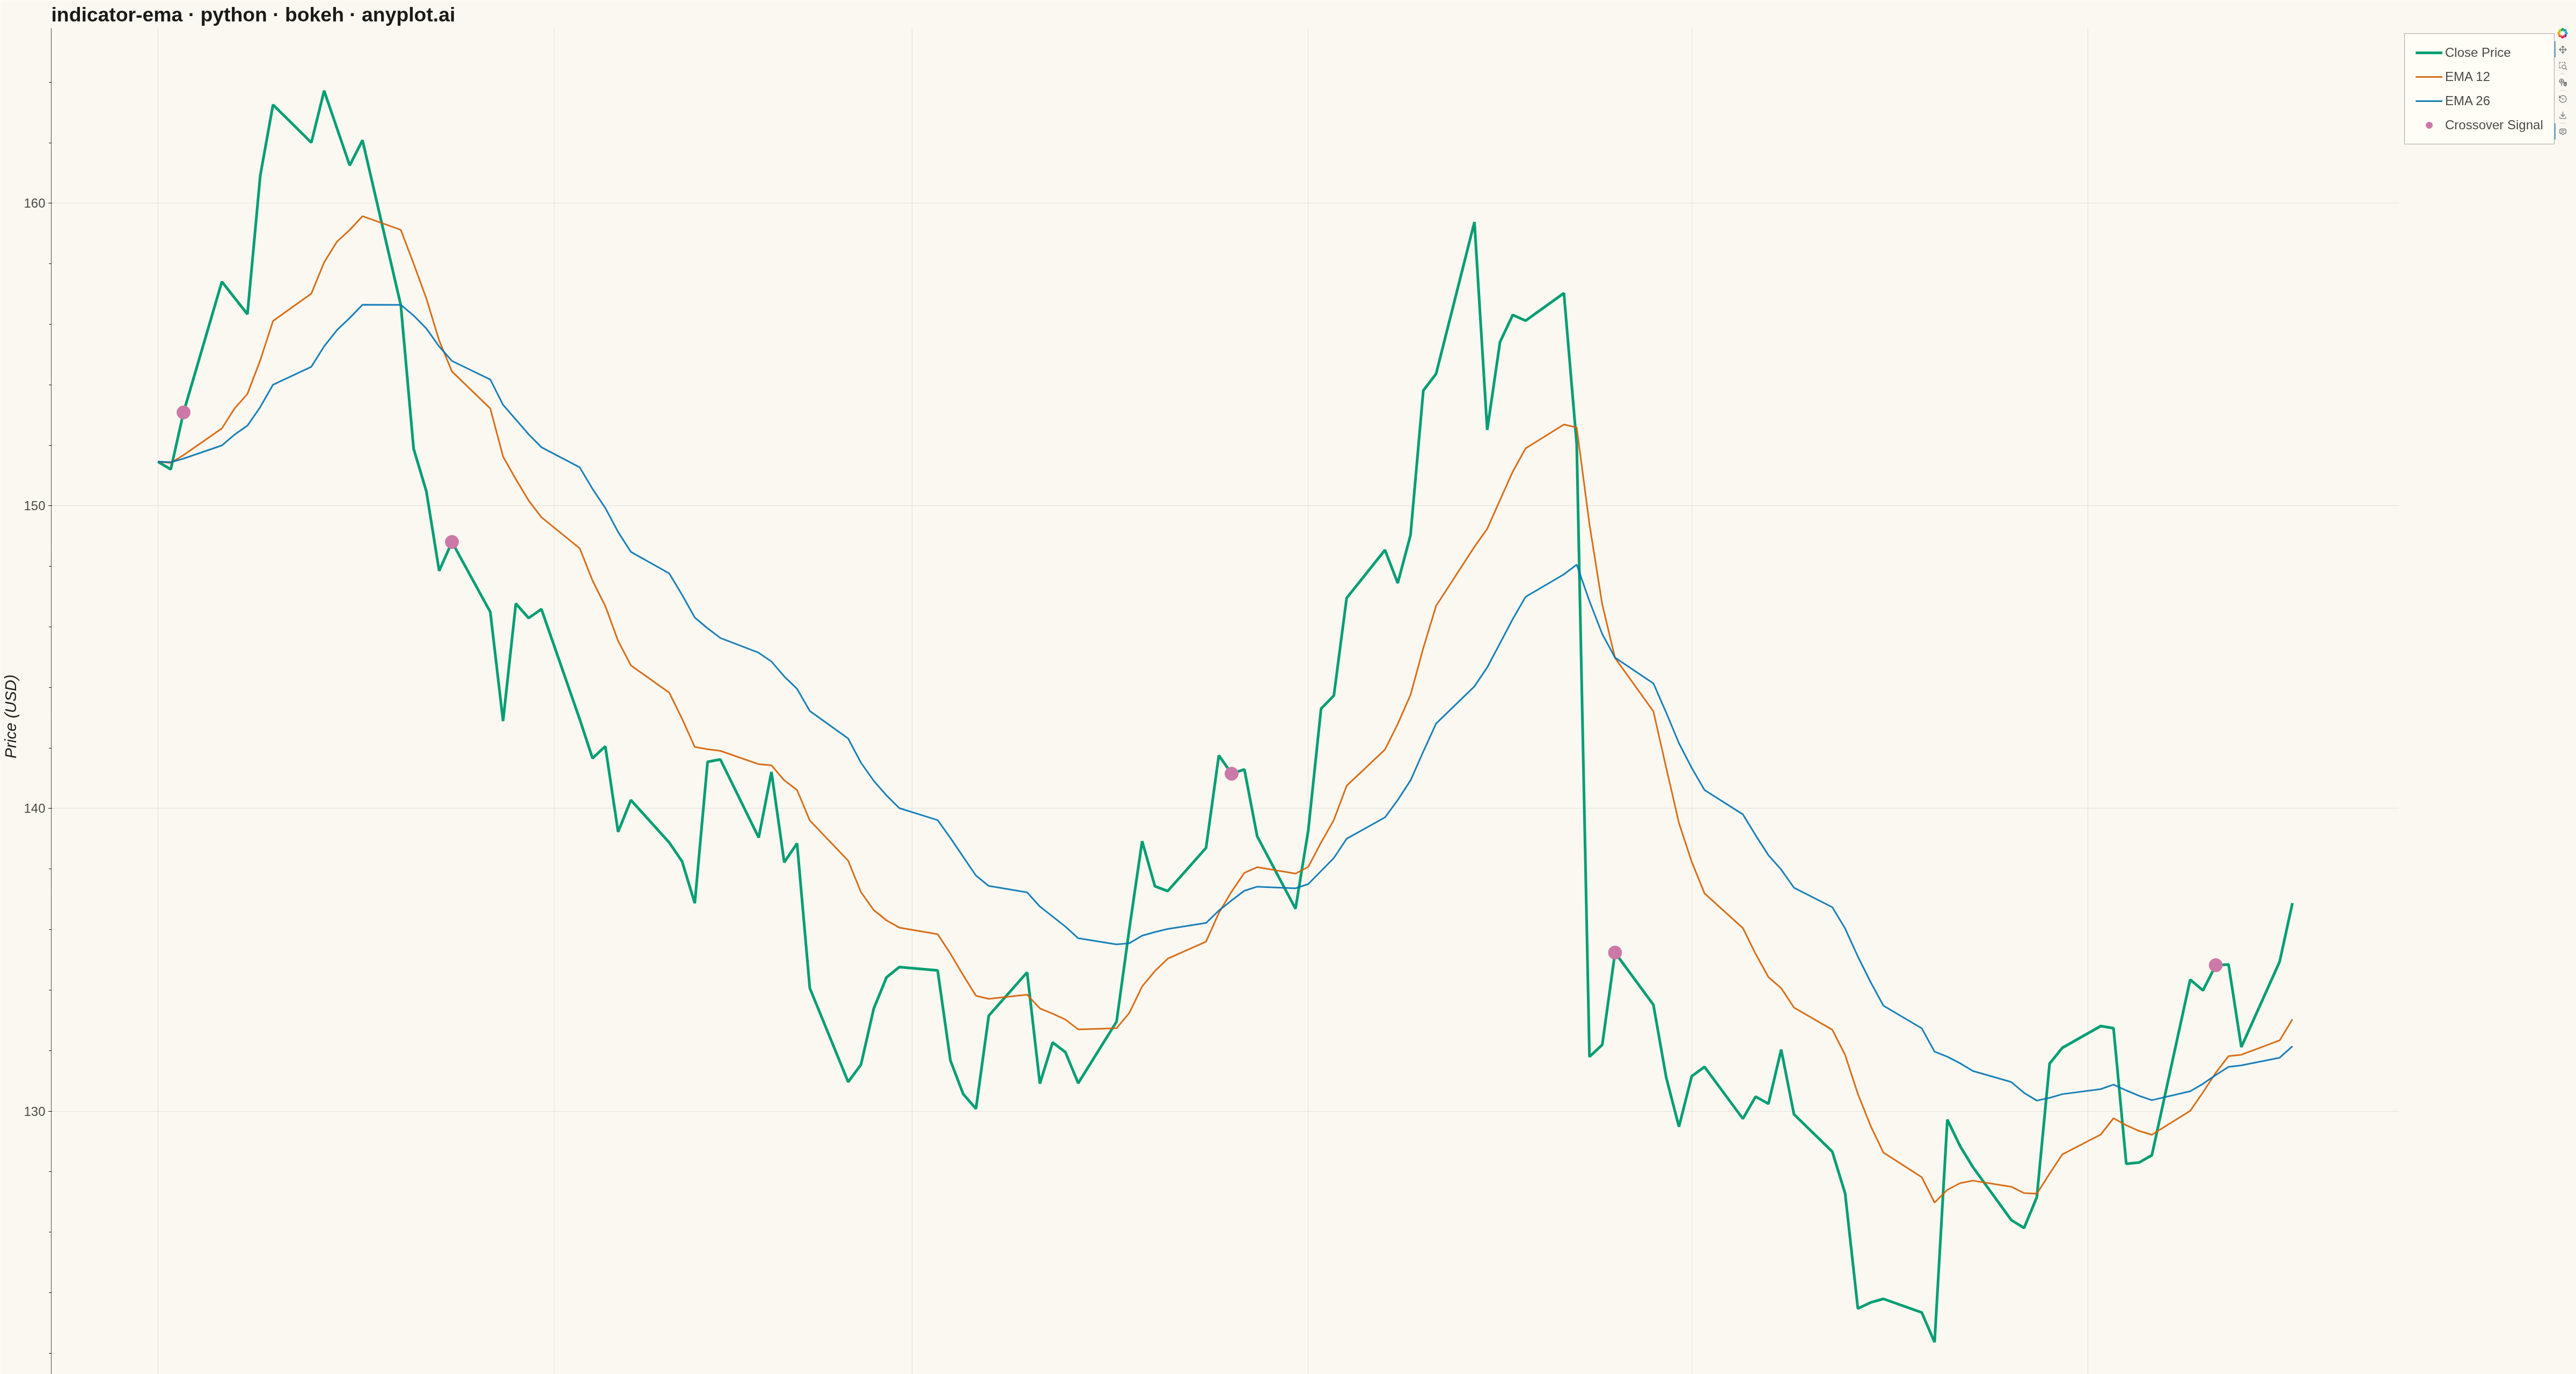
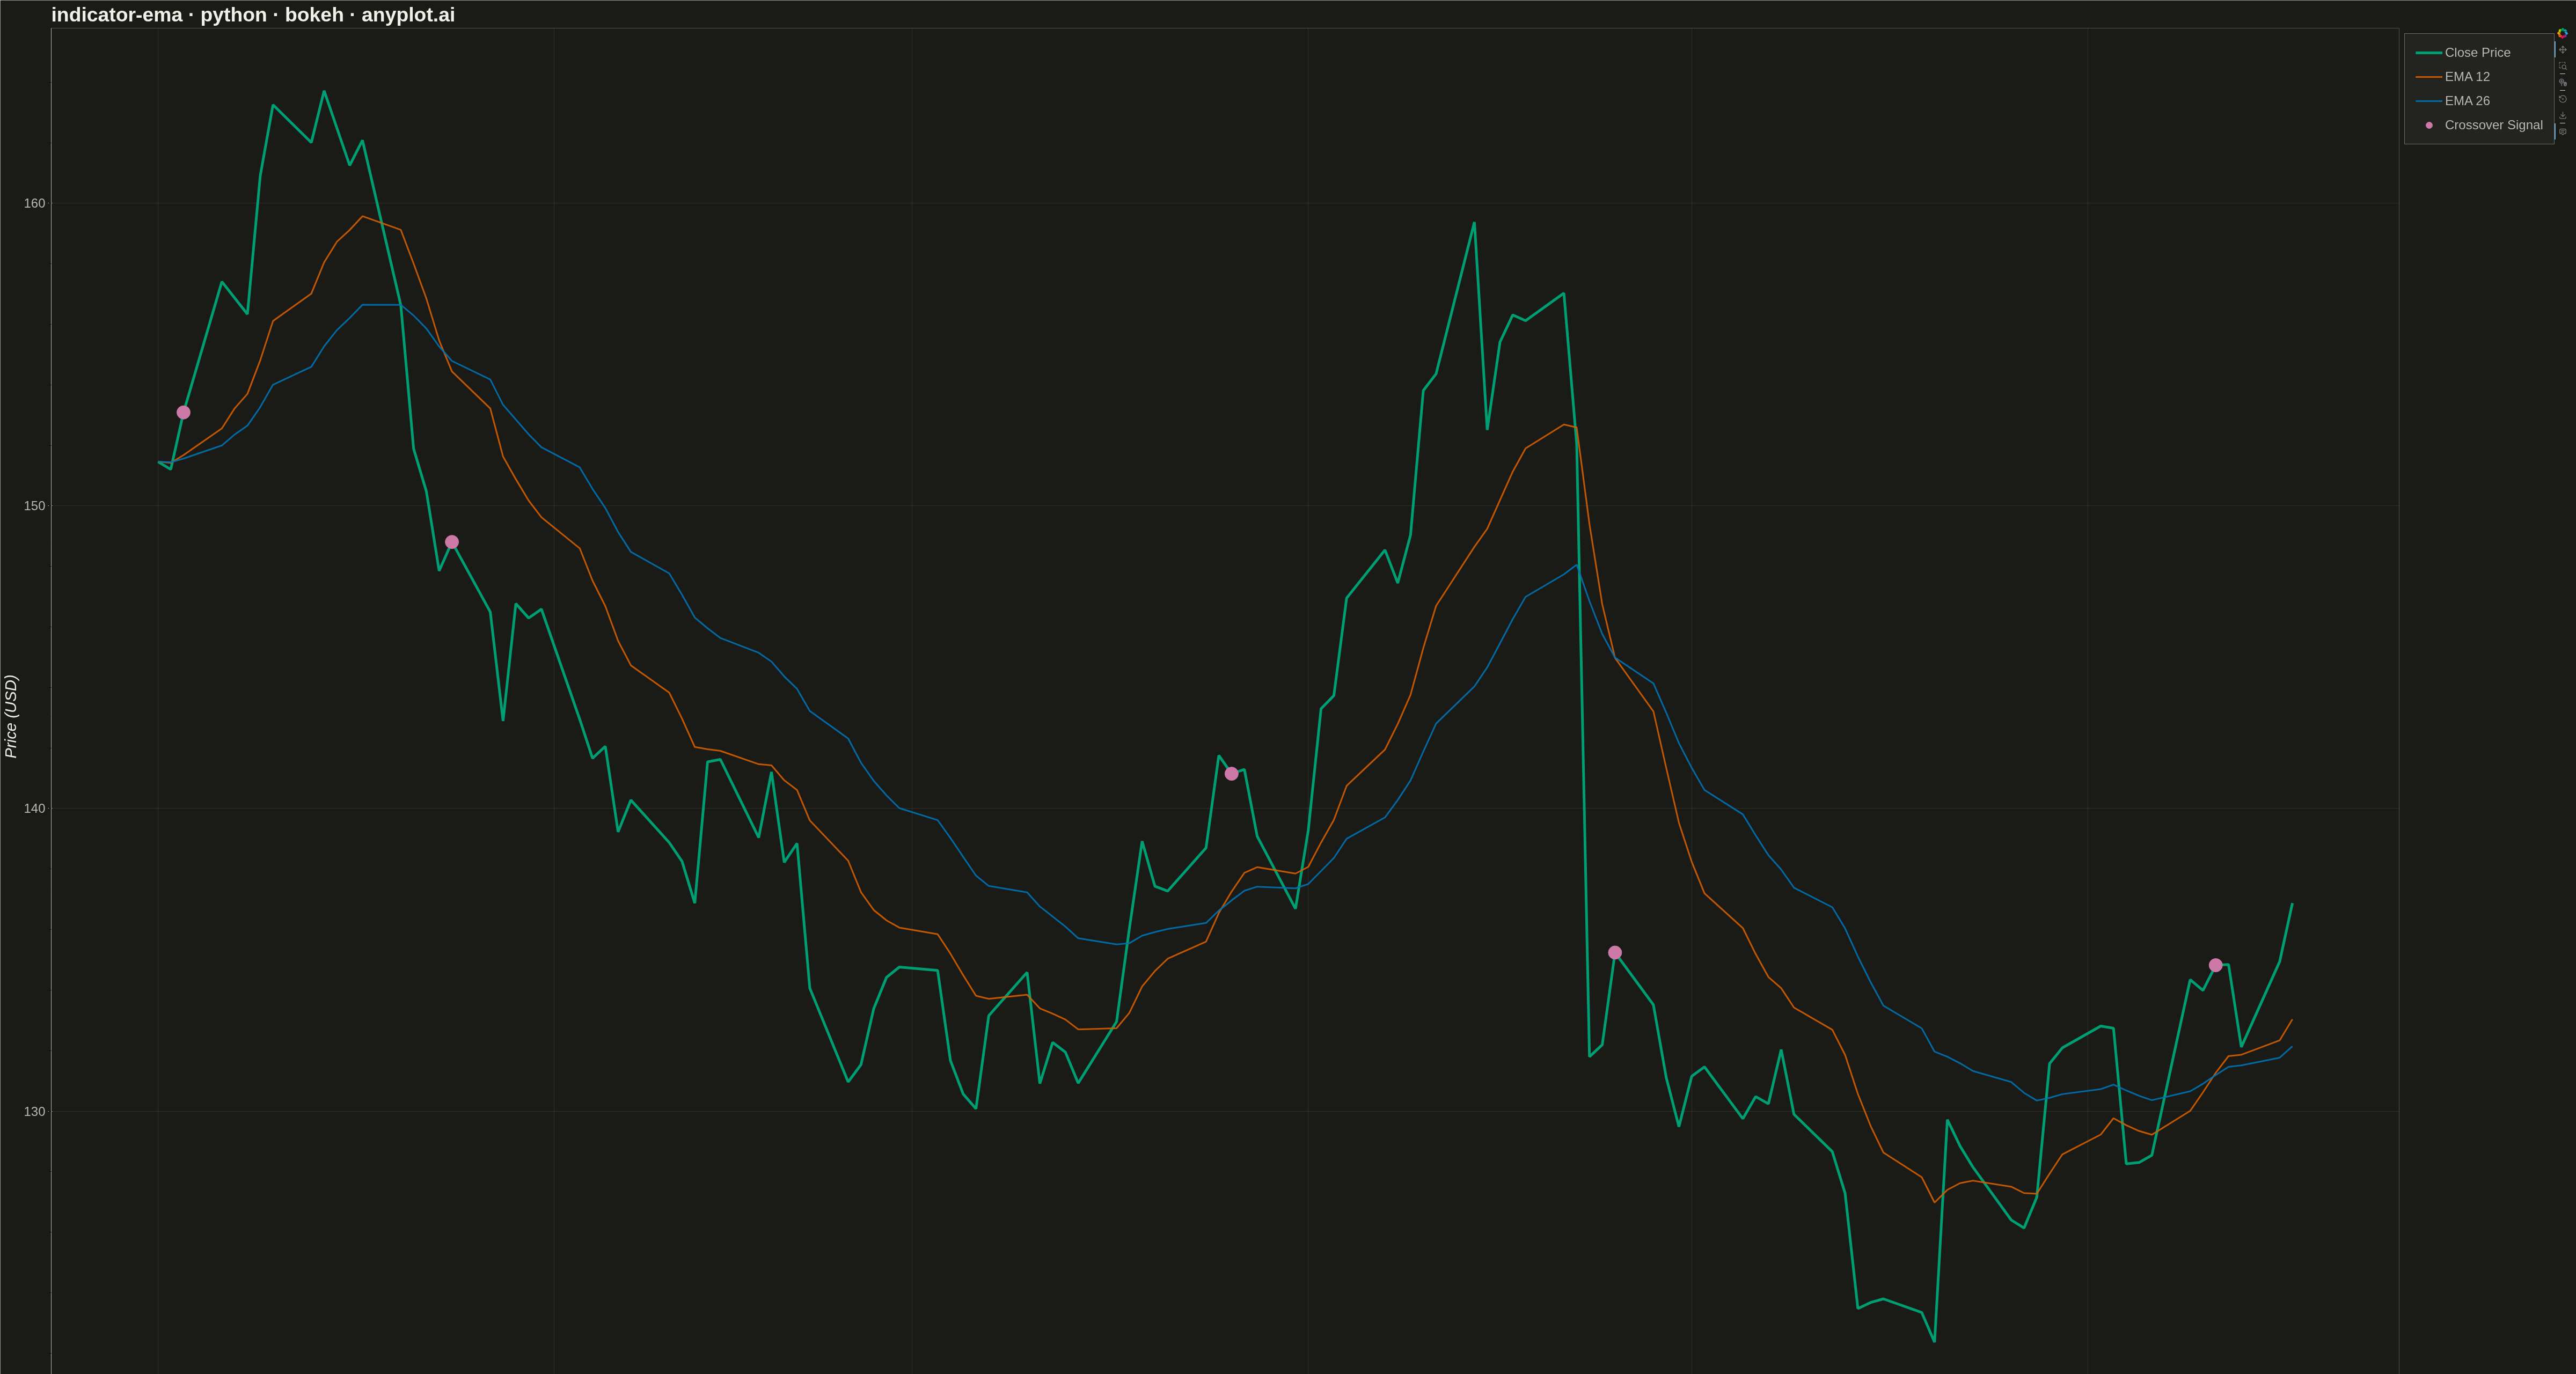
An Exponential Moving Average (EMA) overlay chart displays price data with one or more EMA lines that give greater weight to recent prices, making them more responsive to new information than simple moving averages. The EMA calculation applies an exponential weighting factor that decreases with each older data point, allowing traders to identify trends faster. This technical indicator is fundamental in trading for spotting trend direction, dynamic support/resistance levels, and crossover signals.
""" anyplot.ai
indicator-ema: Exponential Moving Average (EMA) Indicator Chart
Library: bokeh 3.9.0 | Python 3.13.13
Quality: 74/100 | Updated: 2026-05-19
"""

import numpy as np
import pandas as pd
from bokeh.io import export_png
from bokeh.models import ColumnDataSource, Legend
from bokeh.plotting import figure, output_file, save


# Data - Generate synthetic stock price data
np.random.seed(42)
n_days = 120

# Generate realistic price movement using random walk with drift
dates = pd.date_range("2025-01-01", periods=n_days, freq="B")  # Business days
returns = np.random.normal(0.0008, 0.018, n_days)  # Daily returns
price = 150 * np.cumprod(1 + returns)

# Add some trend changes for visual interest
price[40:80] = price[40:80] * np.linspace(1, 1.15, 40)  # Uptrend
price[80:100] = price[80:100] * np.linspace(1, 0.92, 20)  # Downtrend

# Create DataFrame
df = pd.DataFrame({"date": dates, "close": price})

# Calculate EMAs using pandas ewm
df["ema_12"] = df["close"].ewm(span=12, adjust=False).mean()
df["ema_26"] = df["close"].ewm(span=26, adjust=False).mean()

# Create ColumnDataSource
source = ColumnDataSource(df)

# Create figure with datetime axis
p = figure(
    width=4800,
    height=2700,
    title="indicator-ema \u00b7 bokeh \u00b7 pyplots.ai",
    x_axis_label="Date",
    y_axis_label="Price (USD)",
    x_axis_type="datetime",
    tools="pan,wheel_zoom,box_zoom,reset,save",
)

# Plot price line (prominent)
price_line = p.line("date", "close", source=source, line_width=5, line_color="#306998", alpha=1.0)

# Plot EMA 12 (short-term, thinner)
ema_12_line = p.line("date", "ema_12", source=source, line_width=3, line_color="#FFD43B", alpha=0.9)

# Plot EMA 26 (longer-term, thinner)
ema_26_line = p.line("date", "ema_26", source=source, line_width=3, line_color="#E74C3C", alpha=0.9)

# Find and mark crossover points
crossover_indices = []
for i in range(1, len(df)):
    ema12_prev = df["ema_12"].iloc[i - 1]
    ema26_prev = df["ema_26"].iloc[i - 1]
    ema12_curr = df["ema_12"].iloc[i]
    ema26_curr = df["ema_26"].iloc[i]

    # Detect crossover (EMA12 crosses EMA26)
    if (ema12_prev < ema26_prev and ema12_curr >= ema26_curr) or (ema12_prev > ema26_prev and ema12_curr <= ema26_curr):
        crossover_indices.append(i)

# Mark crossovers with circles
crossover_scatter = None
if crossover_indices:
    crossover_source = ColumnDataSource(
        data={
            "date": [df["date"].iloc[i] for i in crossover_indices],
            "price": [df["close"].iloc[i] for i in crossover_indices],
        }
    )
    crossover_scatter = p.scatter("date", "price", source=crossover_source, size=25, color="#9B59B6", marker="circle")

# Create legend manually for better control
legend_items = [("Close Price", [price_line]), ("EMA 12", [ema_12_line]), ("EMA 26", [ema_26_line])]
if crossover_scatter:
    legend_items.append(("Crossover Signal", [crossover_scatter]))

legend = Legend(items=legend_items, location="top_left")
p.add_layout(legend, "right")

# Style the plot
p.title.text_font_size = "36pt"
p.title.text_font_style = "bold"
p.xaxis.axis_label_text_font_size = "26pt"
p.yaxis.axis_label_text_font_size = "26pt"
p.xaxis.major_label_text_font_size = "20pt"
p.yaxis.major_label_text_font_size = "20pt"

# Legend styling
p.legend.label_text_font_size = "22pt"
p.legend.glyph_width = 50
p.legend.glyph_height = 30
p.legend.spacing = 15
p.legend.padding = 20
p.legend.background_fill_alpha = 0.9

# Grid styling
p.grid.grid_line_alpha = 0.3
p.grid.grid_line_dash = [6, 4]

# Background
p.background_fill_color = "#fafafa"
p.border_fill_color = "#ffffff"

# Axis styling
p.xaxis.axis_line_width = 2
p.yaxis.axis_line_width = 2
p.xaxis.major_tick_line_width = 2
p.yaxis.major_tick_line_width = 2

# Save PNG
export_png(p, filename="plot.png")

# Save interactive HTML
output_file("plot.html", title="EMA Indicator - bokeh - pyplots.ai")
save(p)
Runnable source as JSON, for any HTTP client: https://api.anyplot.ai/specs/indicator-ema/bokeh/code. Any spec id and library id listed in llms-full.txt fit the same URL shape; every URL below is complete and callable.
{
  "spec_id": "indicator-ema",
  "language": "python",
  "library": "bokeh",
  "page": "https://anyplot.ai/indicator-ema/python/bokeh",
  "hub": "https://anyplot.ai/indicator-ema",
  "code_json": "https://api.anyplot.ai/specs/indicator-ema/bokeh/code",
  "spec_json": "https://api.anyplot.ai/specs/indicator-ema",
  "render_light_png": "https://storage.googleapis.com/anyplot-images/plots/indicator-ema/python/bokeh/plot-light.png",
  "render_dark_png": "https://storage.googleapis.com/anyplot-images/plots/indicator-ema/python/bokeh/plot-dark.png",
  "interactive_light_html": "https://storage.googleapis.com/anyplot-images/plots/indicator-ema/python/bokeh/plot-light.html",
  "interactive_dark_html": "https://storage.googleapis.com/anyplot-images/plots/indicator-ema/python/bokeh/plot-dark.html",
  "quality_score": 74.0,
  "license": "MIT",
  "guide": "https://anyplot.ai/llms.txt"
}
Part of Exponential Moving Average (EMA) Indicator Chart on anyplot.ai.