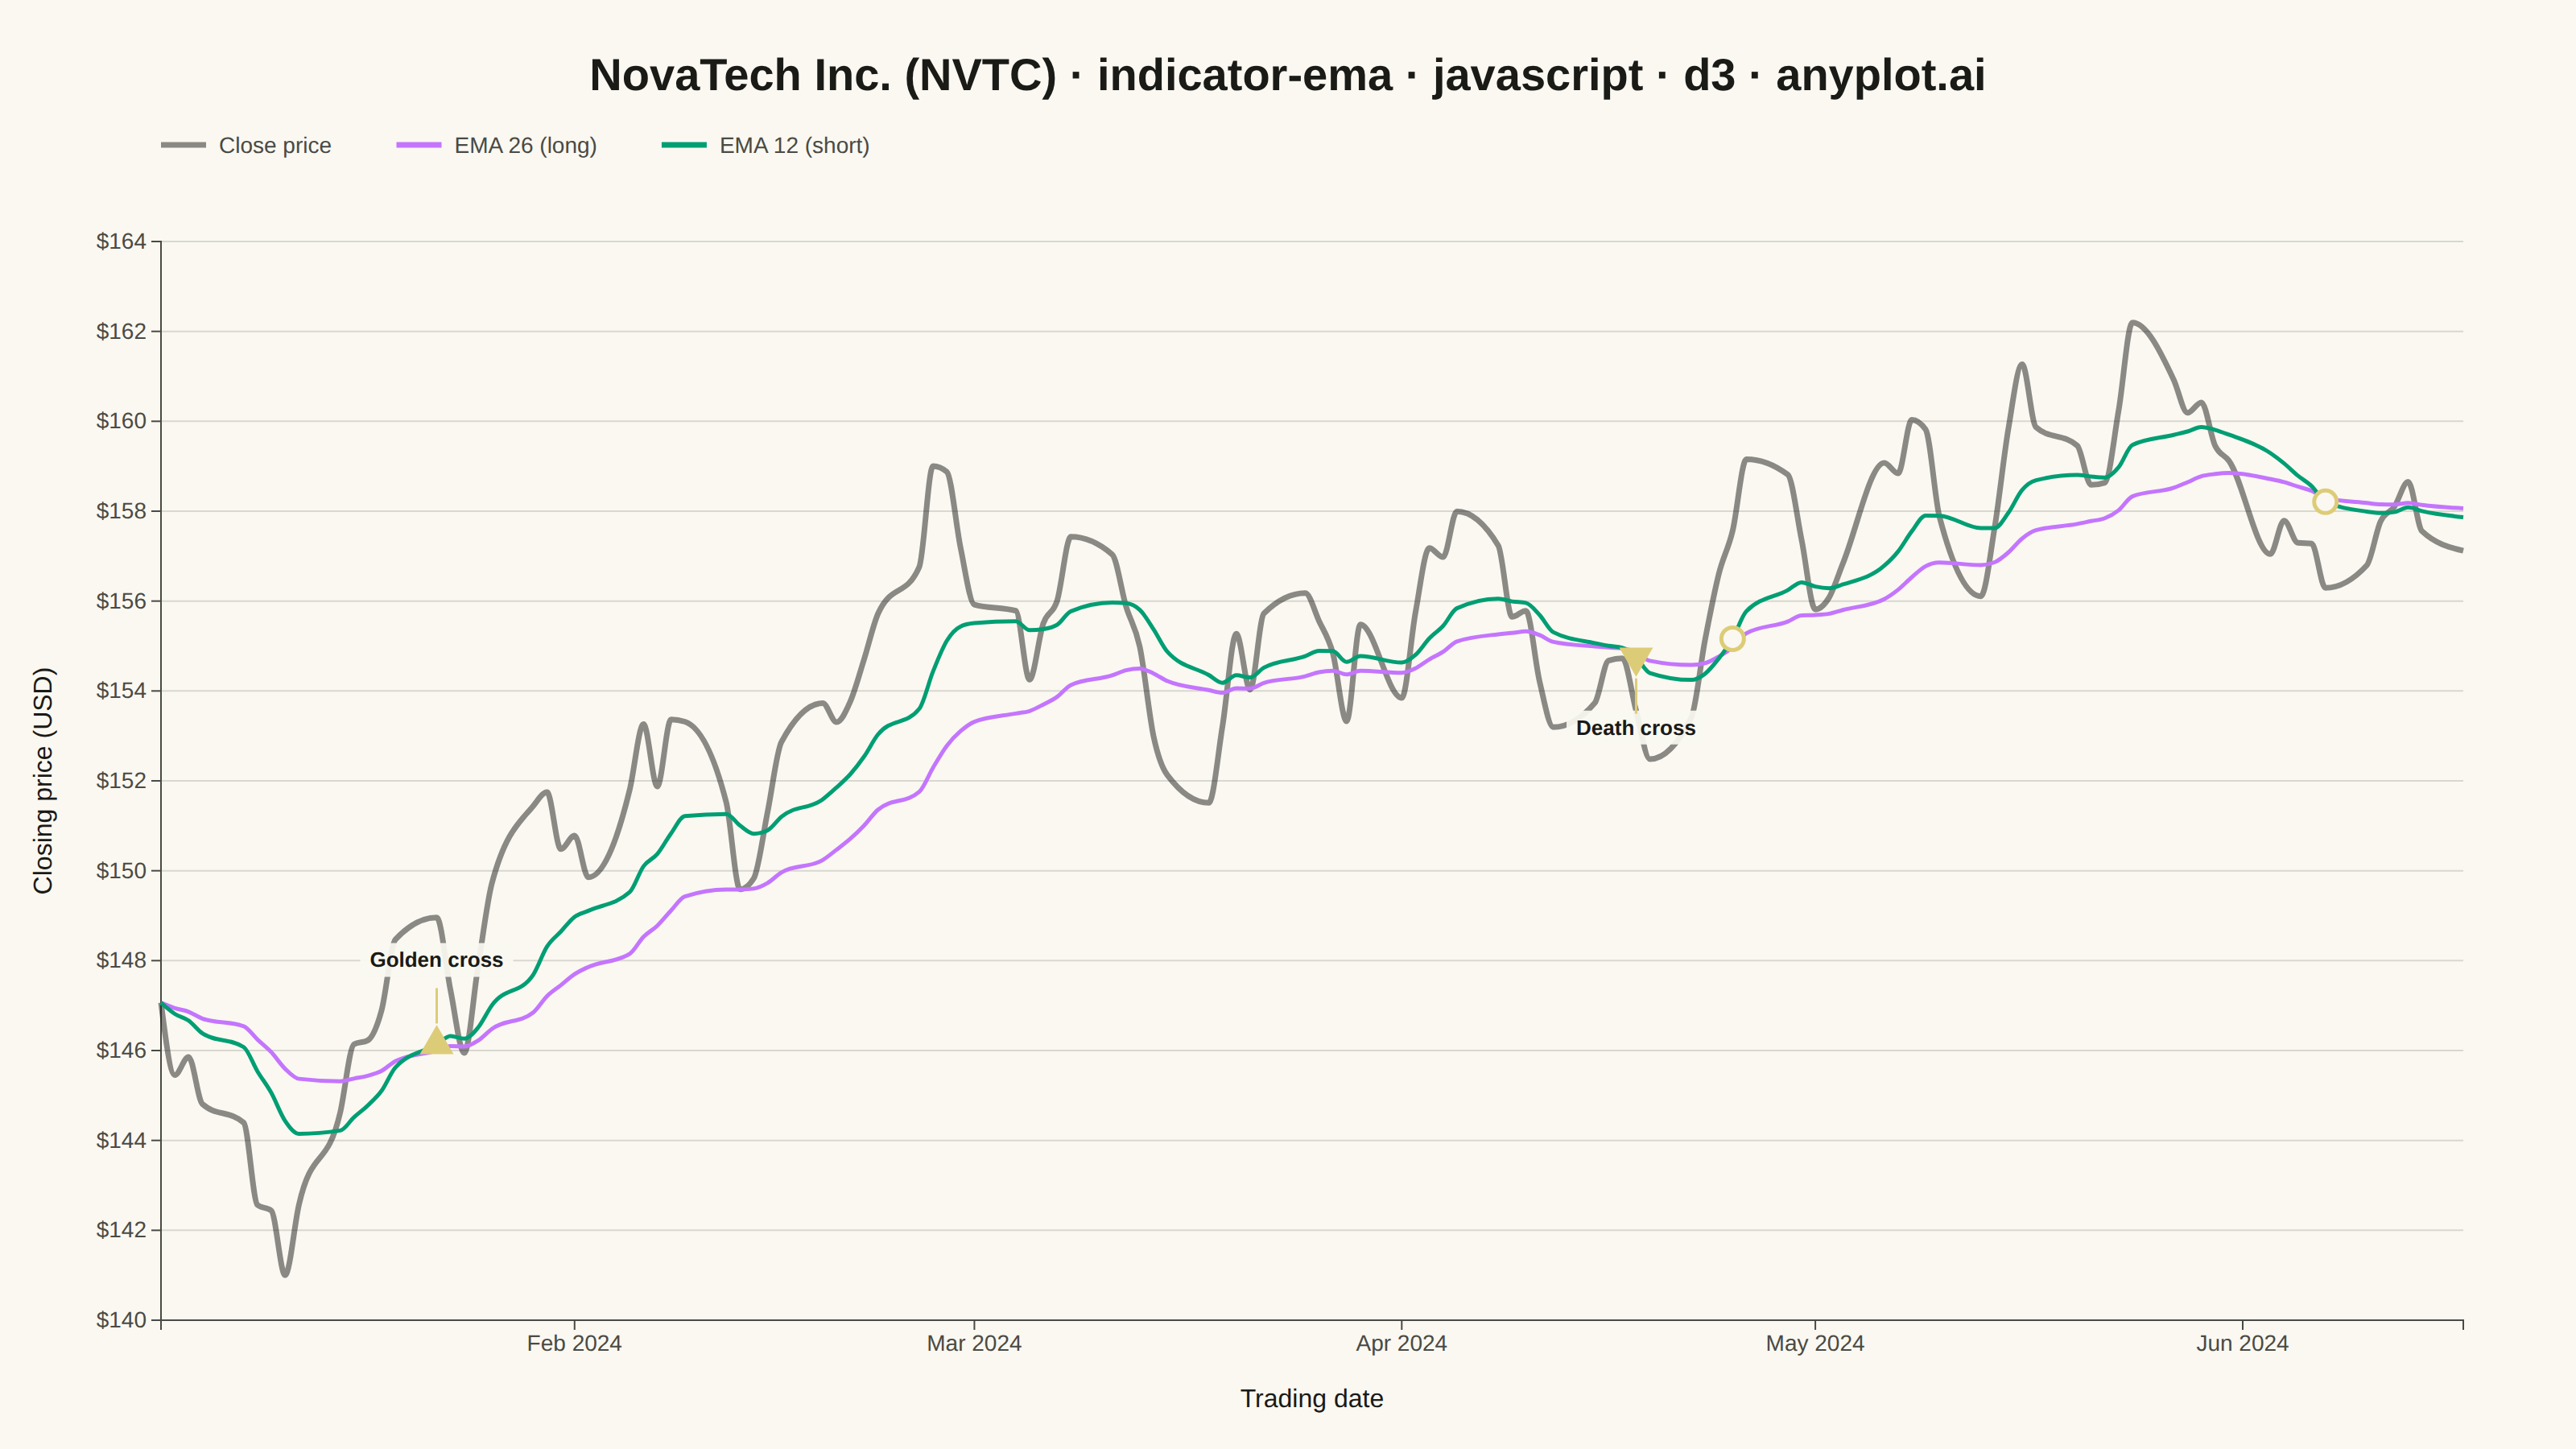
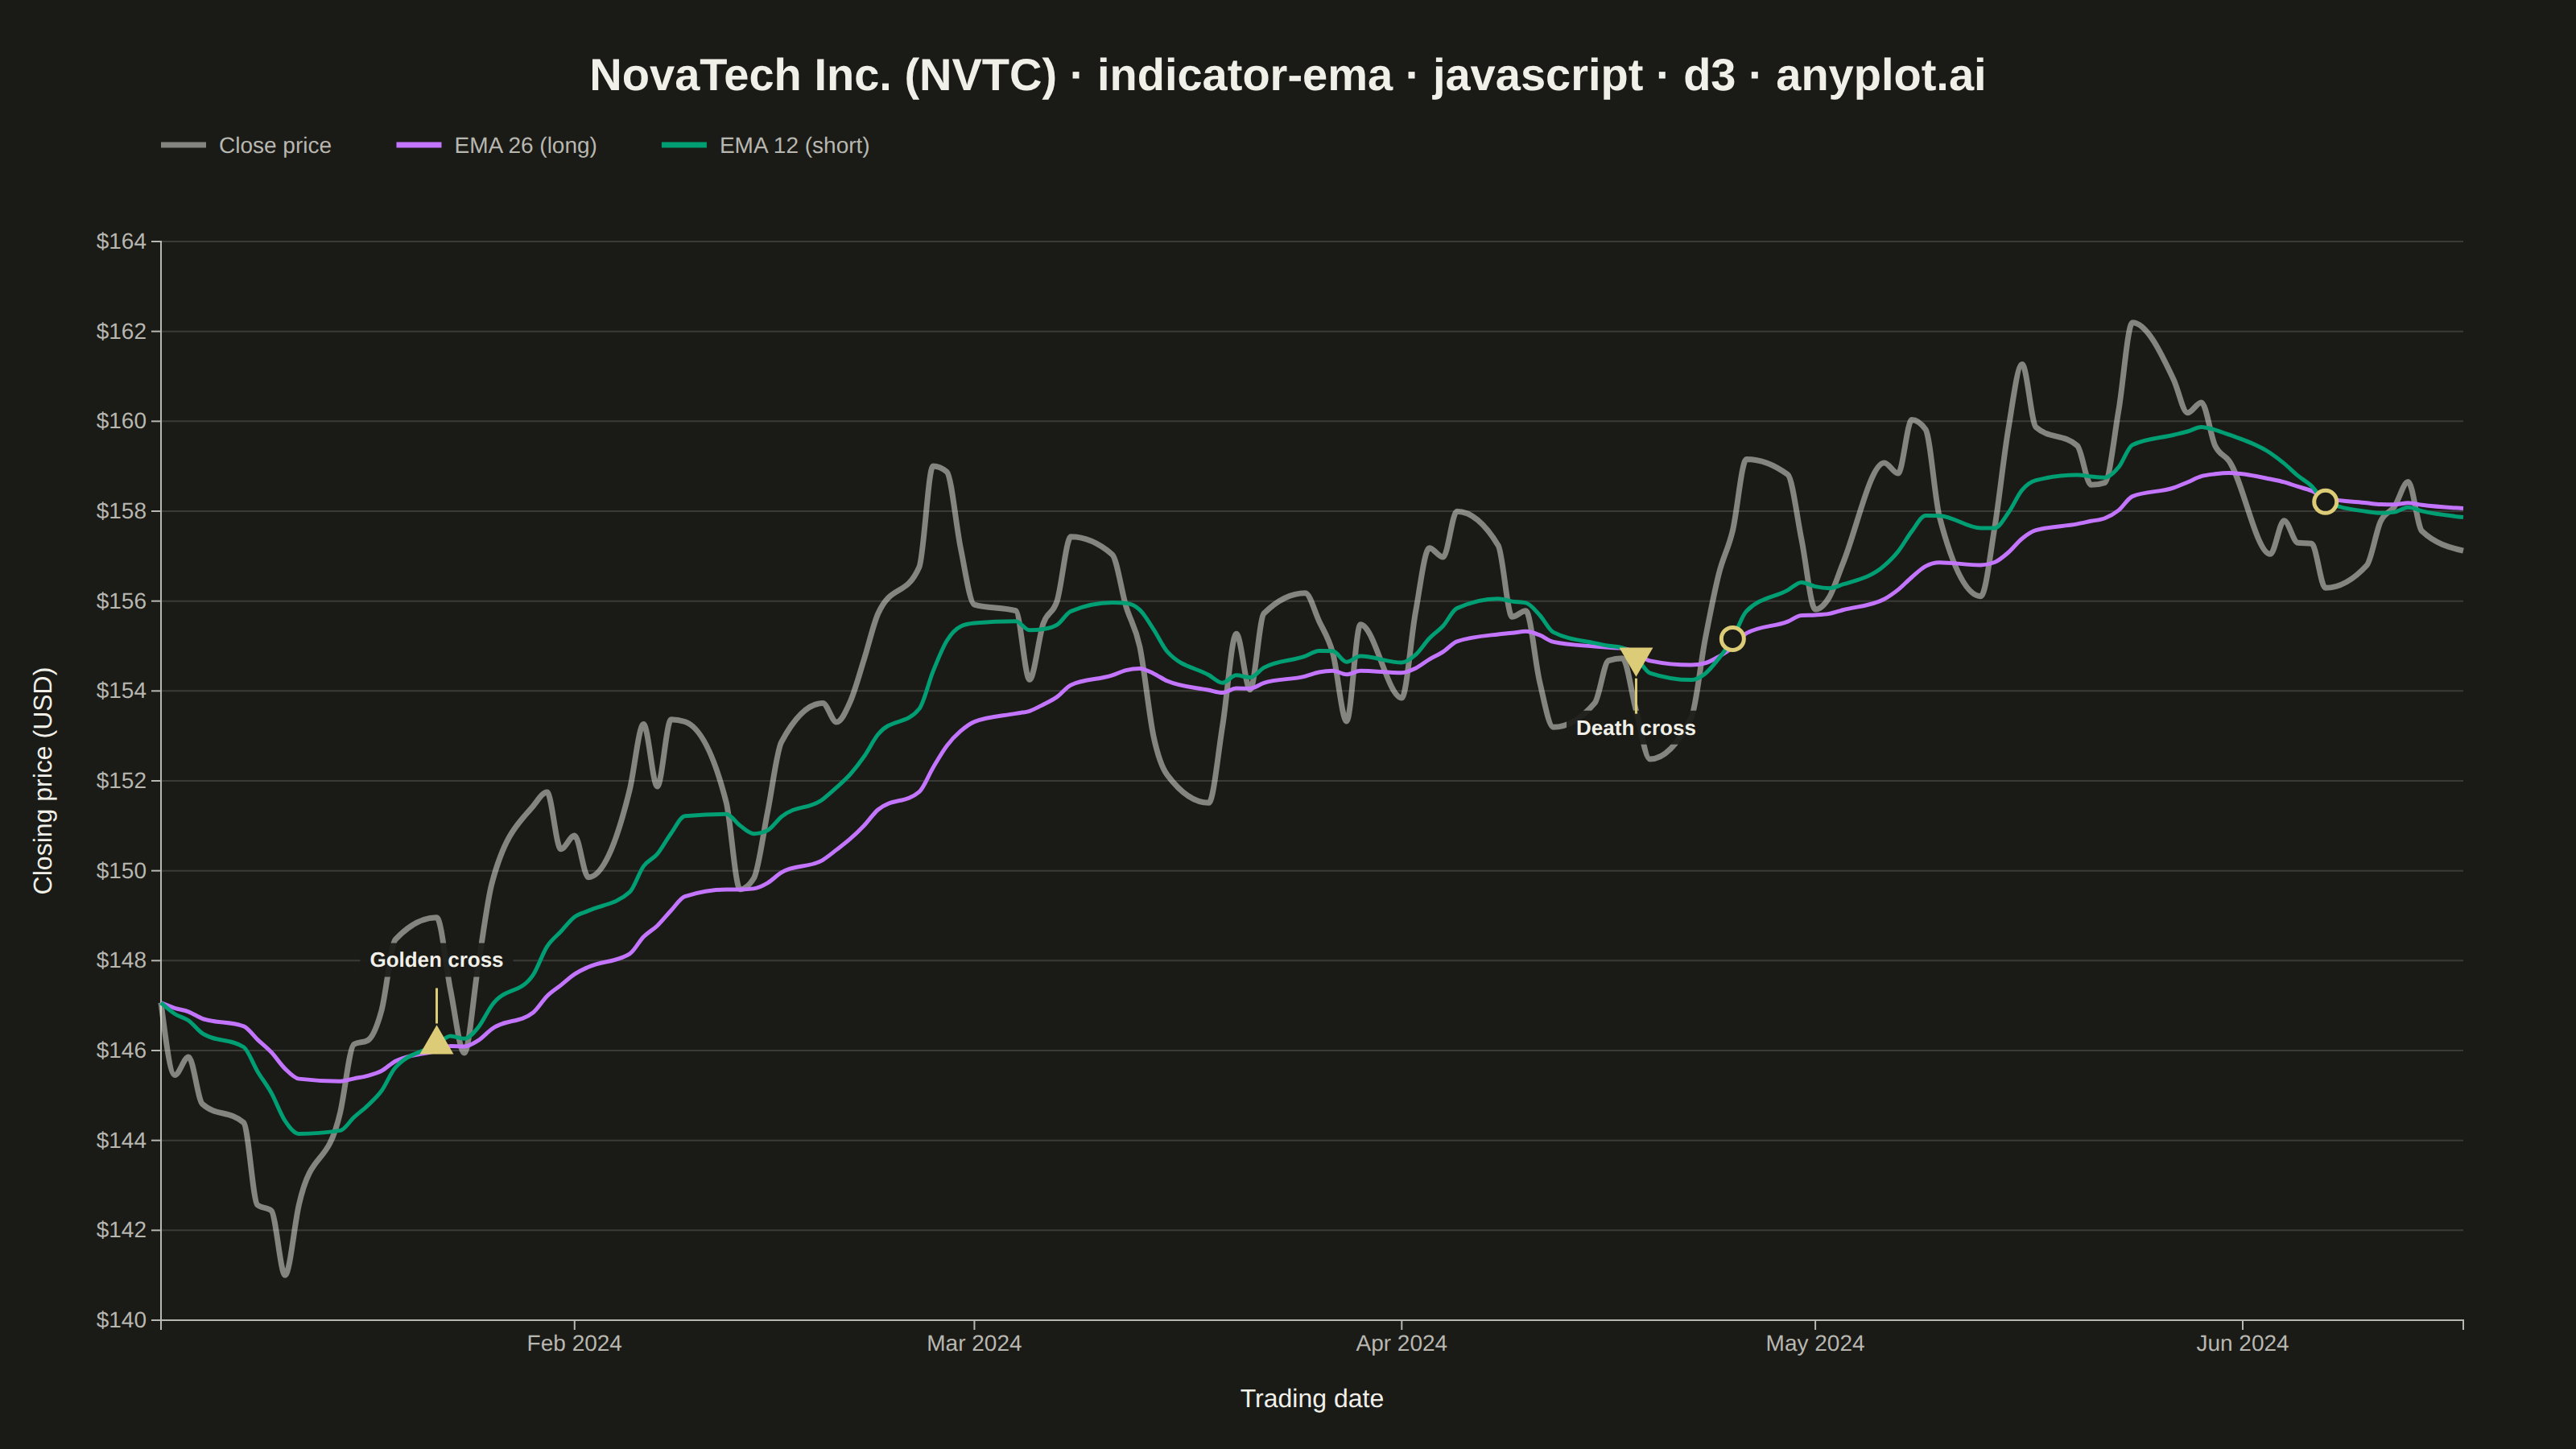
The same plot in 14 other libraries — JavaScript: Chart.js, Apache ECharts, Highcharts, MUI X Charts; Python: Altair, Bokeh, lets-plot, Matplotlib, Plotly, plotnine, Pygal, Seaborn; R: ggplot2; Julia: Makie.jl. Compare all 15 side by side: Exponential Moving Average (EMA) Indicator Chart in Python, R, Julia and JavaScript.
An Exponential Moving Average (EMA) overlay chart displays price data with one or more EMA lines that give greater weight to recent prices, making them more responsive to new information than simple moving averages. The EMA calculation applies an exponential weighting factor that decreases with each older data point, allowing traders to identify trends faster. This technical indicator is fundamental in trading for spotting trend direction, dynamic support/resistance levels, and crossover signals.
// anyplot.ai
// indicator-ema: Exponential Moving Average (EMA) Indicator Chart
// Library: d3 7.9.0 | JavaScript 22.23.2
// Quality: 92/100 | Created: 2026-09-02

const t = window.ANYPLOT_TOKENS;
const { width, height } = window.ANYPLOT_SIZE;
const margin = { top: 150, right: 70, bottom: 80, left: 100 };
const iw = width - margin.left - margin.right;
const ih = height - margin.top - margin.bottom;

// --- Data (in-memory, deterministic LCG) ------------------------------------
function lcg(seed) {
  let state = seed;
  return () => {
    state = (state * 1664525 + 1013904223) % 4294967296;
    return state / 4294967296;
  };
}
const rand = lcg(42);

const NUM_DAYS = 120;
const dates = [];
const cursor = new Date(2024, 0, 2);
while (dates.length < NUM_DAYS) {
  const weekday = cursor.getDay();
  if (weekday !== 0 && weekday !== 6) dates.push(new Date(cursor));
  cursor.setDate(cursor.getDate() + 1);
}

const closes = [];
let price = 148;
for (let i = 0; i < NUM_DAYS; i++) {
  const drift = 0.0006;
  const shock = (rand() - 0.5) * 0.028;
  price *= 1 + drift + shock;
  closes.push(price);
}

function ema(values, period) {
  const k = 2 / (period + 1);
  const out = [values[0]];
  for (let i = 1; i < values.length; i++) {
    out.push(values[i] * k + out[i - 1] * (1 - k));
  }
  return out;
}

const emaShortValues = ema(closes, 12);
const emaLongValues = ema(closes, 26);

const data = dates.map((date, i) => ({
  date,
  close: closes[i],
  emaShort: emaShortValues[i],
  emaLong: emaLongValues[i],
}));

// Crossover points: sign change of (emaShort - emaLong)
const crossovers = [];
for (let i = 1; i < data.length; i++) {
  const prevDiff = data[i - 1].emaShort - data[i - 1].emaLong;
  const currDiff = data[i].emaShort - data[i].emaLong;
  if (prevDiff !== 0 && Math.sign(prevDiff) !== Math.sign(currDiff)) {
    crossovers.push(data[i]);
  }
}

// --- SVG mount ---------------------------------------------------------------
const svg = d3.select("#container").append("svg").attr("width", width).attr("height", height);
const g = svg.append("g").attr("transform", `translate(${margin.left},${margin.top})`);

// --- Scales --------------------------------------------------------------------
const x = d3.scaleTime().domain(d3.extent(data, (d) => d.date)).range([0, iw]);
const yMin = d3.min(data, (d) => Math.min(d.close, d.emaShort, d.emaLong));
const yMax = d3.max(data, (d) => Math.max(d.close, d.emaShort, d.emaLong));
const y = d3.scaleLinear().domain([yMin, yMax]).nice().range([ih, 0]);

// --- Gridlines (y-axis only) -----------------------------------------------
g.append("g")
  .call(d3.axisLeft(y).tickSize(-iw).tickFormat(""))
  .call((sel) => sel.select(".domain").remove())
  .selectAll("line")
  .attr("stroke", t.grid);

// --- Axes ------------------------------------------------------------------
const xAxis = g
  .append("g")
  .attr("transform", `translate(0,${ih})`)
  .call(d3.axisBottom(x).ticks(d3.timeMonth.every(1)).tickFormat(d3.timeFormat("%b %Y")));
const yAxis = g.append("g").call(d3.axisLeft(y).tickFormat((d) => `$${d.toFixed(0)}`));

for (const axis of [xAxis, yAxis]) {
  axis.selectAll("text").attr("fill", t.inkSoft).style("font-size", "14px");
  axis.selectAll("line").attr("stroke", t.inkSoft);
  axis.select(".domain").attr("stroke", t.inkSoft);
}

// --- Lines: price (neutral reference) + two EMA overlays --------------------
const lineClose = d3.line().x((d) => x(d.date)).y((d) => y(d.close)).curve(d3.curveMonotoneX);
const lineEmaLong = d3.line().x((d) => x(d.date)).y((d) => y(d.emaLong)).curve(d3.curveMonotoneX);
const lineEmaShort = d3.line().x((d) => x(d.date)).y((d) => y(d.emaShort)).curve(d3.curveMonotoneX);

g.append("path")
  .datum(data)
  .attr("fill", "none")
  .attr("stroke", t.ink)
  .attr("stroke-opacity", 0.5)
  .attr("stroke-width", 3.5)
  .attr("d", lineClose);

g.append("path")
  .datum(data)
  .attr("fill", "none")
  .attr("stroke", t.palette[1])
  .attr("stroke-width", 2.5)
  .attr("d", lineEmaLong);

g.append("path")
  .datum(data)
  .attr("fill", "none")
  .attr("stroke", t.palette[0])
  .attr("stroke-width", 2.5)
  .attr("d", lineEmaShort);

// --- Crossover markers (short EMA crossing long EMA) -------------------------
// The first golden cross (bullish) and first death cross (bearish) get a
// distinctive triangle glyph + leader-line callout naming the signal; the
// rest stay plain rings so the chart doesn't get cluttered.
const labeledCrossovers = [];
for (const c of crossovers) {
  const type = c.emaShort > c.emaLong ? "Golden cross" : "Death cross";
  if (!labeledCrossovers.some((l) => l.type === type)) {
    labeledCrossovers.push({ ...c, type });
  }
  if (labeledCrossovers.length === 2) break;
}
const labeledDates = new Set(labeledCrossovers.map((d) => +d.date));

g.selectAll(".crossover")
  .data(crossovers.filter((d) => !labeledDates.has(+d.date)))
  .join("circle")
  .attr("class", "crossover")
  .attr("cx", (d) => x(d.date))
  .attr("cy", (d) => y(d.emaShort))
  .attr("r", 7)
  .attr("fill", t.pageBg)
  .attr("stroke", t.amber)
  .attr("stroke-width", 2.5);

const triangle = d3.symbol().type(d3.symbolTriangle).size(190)();
const callouts = g.append("g").attr("class", "crossover-callouts");
for (const c of labeledCrossovers) {
  const cx = x(c.date);
  const cy = y(c.emaShort);
  const isGolden = c.type === "Golden cross";
  const labelBelow = cy < ih * 0.4;
  const labelY = cy + (labelBelow ? 44 : -44);

  callouts
    .append("path")
    .attr("d", triangle)
    .attr("transform", `translate(${cx},${cy}) rotate(${isGolden ? 0 : 180})`)
    .attr("fill", t.amber);

  callouts
    .append("line")
    .attr("x1", cx)
    .attr("y1", cy + (labelBelow ? 13 : -13))
    .attr("x2", cx)
    .attr("y2", labelY + (labelBelow ? -9 : 9))
    .attr("stroke", t.amber)
    .attr("stroke-width", 1.5);

  // Halo behind the label so it stays legible where the close-price line
  // crosses underneath it.
  const calloutLabel = callouts
    .append("text")
    .attr("x", cx)
    .attr("y", labelY + (labelBelow ? 4 : -4))
    .attr("text-anchor", "middle")
    .attr("fill", t.ink)
    .style("font-size", "13px")
    .style("font-weight", "600")
    .text(c.type);
  const labelBox = calloutLabel.node().getBBox();
  callouts
    .append("rect")
    .attr("x", labelBox.x - 6)
    .attr("y", labelBox.y - 3)
    .attr("width", labelBox.width + 12)
    .attr("height", labelBox.height + 6)
    .attr("rx", 4)
    .attr("fill", t.pageBg)
    .attr("fill-opacity", 0.92)
    .lower();
}

// --- Axis labels -------------------------------------------------------------
g.append("text")
  .attr("x", iw / 2)
  .attr("y", ih + 54)
  .attr("text-anchor", "middle")
  .attr("fill", t.ink)
  .style("font-size", "16px")
  .text("Trading date");

g.append("text")
  .attr("transform", "rotate(-90)")
  .attr("x", -ih / 2)
  .attr("y", -68)
  .attr("text-anchor", "middle")
  .attr("fill", t.ink)
  .style("font-size", "16px")
  .text("Closing price (USD)");

// --- Legend ------------------------------------------------------------------
const legendItems = [
  { label: "Close price", color: t.ink, opacity: 0.5 },
  { label: "EMA 26 (long)", color: t.palette[1], opacity: 1 },
  { label: "EMA 12 (short)", color: t.palette[0], opacity: 1 },
];

const legend = svg.append("g").attr("transform", `translate(${margin.left},${margin.top - 60})`);
let legendX = 0;
const legendGap = 40;
for (const item of legendItems) {
  const row = legend.append("g").attr("transform", `translate(${legendX},0)`);
  row
    .append("line")
    .attr("x1", 0)
    .attr("x2", 28)
    .attr("y1", 0)
    .attr("y2", 0)
    .attr("stroke", item.color)
    .attr("stroke-opacity", item.opacity)
    .attr("stroke-width", 3.5);
  const label = row
    .append("text")
    .attr("x", 36)
    .attr("y", 5)
    .attr("fill", t.inkSoft)
    .style("font-size", "14px")
    .text(item.label);
  const labelWidth = label.node().getBBox().width;
  legendX += 36 + labelWidth + legendGap;
}

// --- Title (fontsize scales linearly off the 67-char baseline) ---------------
const title = "NovaTech Inc. (NVTC) · indicator-ema · javascript · d3 · anyplot.ai";
const baselineChars = 67;
const defaultTitleSize = 28;
const titleFloor = 15;
const ratio = title.length > baselineChars ? baselineChars / title.length : 1;
const titleSize = Math.max(titleFloor, Math.round(defaultTitleSize * ratio));

svg
  .append("text")
  .attr("x", width / 2)
  .attr("y", 56)
  .attr("text-anchor", "middle")
  .attr("fill", t.ink)
  .style("font-size", `${titleSize}px`)
  .style("font-weight", "600")
  .text(title);
Runnable source as JSON, for any HTTP client: https://api.anyplot.ai/specs/indicator-ema/d3/code. Any spec id and library id listed in llms-full.txt fit the same URL shape; every URL below is complete and callable.
{
  "spec_id": "indicator-ema",
  "language": "javascript",
  "library": "d3",
  "page": "https://anyplot.ai/indicator-ema/javascript/d3",
  "hub": "https://anyplot.ai/indicator-ema",
  "code_json": "https://api.anyplot.ai/specs/indicator-ema/d3/code",
  "spec_json": "https://api.anyplot.ai/specs/indicator-ema",
  "render_light_png": "https://storage.googleapis.com/anyplot-images/plots/indicator-ema/javascript/d3/plot-light.png",
  "render_dark_png": "https://storage.googleapis.com/anyplot-images/plots/indicator-ema/javascript/d3/plot-dark.png",
  "interactive_light_html": "https://storage.googleapis.com/anyplot-images/plots/indicator-ema/javascript/d3/plot-light.html",
  "interactive_dark_html": "https://storage.googleapis.com/anyplot-images/plots/indicator-ema/javascript/d3/plot-dark.html",
  "quality_score": 92.0,
  "license": "MIT",
  "guide": "https://anyplot.ai/llms.txt"
}
Part of Exponential Moving Average (EMA) Indicator Chart on anyplot.ai.