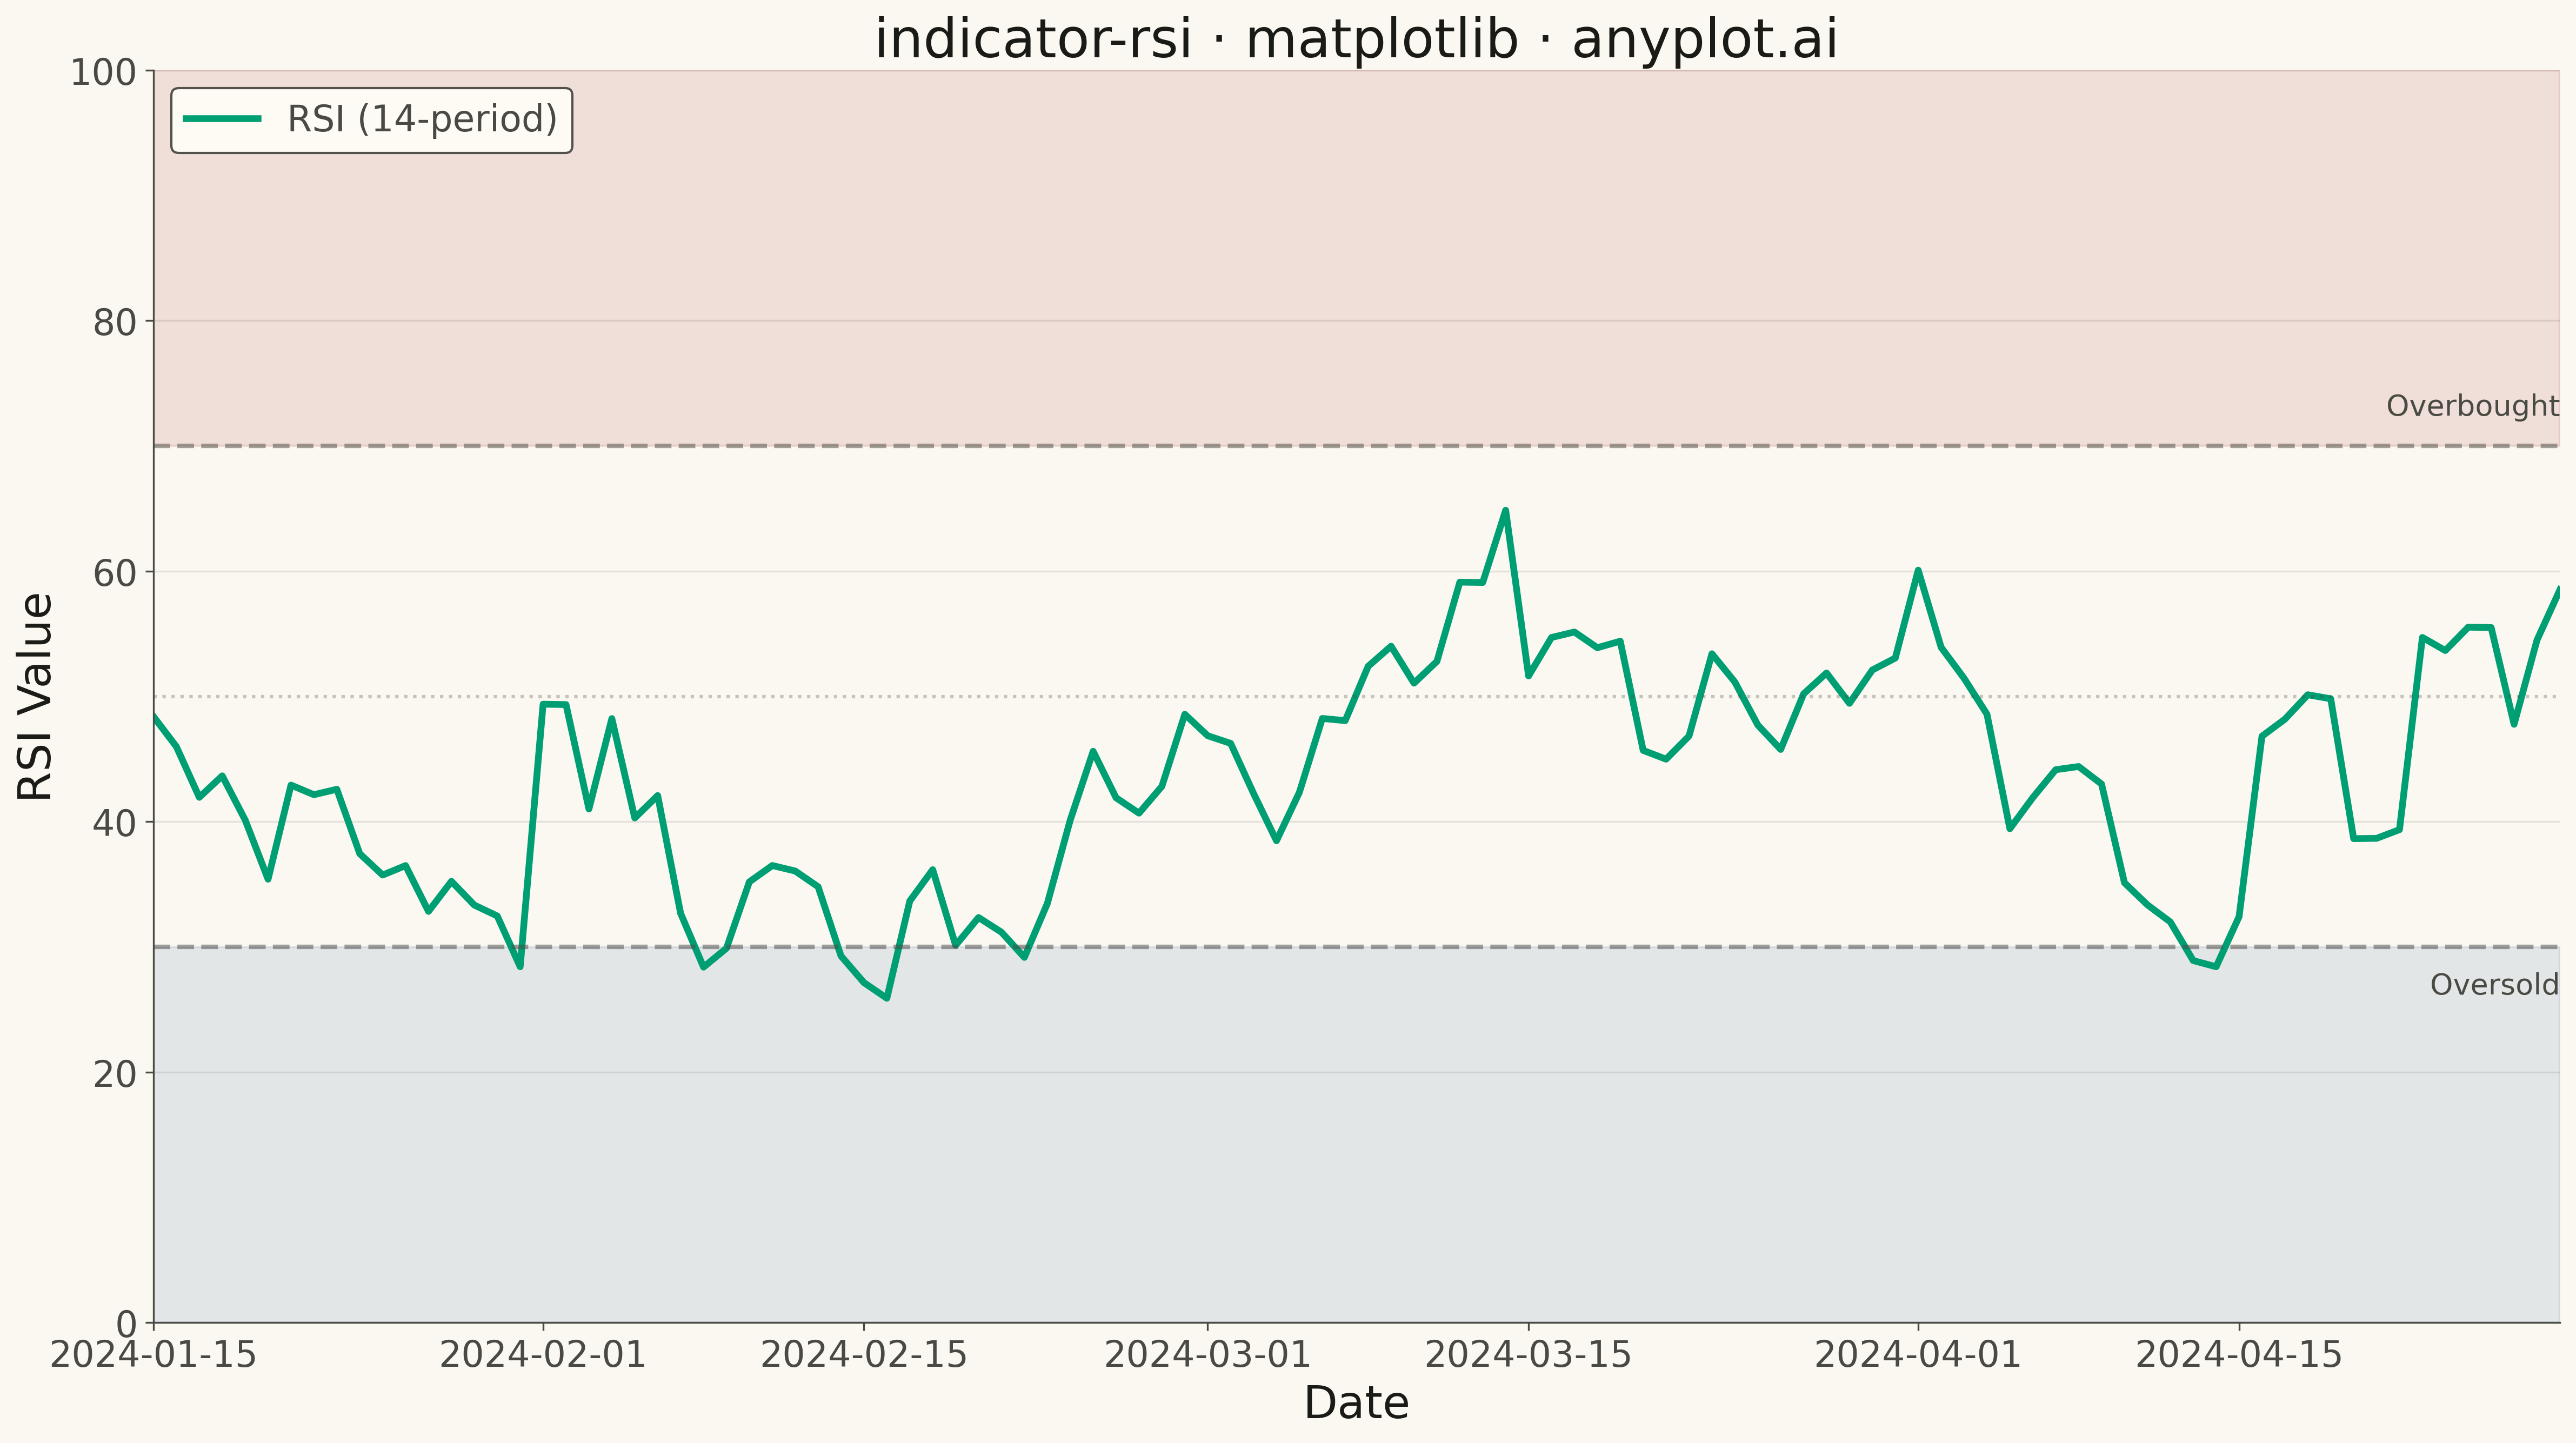
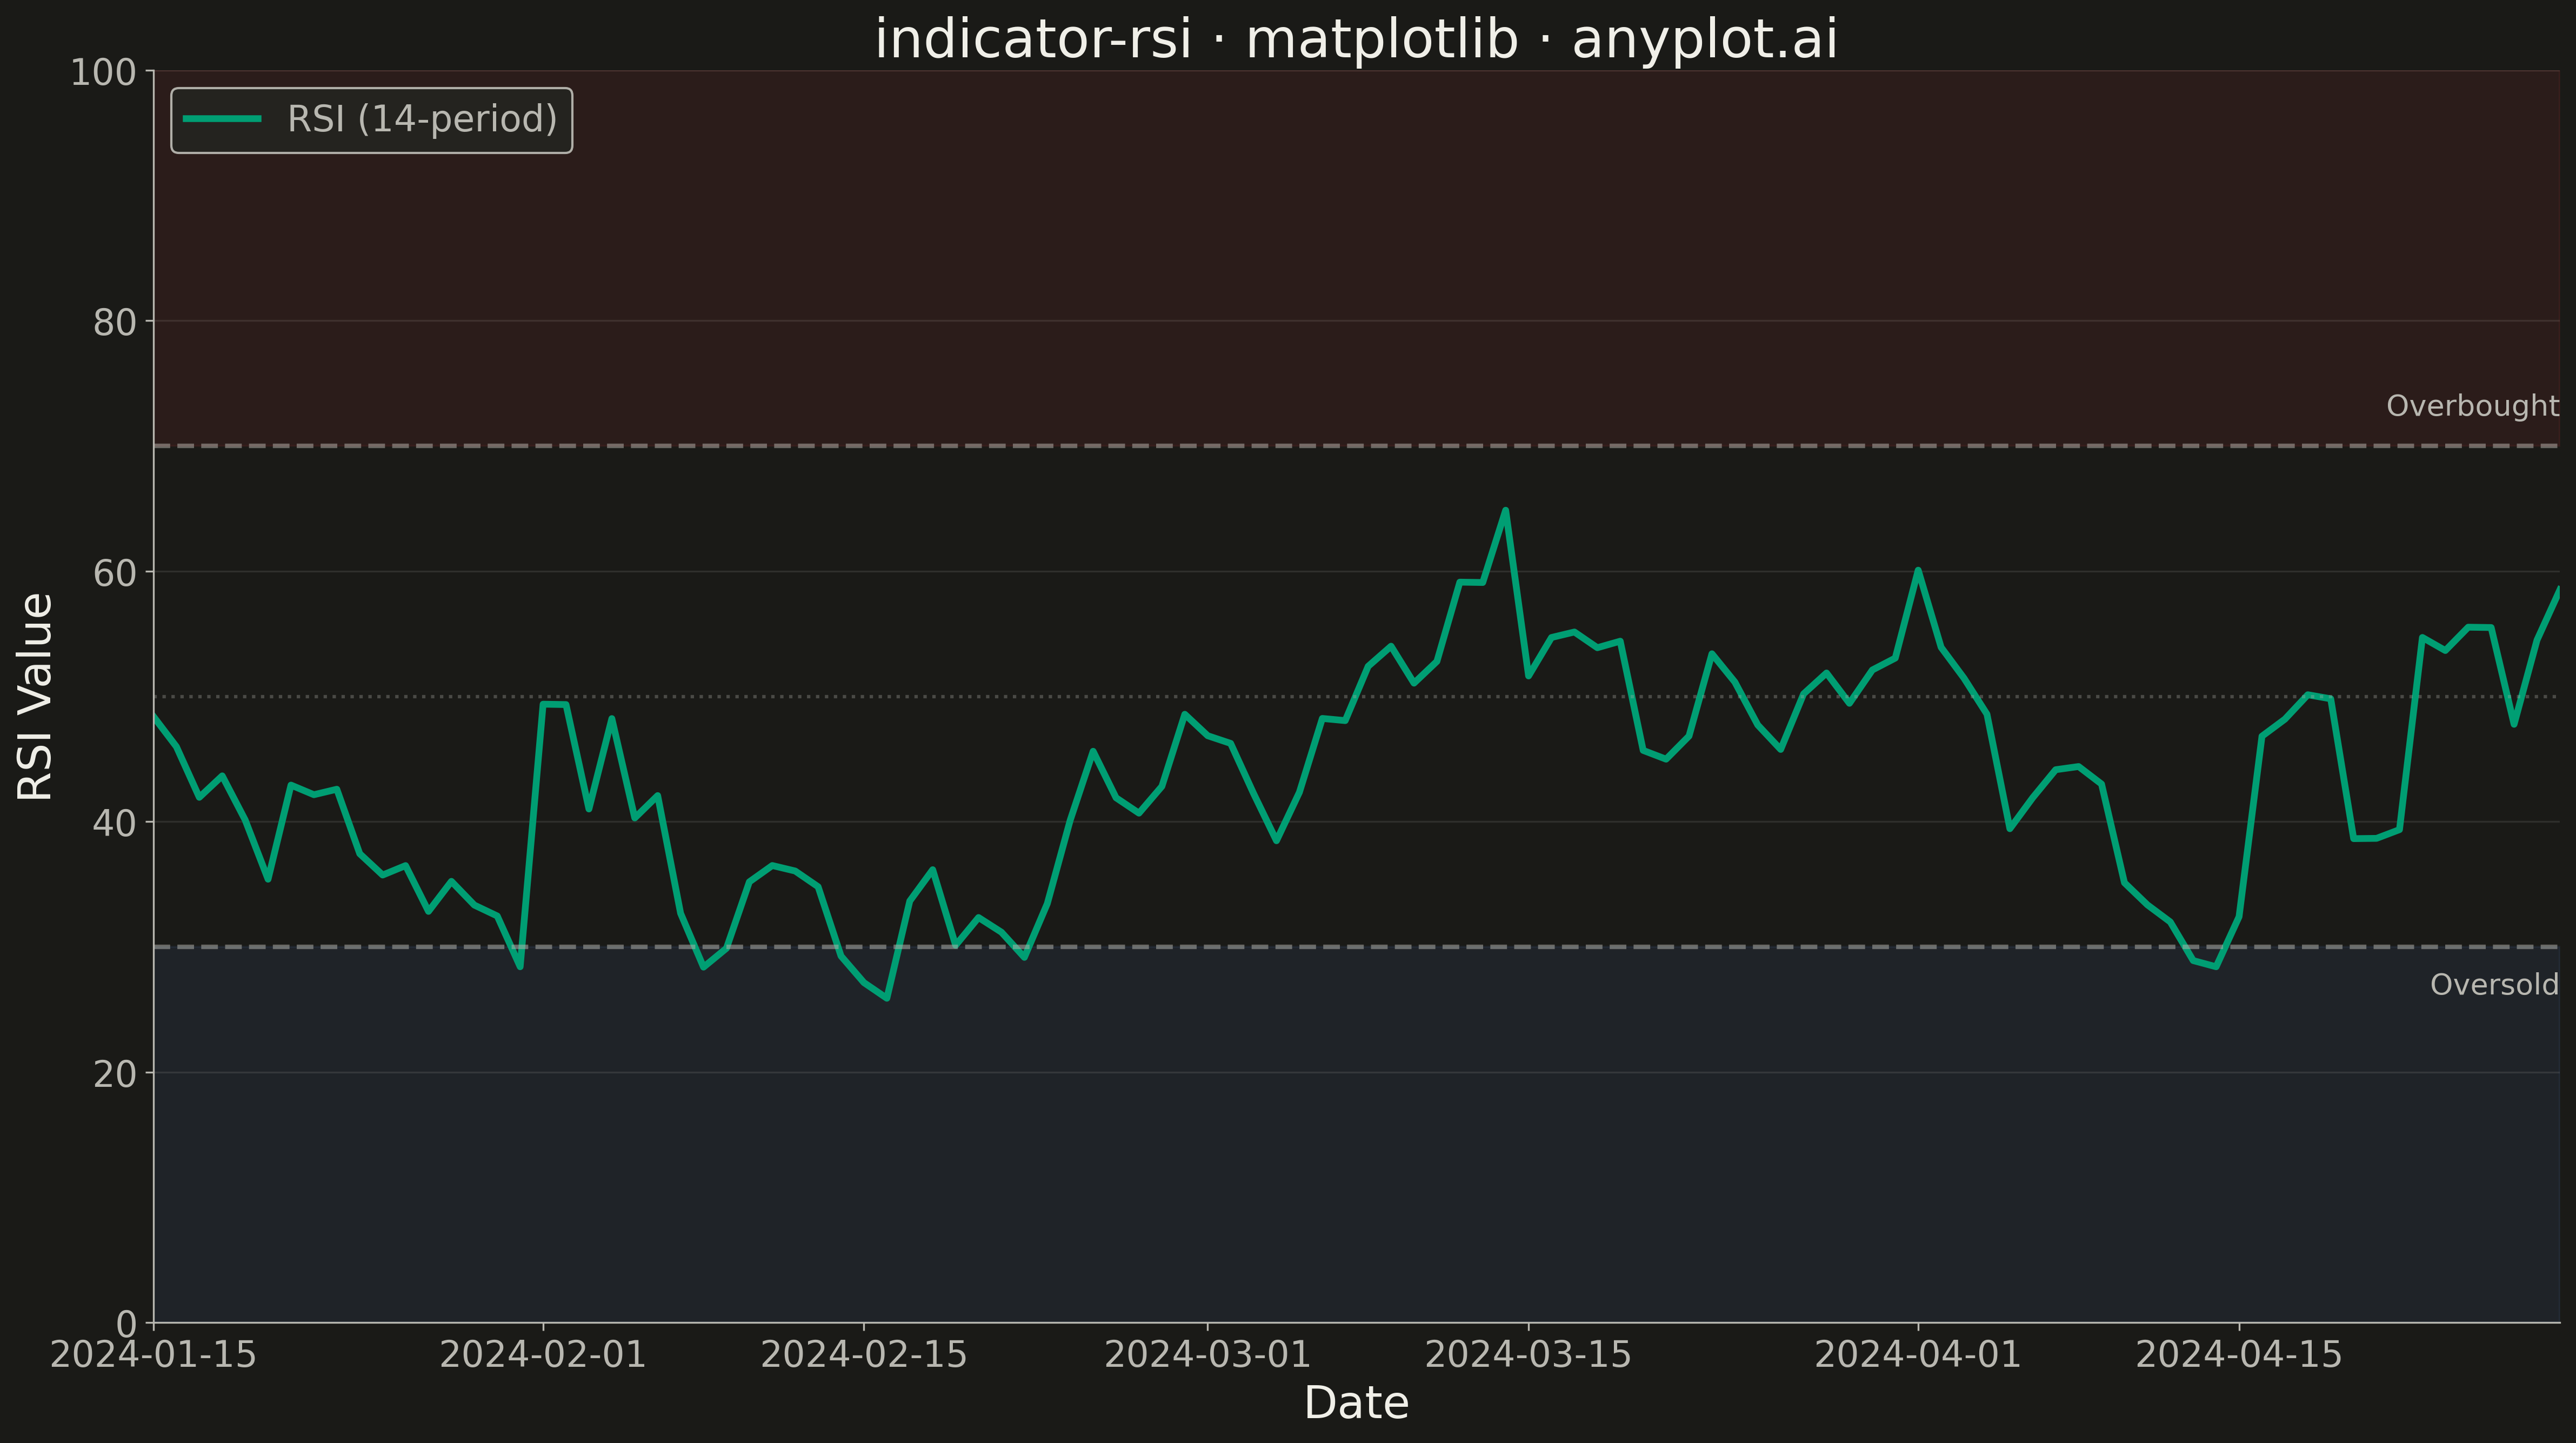
A Relative Strength Index (RSI) chart displaying the momentum oscillator on a 0-100 scale with horizontal threshold lines at 70 (overbought) and 30 (oversold). The RSI measures the speed and magnitude of recent price changes to evaluate overbought or oversold conditions. This is a fundamental momentum indicator in technical analysis, helping traders identify potential reversal points when the market reaches extreme conditions.
Preview render from the Matplotlib implementation.