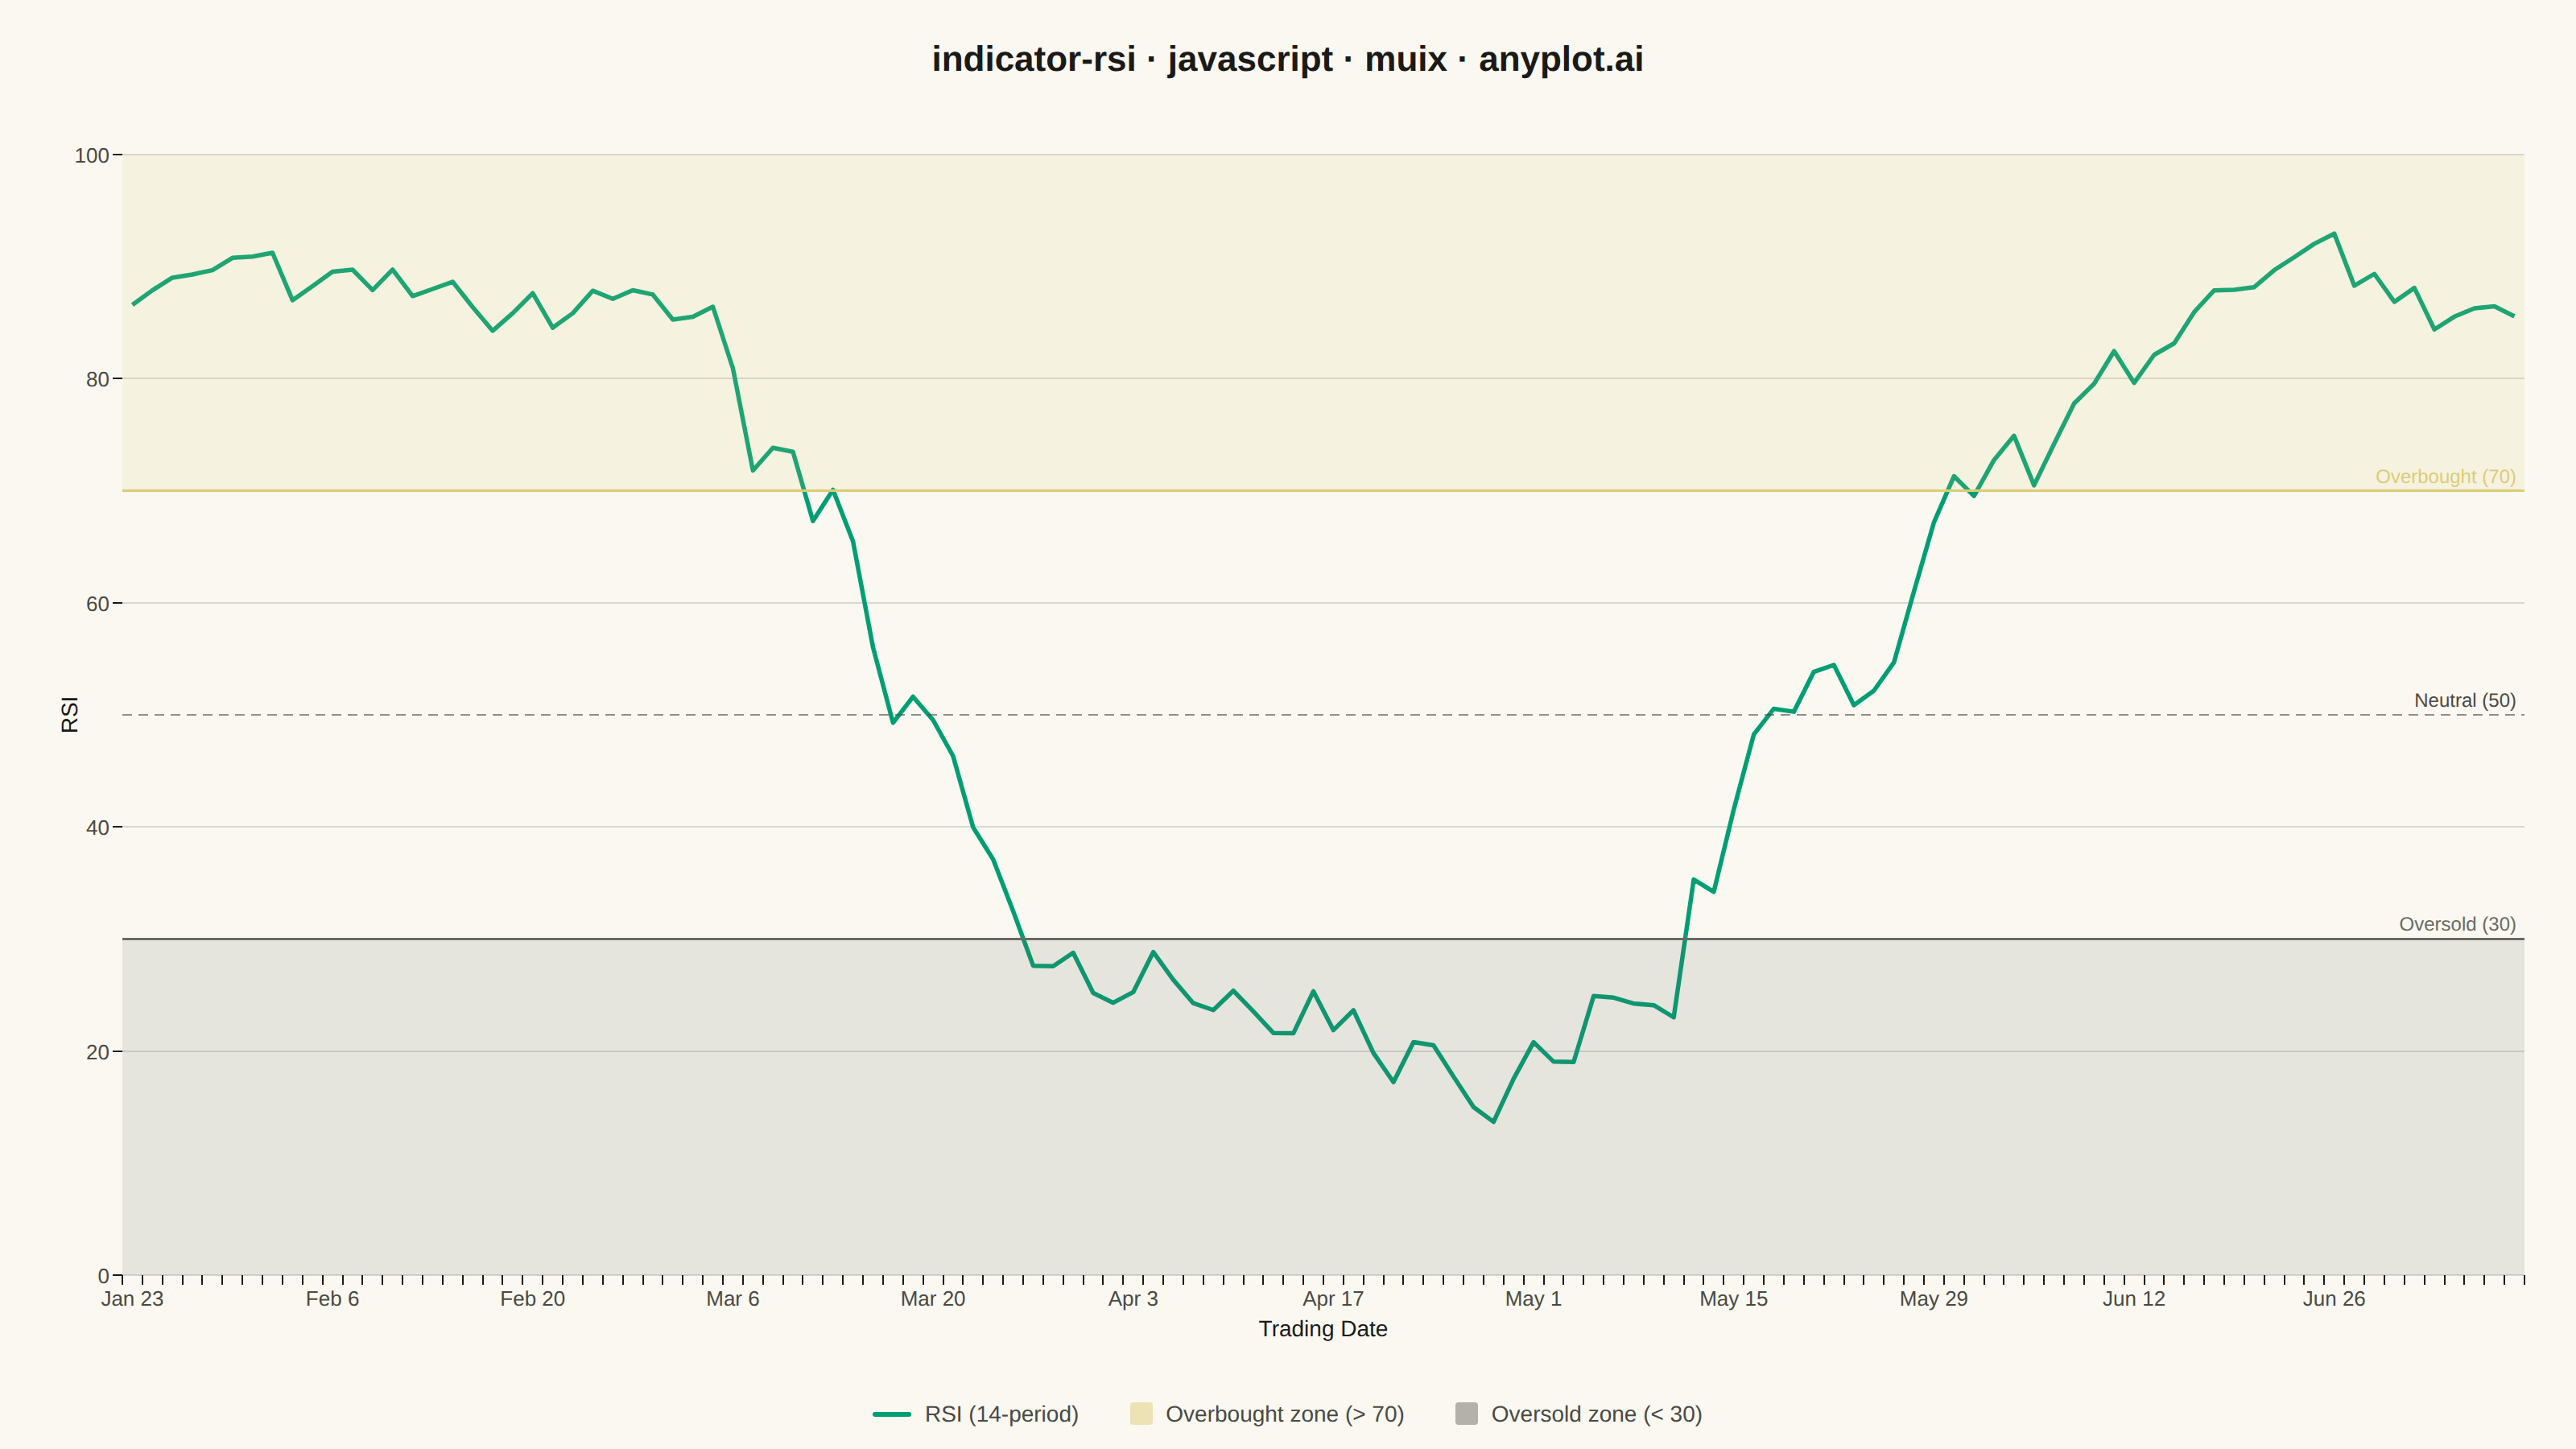
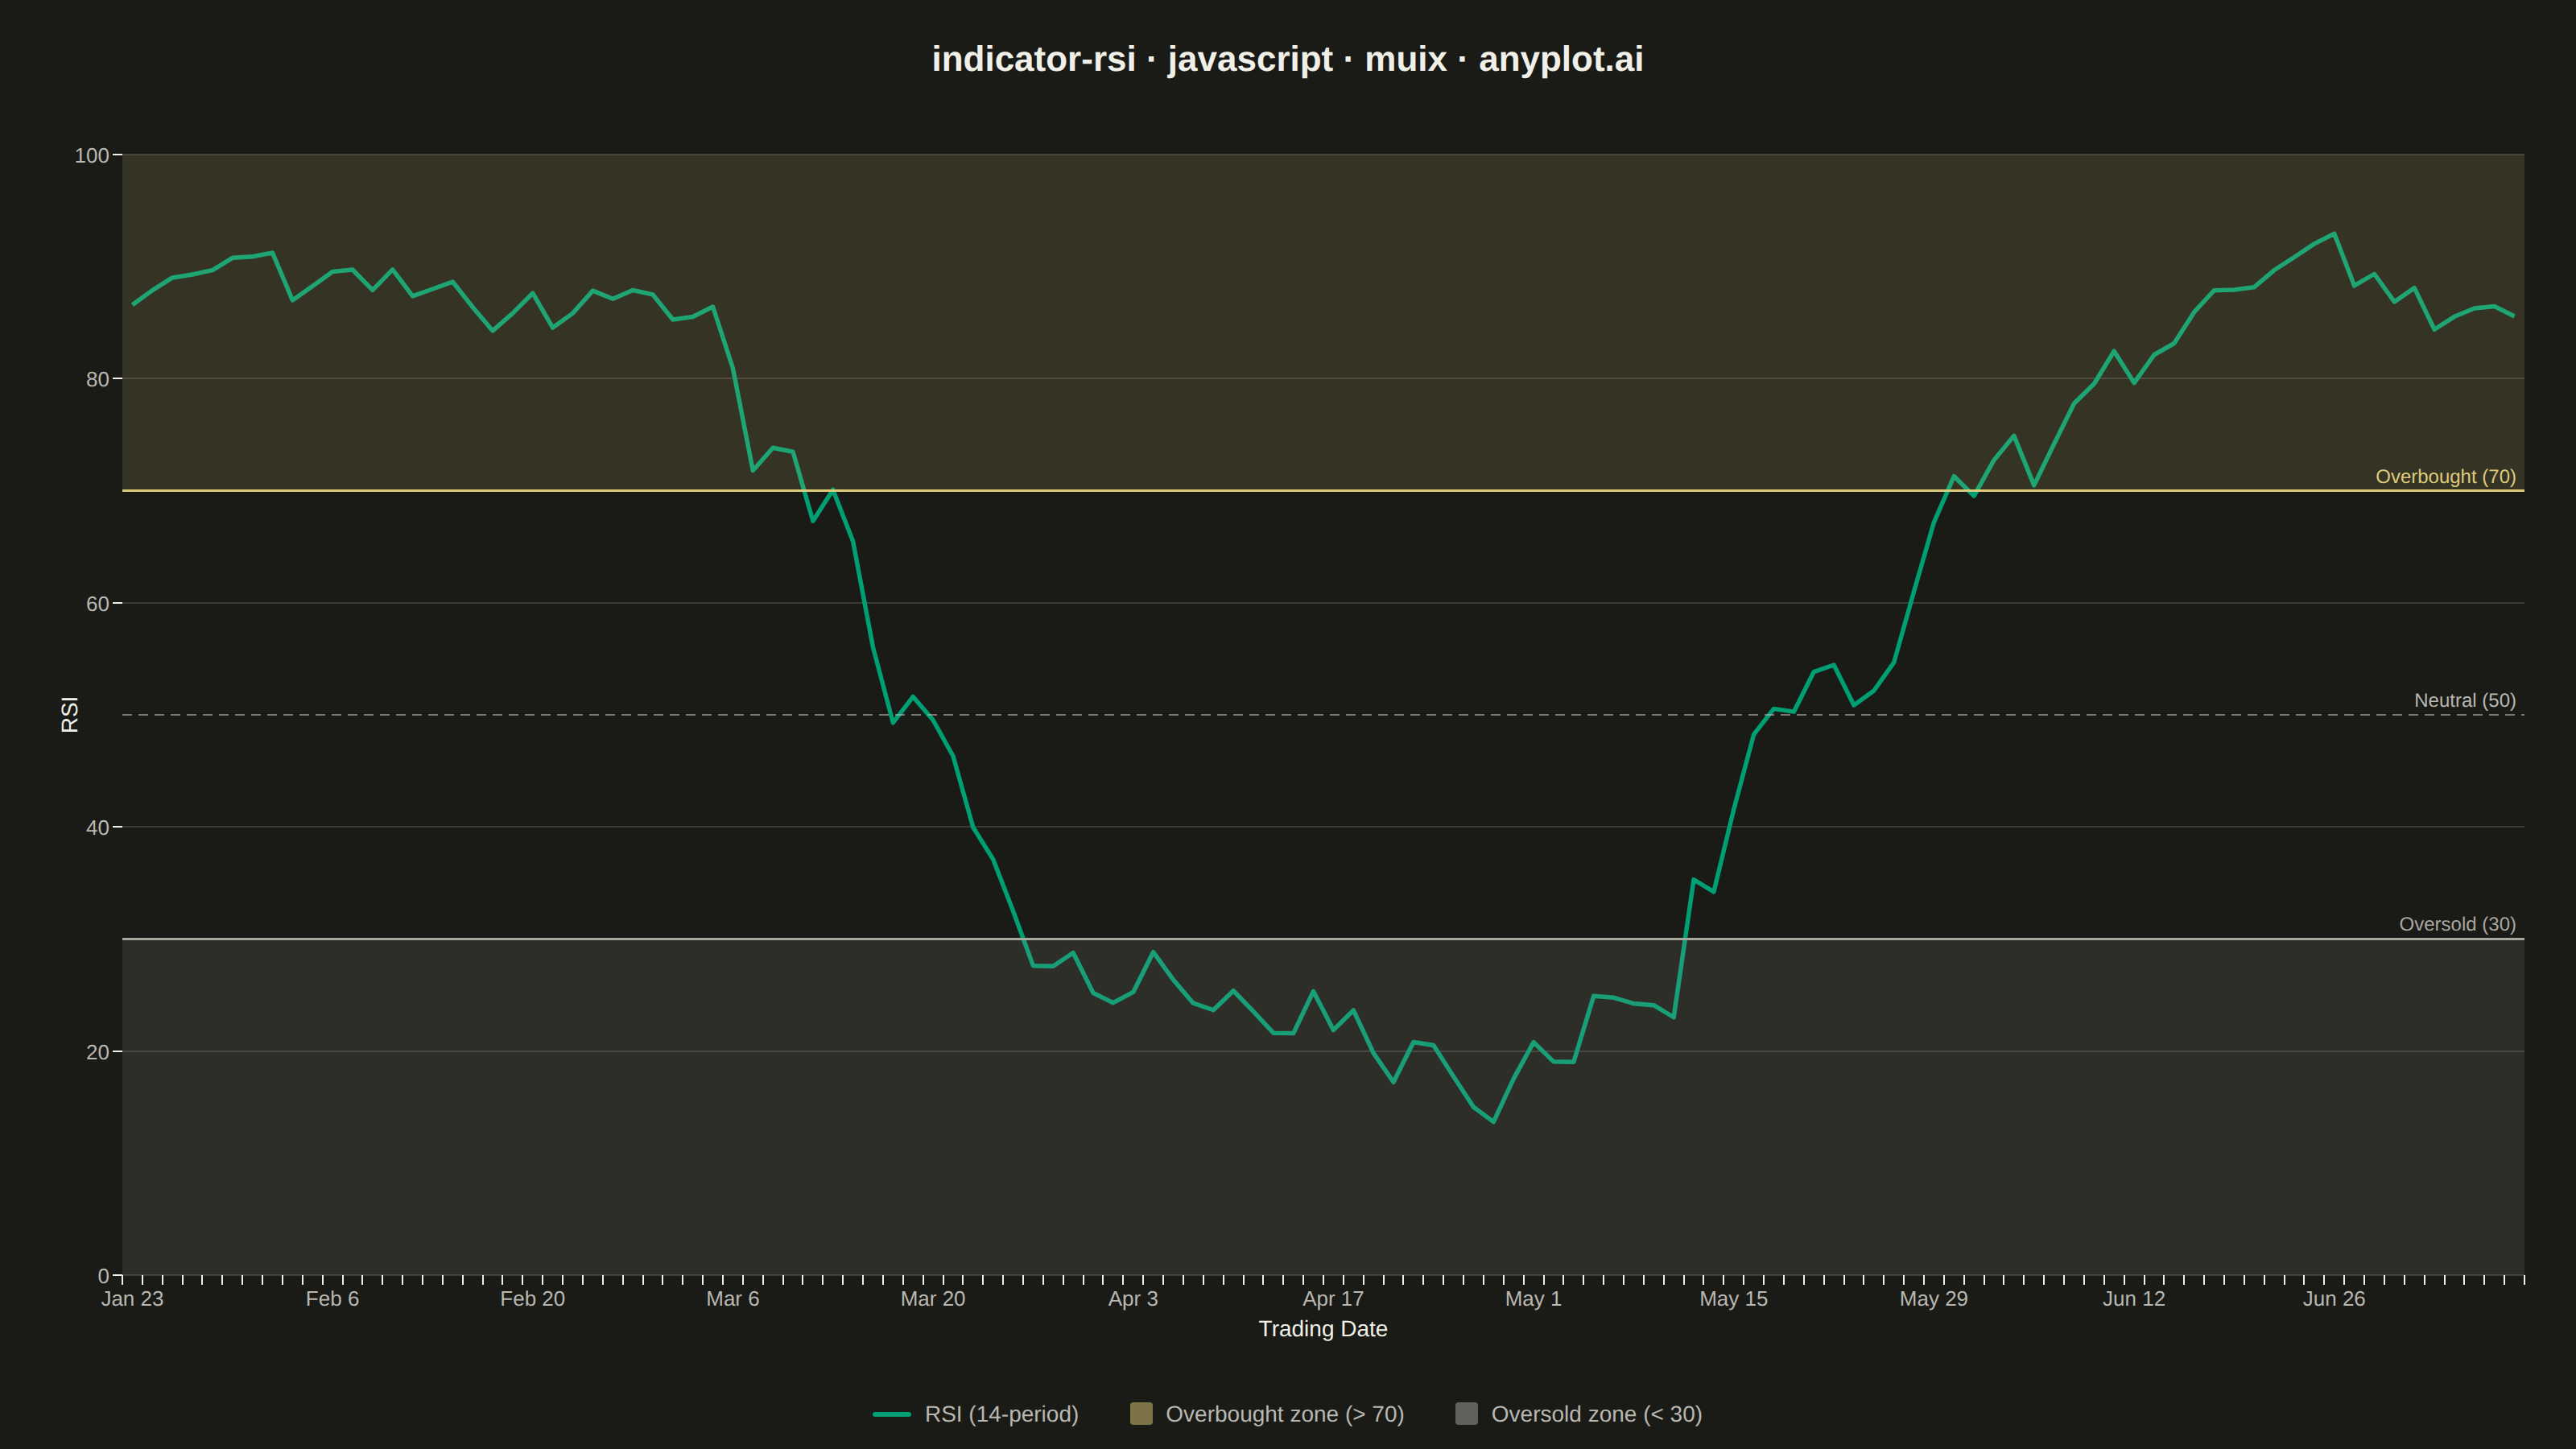
The same plot in 14 other libraries — JavaScript: Chart.js, D3.js, Apache ECharts, Highcharts; Python: Altair, Bokeh, lets-plot, Matplotlib, Plotly, plotnine, Pygal, Seaborn; R: ggplot2; Julia: Makie.jl. Compare all 15 side by side: RSI Technical Indicator Chart in Python, R, Julia and JavaScript.
A Relative Strength Index (RSI) chart displaying the momentum oscillator on a 0-100 scale with horizontal threshold lines at 70 (overbought) and 30 (oversold). The RSI measures the speed and magnitude of recent price changes to evaluate overbought or oversold conditions. This is a fundamental momentum indicator in technical analysis, helping traders identify potential reversal points when the market reaches extreme conditions.
// anyplot.ai
// indicator-rsi: RSI Technical Indicator Chart
// Library: muix 7.29.1 | JavaScript 22.23.2
// Quality: 91/100 | Created: 2026-09-05
import { ChartContainer } from "@mui/x-charts/ChartContainer";
import { LinePlot } from "@mui/x-charts/LineChart";
import { ChartsXAxis } from "@mui/x-charts/ChartsXAxis";
import { ChartsYAxis } from "@mui/x-charts/ChartsYAxis";
import { ChartsGrid } from "@mui/x-charts/ChartsGrid";
import { ChartsReferenceLine } from "@mui/x-charts/ChartsReferenceLine";
import { ChartsTooltip } from "@mui/x-charts/ChartsTooltip";
import Box from "@mui/material/Box";
import Typography from "@mui/material/Typography";
const t = window.ANYPLOT_TOKENS;
const isDark = window.ANYPLOT_THEME === "dark";
const MUTED = isDark ? "#A8A79F" : "#6B6A63"; // theme-adaptive Imprint "muted" anchor (not in ANYPLOT_TOKENS)
const LOOKBACK = 14;
const RSI_PERIODS = 120;
// Tiny fixed-seed LCG — the browser has no seeded Math.random().
function lcg(seed) {
let state = seed;
return () => {
state = (state * 1664525 + 1013904223) % 4294967296;
return state / 4294967296;
};
}
const rand = lcg(7);
// Business-day dates starting Jan 2, 2025.
const totalDays = RSI_PERIODS + LOOKBACK;
const dates = [];
const cursor = new Date(Date.UTC(2025, 0, 2));
while (dates.length < totalDays + 1) {
const weekday = cursor.getUTCDay();
if (weekday !== 0 && weekday !== 6) {
dates.push(new Date(cursor));
}
cursor.setUTCDate(cursor.getUTCDate() + 1);
}
const dateFormatter = new Intl.DateTimeFormat("en-US", { month: "short", day: "numeric", timeZone: "UTC" });
// Closing price: a slow oscillation (bull/bear swings) plus noise, so the
// resulting RSI comfortably reaches both the oversold and overbought bands.
const closes = [];
let price = 62;
for (let i = 0; i <= totalDays; i++) {
const trend = 0.55 * Math.sin(i / 14) + 0.18 * Math.sin(i / 4.5);
const noise = (rand() - 0.5) * 1.9;
price += trend + noise;
closes.push(price);
}
// Wilder's RSI(14): average gain/loss smoothed with a (period-1)/period decay.
function computeRSI(values, period) {
const gains = [];
const losses = [];
for (let i = 1; i < values.length; i++) {
const change = values[i] - values[i - 1];
gains.push(Math.max(change, 0));
losses.push(Math.max(-change, 0));
}
let avgGain = gains.slice(0, period).reduce((a, b) => a + b, 0) / period;
let avgLoss = losses.slice(0, period).reduce((a, b) => a + b, 0) / period;
const rsi = [avgLoss === 0 ? 100 : 100 - 100 / (1 + avgGain / avgLoss)];
for (let i = period; i < gains.length; i++) {
avgGain = (avgGain * (period - 1) + gains[i]) / period;
avgLoss = (avgLoss * (period - 1) + losses[i]) / period;
rsi.push(avgLoss === 0 ? 100 : 100 - 100 / (1 + avgGain / avgLoss));
}
return rsi;
}
const rsiValues = computeRSI(closes, LOOKBACK).slice(0, RSI_PERIODS);
const dateLabels = dates.slice(dates.length - RSI_PERIODS).map((d) => dateFormatter.format(d));
const MARGIN = { top: 24, right: 32, bottom: 64, left: 76 };
// The y-axis is a fixed 0-100 linear scale, so the pixel position of any RSI
// value within the plot area is a plain linear map — used to draw the
// oversold/overbought backdrop bands without a Pro-only reference-area component.
function yToPixel(value, plotHeight) {
return MARGIN.top + ((100 - value) / 100) * plotHeight;
}
export default function Chart() {
const W = window.ANYPLOT_SIZE.width; // 1600 CSS px (landscape)
const H = window.ANYPLOT_SIZE.height; // 900 CSS px
const TITLE_H = 72;
const LEGEND_H = 44;
const chartH = H - TITLE_H - LEGEND_H;
const plotHeight = chartH - MARGIN.top - MARGIN.bottom;
const overboughtBand = { top: yToPixel(100, plotHeight), height: yToPixel(70, plotHeight) - yToPixel(100, plotHeight) };
const oversoldBand = { top: yToPixel(30, plotHeight), height: yToPixel(0, plotHeight) - yToPixel(30, plotHeight) };
return (
<Box
sx={{
width: W,
height: H,
bgcolor: t.pageBg,
display: "flex",
flexDirection: "column",
fontFamily: "'Roboto', 'Helvetica Neue', Arial, sans-serif",
boxSizing: "border-box",
}}
>
{/* Title */}
<Box sx={{ height: TITLE_H, display: "flex", alignItems: "center", justifyContent: "center" }}>
<Typography sx={{ color: t.ink, fontSize: 22, fontWeight: 600 }}>
indicator-rsi · javascript · muix · anyplot.ai
</Typography>
</Box>
{/* Chart — wrapped in a relative box so the oversold/overbought bands can
sit as plain absolutely-positioned layers behind the (transparent)
MUI X chart, computed from the fixed 0-100 linear y-scale. */}
<Box sx={{ position: "relative", width: W, height: chartH }}>
<Box
sx={{
position: "absolute",
left: MARGIN.left,
right: MARGIN.right,
top: overboughtBand.top,
height: overboughtBand.height,
bgcolor: t.amber,
opacity: 0.14,
pointerEvents: "none",
}}
/>
<Box
sx={{
position: "absolute",
left: MARGIN.left,
right: MARGIN.right,
top: oversoldBand.top,
height: oversoldBand.height,
bgcolor: MUTED,
opacity: 0.14,
pointerEvents: "none",
}}
/>
<ChartContainer
width={W}
height={chartH}
series={[
{
type: "line",
id: "rsi",
data: rsiValues,
label: "RSI (14)",
color: t.palette[0],
showMark: false,
curve: "linear",
},
]}
xAxis={[
{
id: "dates",
scaleType: "band",
data: dateLabels,
categoryGapRatio: 0.15,
tickLabelInterval: (_value, index) => index % 10 === 0,
tickLabelStyle: { fontSize: 13, fill: t.inkSoft },
},
]}
yAxis={[
{
id: "rsi-axis",
min: 0,
max: 100,
tickNumber: 6,
tickLabelStyle: { fontSize: 13, fill: t.inkSoft },
},
]}
margin={MARGIN}
skipAnimation
sx={{
"& .MuiChartsGrid-line": { stroke: t.grid },
"& .MuiLineElement-root": { strokeWidth: 2.75 },
}}
>
<ChartsGrid horizontal />
<LinePlot skipAnimation />
<ChartsReferenceLine
y={70}
axisId="rsi-axis"
label="Overbought (70)"
labelAlign="end"
labelStyle={{ fontSize: 12, fill: t.amber }}
lineStyle={{ stroke: t.amber, strokeWidth: 1.5 }}
/>
<ChartsReferenceLine
y={30}
axisId="rsi-axis"
label="Oversold (30)"
labelAlign="end"
labelStyle={{ fontSize: 12, fill: MUTED }}
lineStyle={{ stroke: MUTED, strokeWidth: 1.5 }}
/>
<ChartsReferenceLine
y={50}
axisId="rsi-axis"
label="Neutral (50)"
labelAlign="end"
labelStyle={{ fontSize: 12, fill: t.inkSoft }}
lineStyle={{ stroke: t.inkSoft, strokeDasharray: "6 4", strokeOpacity: 0.6 }}
/>
<ChartsXAxis
axisId="dates"
position="bottom"
label="Trading Date"
labelStyle={{ fontSize: 14, fill: t.ink }}
disableLine
/>
<ChartsYAxis
axisId="rsi-axis"
position="left"
label="RSI"
labelStyle={{ fontSize: 14, fill: t.ink }}
disableLine
/>
<ChartsTooltip trigger="axis" />
</ChartContainer>
</Box>
{/* Legend */}
<Box sx={{ height: LEGEND_H, display: "flex", alignItems: "center", justifyContent: "center", gap: "32px" }}>
<Box sx={{ display: "flex", alignItems: "center", gap: "8px" }}>
<Box sx={{ width: 24, height: 3, bgcolor: t.palette[0], borderRadius: "2px", flexShrink: 0 }} />
<Typography sx={{ color: t.inkSoft, fontSize: 14 }}>RSI (14-period)</Typography>
</Box>
<Box sx={{ display: "flex", alignItems: "center", gap: "8px" }}>
<Box sx={{ width: 14, height: 14, bgcolor: t.amber, opacity: 0.5, borderRadius: "2px", flexShrink: 0 }} />
<Typography sx={{ color: t.inkSoft, fontSize: 14 }}>Overbought zone (> 70)</Typography>
</Box>
<Box sx={{ display: "flex", alignItems: "center", gap: "8px" }}>
<Box sx={{ width: 14, height: 14, bgcolor: MUTED, opacity: 0.5, borderRadius: "2px", flexShrink: 0 }} />
<Typography sx={{ color: t.inkSoft, fontSize: 14 }}>Oversold zone (< 30)</Typography>
</Box>
</Box>
</Box>
);
}
Runnable source as JSON, for any HTTP client: https://api.anyplot.ai/specs/indicator-rsi/muix/code. Any spec id and library id listed in llms-full.txt fit the same URL shape; every URL below is complete and callable.
{
  "spec_id": "indicator-rsi",
  "language": "javascript",
  "library": "muix",
  "page": "https://anyplot.ai/indicator-rsi/javascript/muix",
  "hub": "https://anyplot.ai/indicator-rsi",
  "code_json": "https://api.anyplot.ai/specs/indicator-rsi/muix/code",
  "spec_json": "https://api.anyplot.ai/specs/indicator-rsi",
  "render_light_png": "https://storage.googleapis.com/anyplot-images/plots/indicator-rsi/javascript/muix/plot-light.png",
  "render_dark_png": "https://storage.googleapis.com/anyplot-images/plots/indicator-rsi/javascript/muix/plot-dark.png",
  "interactive_light_html": "https://storage.googleapis.com/anyplot-images/plots/indicator-rsi/javascript/muix/plot-light.html",
  "interactive_dark_html": "https://storage.googleapis.com/anyplot-images/plots/indicator-rsi/javascript/muix/plot-dark.html",
  "quality_score": 91.0,
  "license": "MIT",
  "guide": "https://anyplot.ai/llms.txt"
}
Part of RSI Technical Indicator Chart on anyplot.ai.