The same plot in 14 other libraries — Python: Altair, Bokeh, lets-plot, Matplotlib, Plotly, plotnine, Pygal, Seaborn; R: ggplot2; JavaScript: Chart.js, D3.js, Apache ECharts, Highcharts, MUI X Charts. Compare all 15 side by side: RSI Technical Indicator Chart in Python, R, Julia and JavaScript.
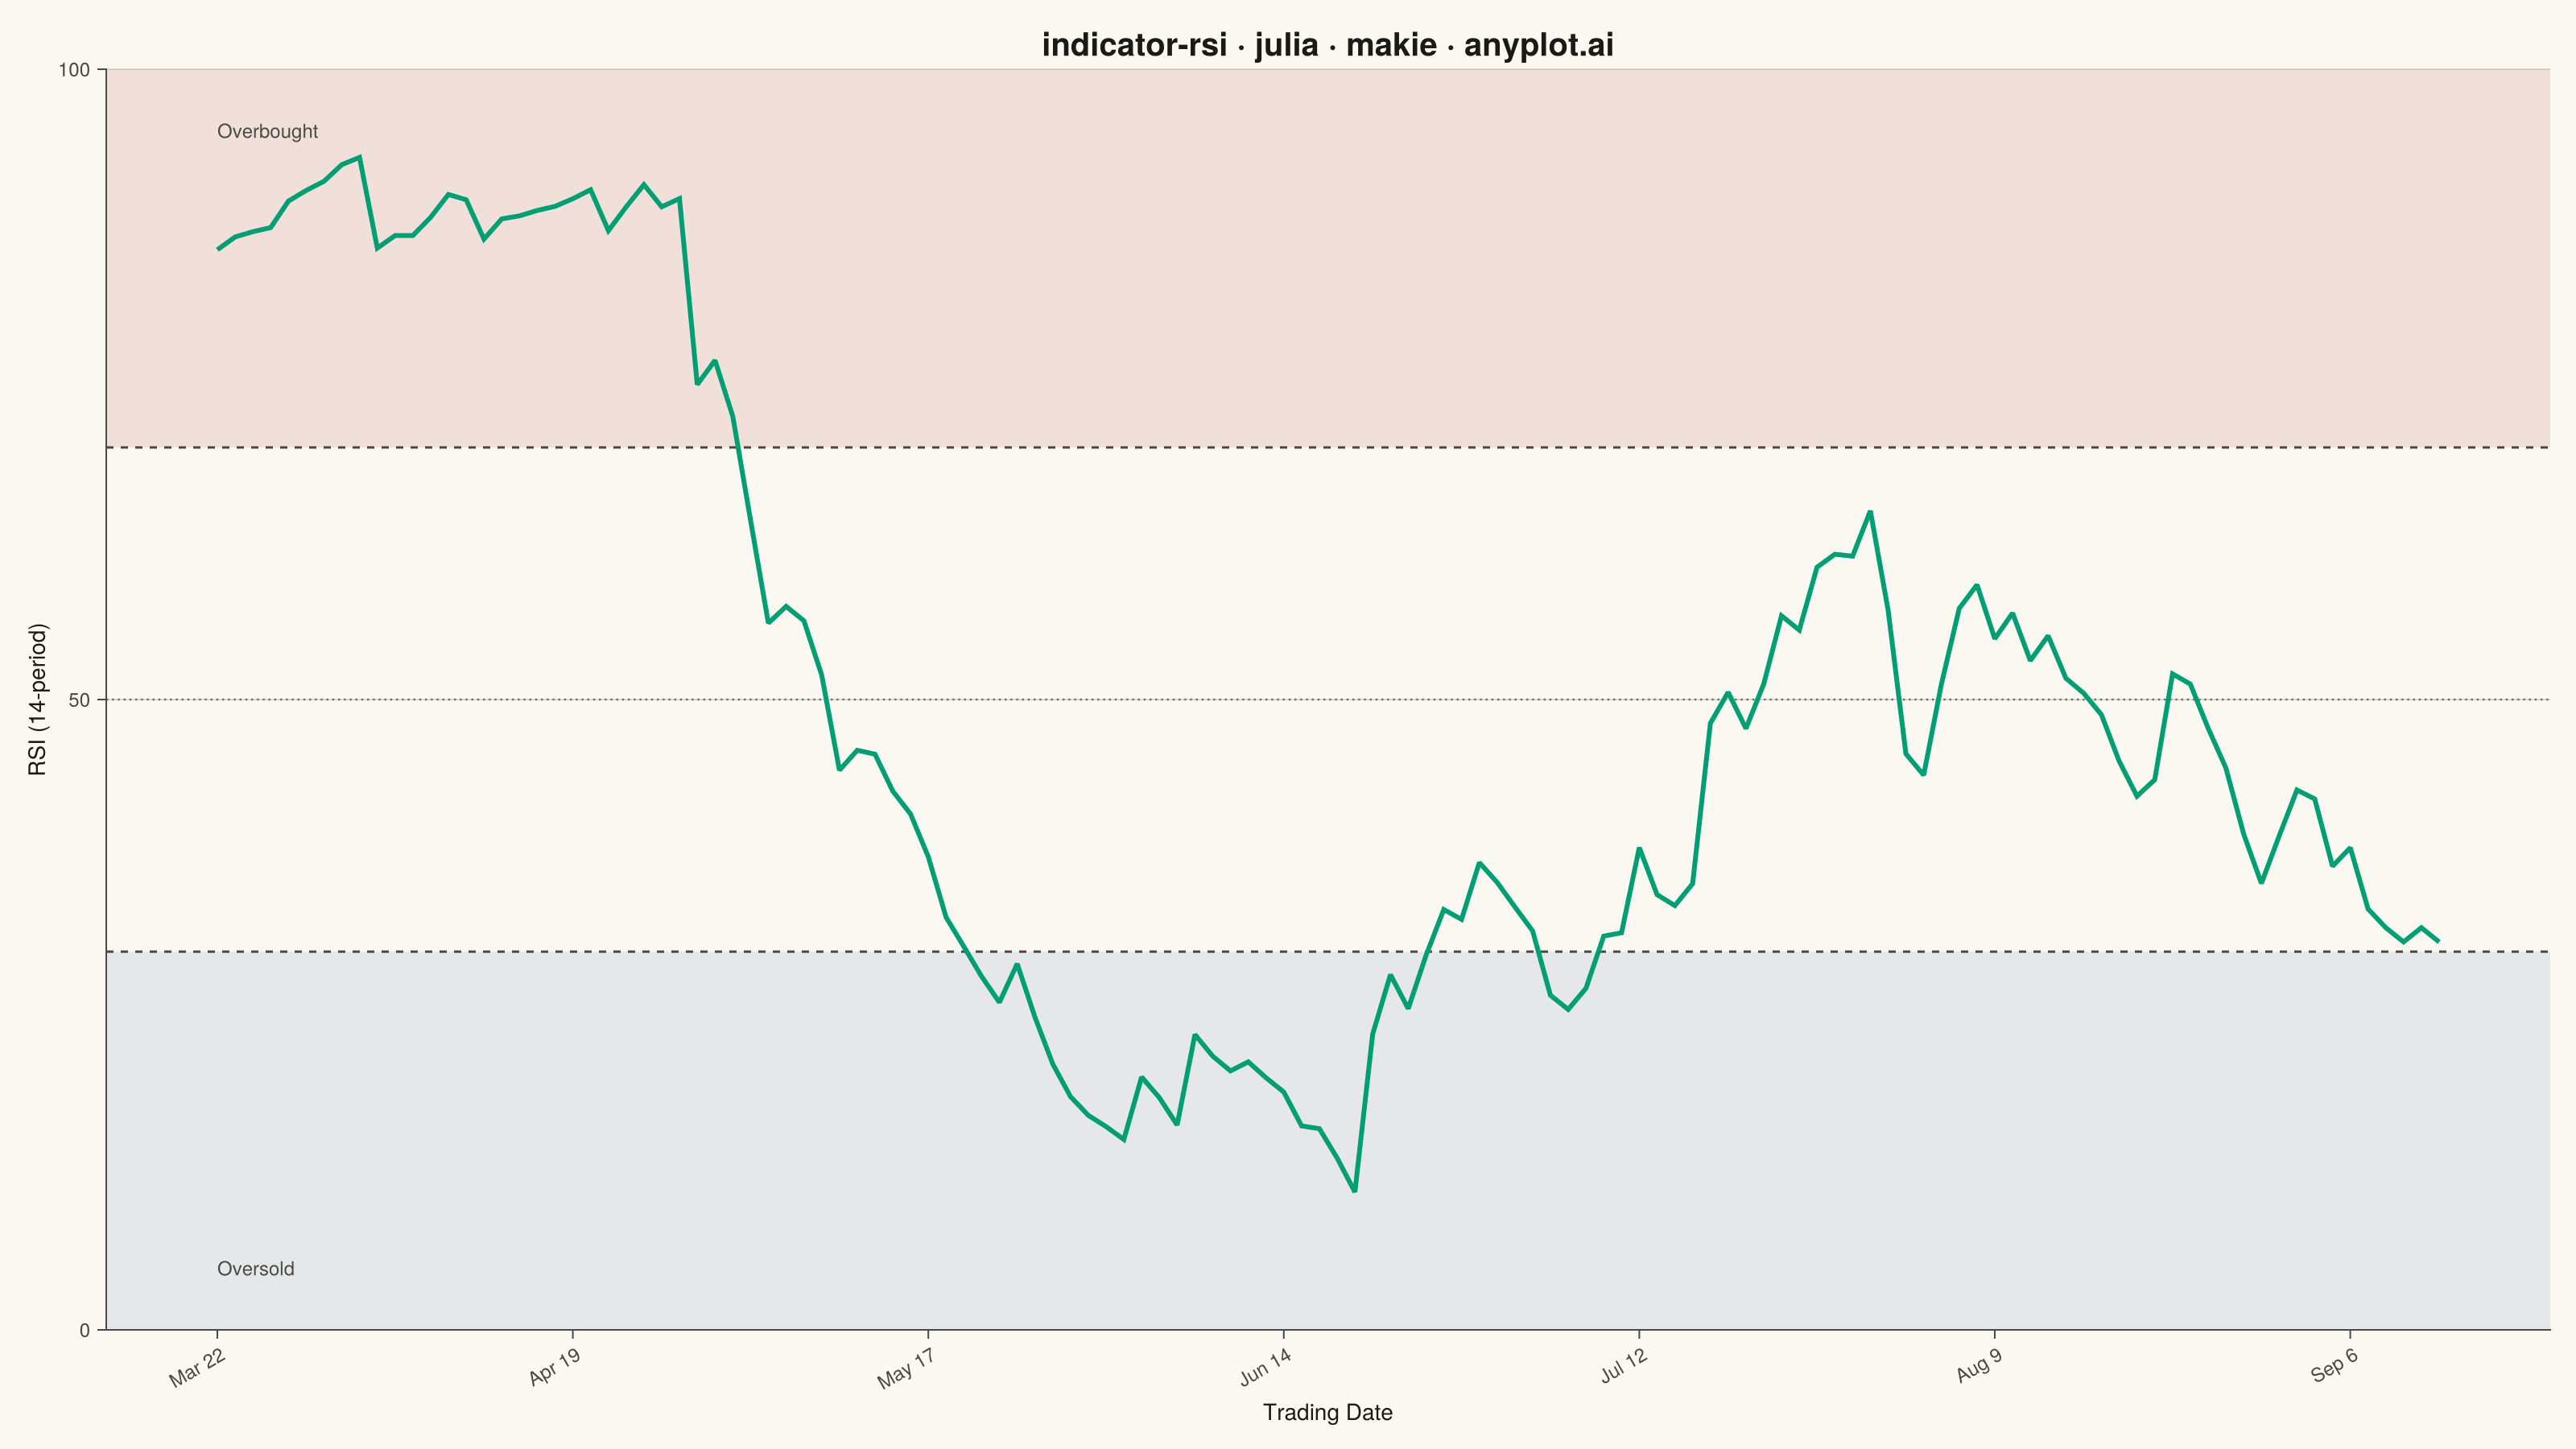
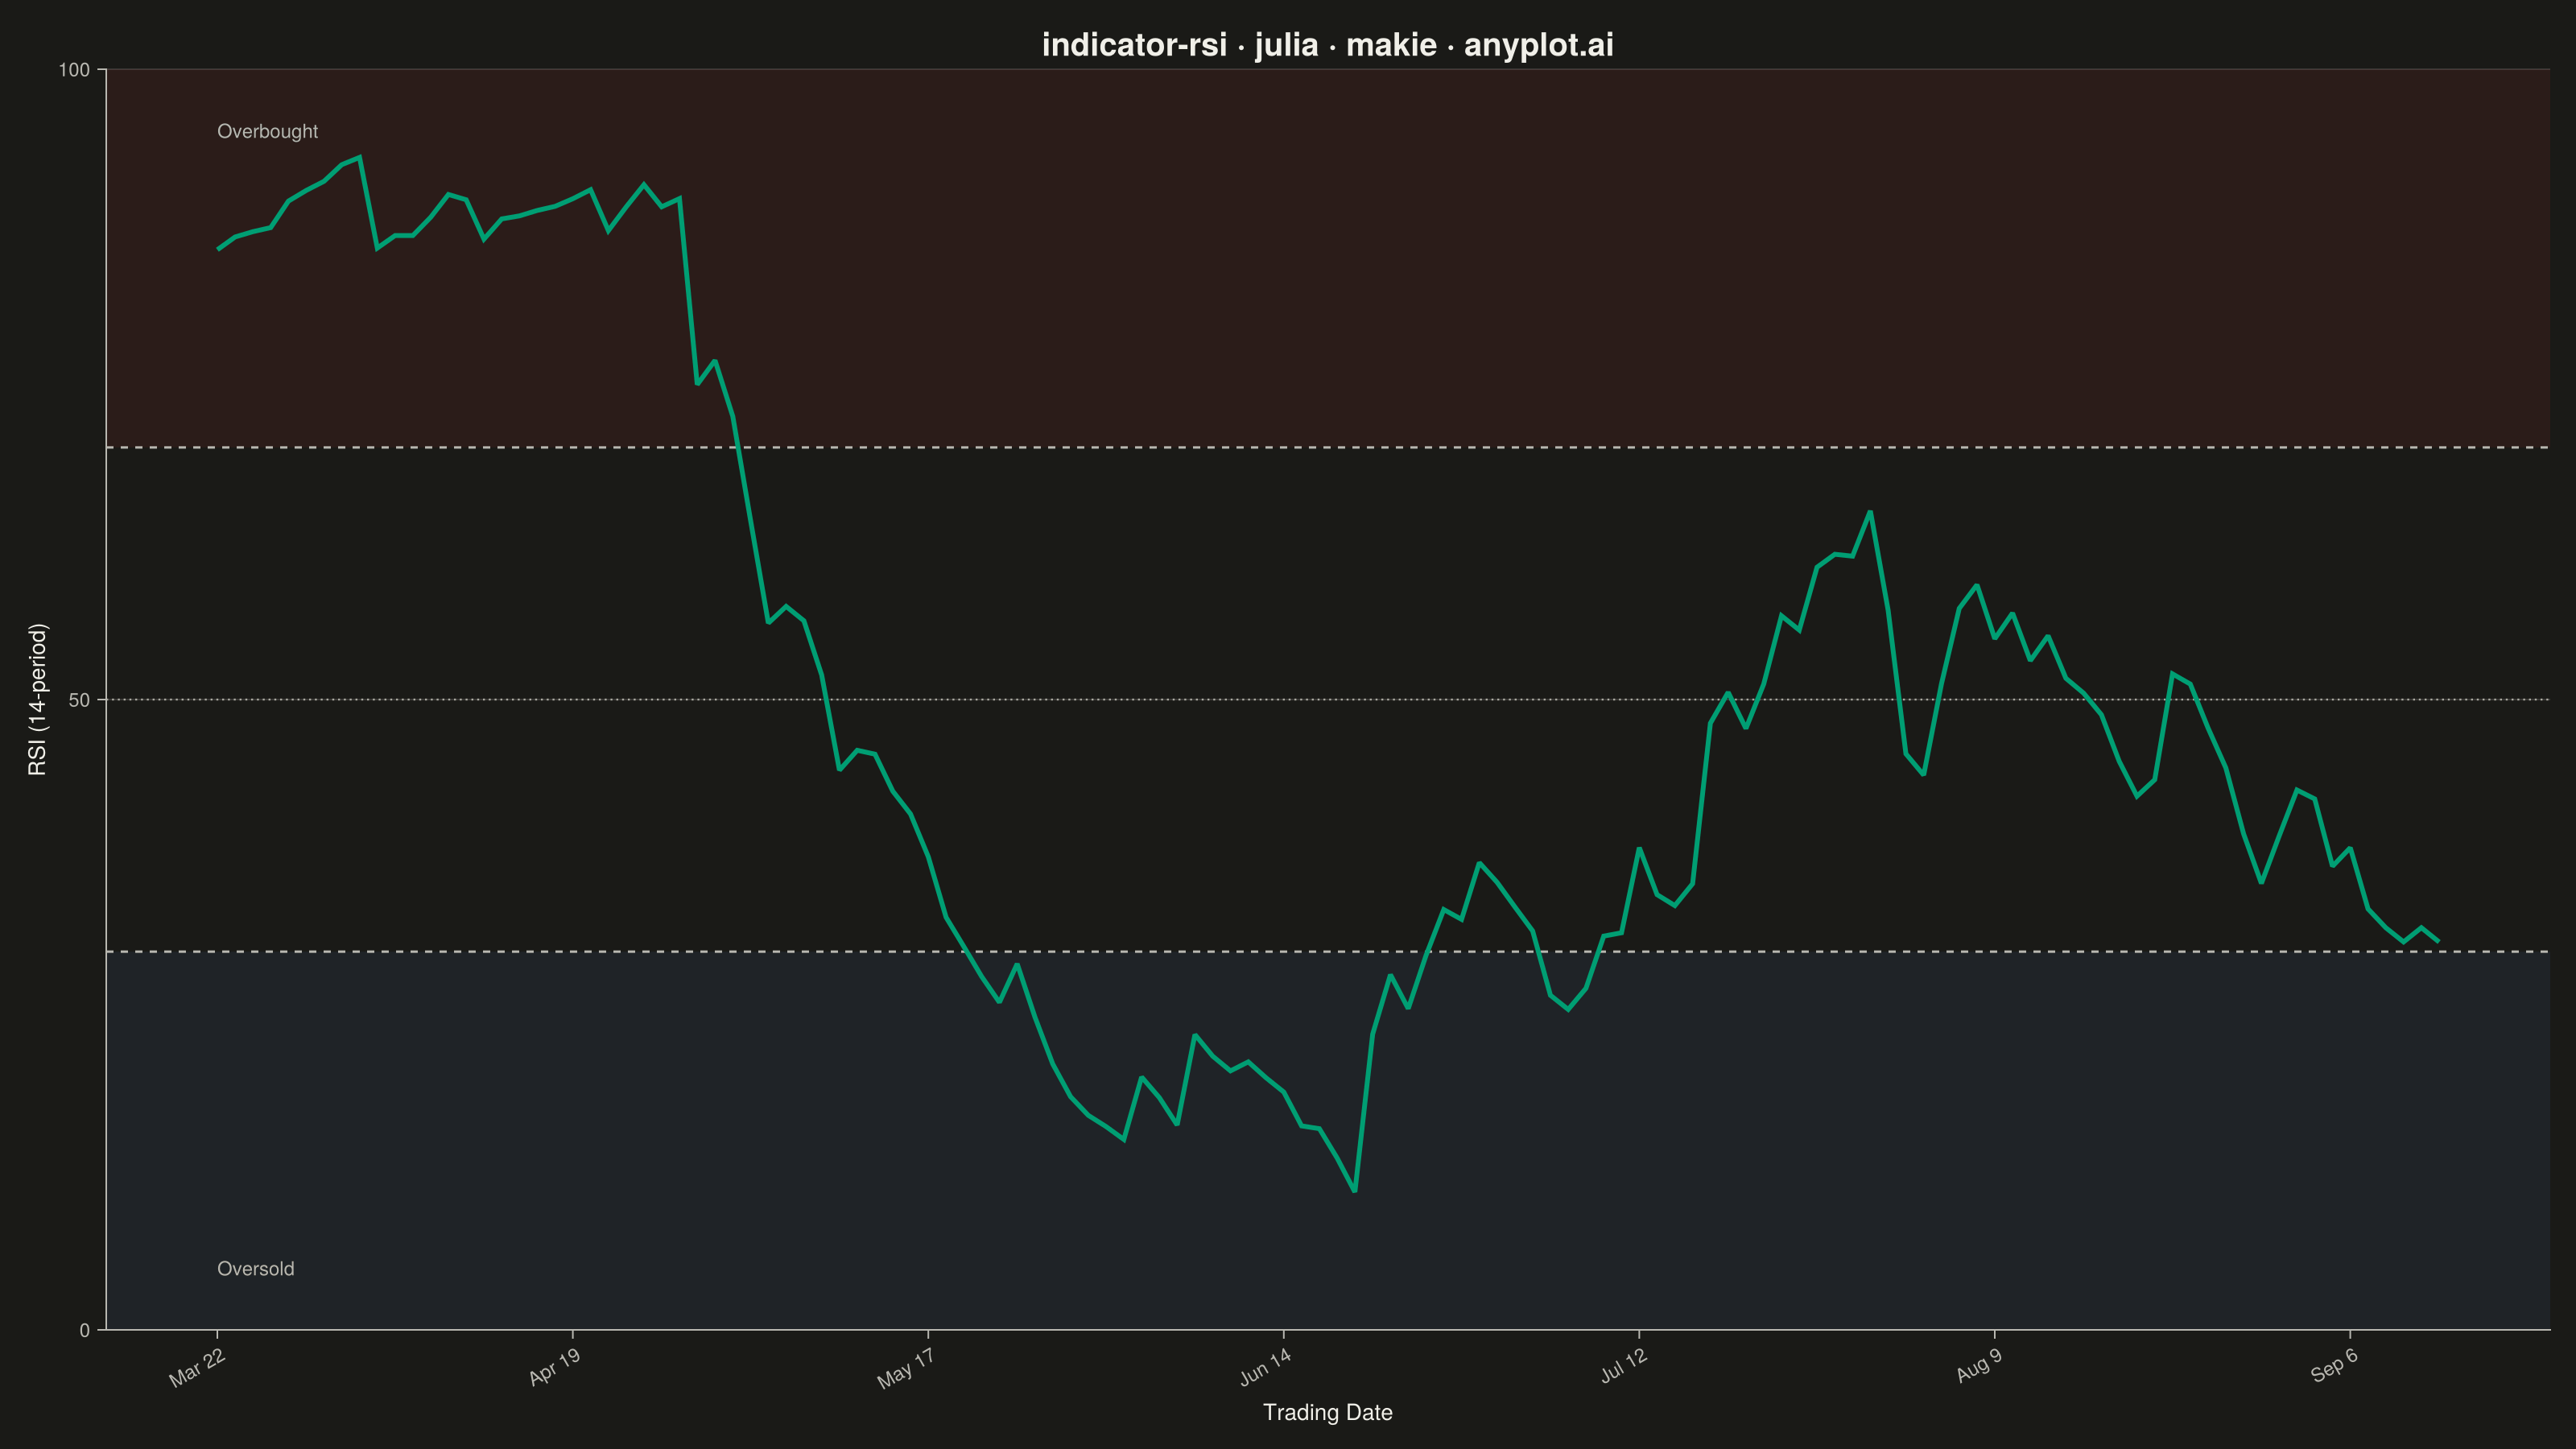
A Relative Strength Index (RSI) chart displaying the momentum oscillator on a 0-100 scale with horizontal threshold lines at 70 (overbought) and 30 (oversold). The RSI measures the speed and magnitude of recent price changes to evaluate overbought or oversold conditions. This is a fundamental momentum indicator in technical analysis, helping traders identify potential reversal points when the market reaches extreme conditions.
# anyplot.ai
# indicator-rsi: RSI Technical Indicator Chart
# Library: makie 0.21.9 | Julia 1.11.9
# Quality: 93/100 | Created: 2026-09-05

using CairoMakie
using Colors
using Dates
using Random
using Statistics

Random.seed!(42)

# Theme tokens (see prompts/default-style-guide.md "Theme-adaptive Chrome")
const THEME     = get(ENV, "ANYPLOT_THEME", "light")
const PAGE_BG   = THEME == "light" ? colorant"#FAF8F1" : colorant"#1A1A17"
const INK       = THEME == "light" ? colorant"#1A1A17" : colorant"#F0EFE8"
const INK_SOFT  = THEME == "light" ? colorant"#4A4A44" : colorant"#B8B7B0"
const INK_MUTED = THEME == "light" ? colorant"#6B6A63" : colorant"#A8A79F"

# Imprint palette — first series always brand green
const IMPRINT_PALETTE = [
    colorant"#009E73", colorant"#C475FD", colorant"#4467A3", colorant"#BD8233",
    colorant"#AE3030", colorant"#2ABCCD", colorant"#954477", colorant"#99B314",
]
const RSI_COLOR        = IMPRINT_PALETTE[1]  # brand green
const OVERBOUGHT_COLOR = IMPRINT_PALETTE[5]  # matte red — semantic: reversal risk
const OVERSOLD_COLOR   = IMPRINT_PALETTE[3]  # blue — semantic: cool / opportunity

# Data — simulated daily closing prices over trading days (weekends skipped)
n_days = 141
start_date = Date(2024, 3, 1)
all_days = collect(start_date:Day(1):(start_date + Day(260)))
trading_days = filter(d -> dayofweek(d) <= 5, all_days)[1:n_days]

# Three drift regimes (rally, selloff, choppy recovery) so RSI visibly
# crosses both the overbought and oversold thresholds, not just the middle band.
prices = Vector{Float64}(undef, n_days)
prices[1] = 148.0
for i in 2:n_days
    drift = i <= 40 ? 0.55 : (i <= 75 ? -0.60 : 0.05)
    sigma = i <= 40 ? 0.9 : (i <= 75 ? 1.0 : 1.4)
    prices[i] = prices[i - 1] + randn() * sigma + drift
end

changes = diff(prices)
period = 14
gains = max.(changes, 0.0)
losses = max.(-changes, 0.0)

# Wilder's smoothing for the 14-period RSI
avg_gain = zeros(length(gains))
avg_loss = zeros(length(gains))
avg_gain[period] = mean(gains[1:period])
avg_loss[period] = mean(losses[1:period])
for i in (period + 1):length(gains)
    avg_gain[i] = (avg_gain[i - 1] * (period - 1) + gains[i]) / period
    avg_loss[i] = (avg_loss[i - 1] * (period - 1) + losses[i]) / period
end
rs = avg_gain ./ avg_loss
rsi_full = 100.0 .- 100.0 ./ (1.0 .+ rs)
rsi_values = rsi_full[(period + 1):end]
rsi_dates = trading_days[(period + 2):end]
x = 1:length(rsi_values)

# Plot
fig = Figure(
    resolution      = (1600, 900),
    fontsize        = 14,
    backgroundcolor = PAGE_BG,
)

ax = Axis(
    fig[1, 1];
    title             = "indicator-rsi · julia · makie · anyplot.ai",
    titlesize         = 20,
    titlecolor        = INK,
    xlabel            = "Trading Date",
    ylabel            = "RSI (14-period)",
    xlabelsize        = 14,
    ylabelsize        = 14,
    xlabelcolor       = INK,
    ylabelcolor       = INK,
    xticklabelsize    = 12,
    yticklabelsize    = 12,
    xticklabelcolor   = INK_SOFT,
    yticklabelcolor   = INK_SOFT,
    xtickcolor        = INK_SOFT,
    ytickcolor        = INK_SOFT,
    backgroundcolor   = PAGE_BG,
    topspinevisible   = false,
    rightspinevisible = false,
    leftspinecolor    = INK_SOFT,
    bottomspinecolor  = INK_SOFT,
    ygridcolor        = RGBAf(INK.r, INK.g, INK.b, 0.15),
    xgridvisible      = false,
    xticks            = (x[1:20:end], Dates.format.(rsi_dates[1:20:end], "u d")),
    xticklabelrotation = pi / 6,
    yticks            = ([0, 30, 50, 70, 100], ["0", "30", "50", "70", "100"]),
)

ylims!(ax, 0, 100)

# Overbought / oversold reference zones
hspan!(ax, 70, 100; color = RGBAf(OVERBOUGHT_COLOR.r, OVERBOUGHT_COLOR.g, OVERBOUGHT_COLOR.b, 0.12))
hspan!(ax, 0, 30; color = RGBAf(OVERSOLD_COLOR.r, OVERSOLD_COLOR.g, OVERSOLD_COLOR.b, 0.12))

# Threshold and centerline references
hlines!(ax, [70, 30]; color = INK_SOFT, linestyle = :dash, linewidth = 1.5)
hlines!(ax, [50]; color = INK_MUTED, linestyle = :dot, linewidth = 1.2)

# Alpha-blended fill from the centerline to the RSI line, reinforcing
# distance-from-neutral at a glance (band! fills between two curves).
band!(
    ax, x, min.(rsi_values, 50.0), max.(rsi_values, 50.0);
    color = RGBAf(RSI_COLOR.r, RSI_COLOR.g, RSI_COLOR.b, 0.15),
)

lines!(ax, x, rsi_values; color = RSI_COLOR, linewidth = 3)

# Data-aware label placement: anchor each zone label at the point of
# greatest vertical clearance from the RSI line within the opening window,
# rather than a fixed x[1] that could collide with the line for other seeds.
early_window = 1:max(1, round(Int, length(x) * 0.2))
ob_idx = early_window[argmin(rsi_values[early_window])]
os_idx = early_window[argmax(rsi_values[early_window])]

text!(ax, x[ob_idx], 96; text = "Overbought", color = INK_SOFT, fontsize = 12, align = (:left, :top))
text!(ax, x[os_idx], 4; text = "Oversold", color = INK_SOFT, fontsize = 12, align = (:left, :bottom))

# Save
save("plot-$(THEME).png", fig; px_per_unit = 2)
Runnable source as JSON, for any HTTP client: https://api.anyplot.ai/specs/indicator-rsi/makie/code. Any spec id and library id listed in llms-full.txt fit the same URL shape; every URL below is complete and callable.
{
  "spec_id": "indicator-rsi",
  "language": "julia",
  "library": "makie",
  "page": "https://anyplot.ai/indicator-rsi/julia/makie",
  "hub": "https://anyplot.ai/indicator-rsi",
  "code_json": "https://api.anyplot.ai/specs/indicator-rsi/makie/code",
  "spec_json": "https://api.anyplot.ai/specs/indicator-rsi",
  "render_light_png": "https://storage.googleapis.com/anyplot-images/plots/indicator-rsi/julia/makie/plot-light.png",
  "render_dark_png": "https://storage.googleapis.com/anyplot-images/plots/indicator-rsi/julia/makie/plot-dark.png",
  "quality_score": 93.0,
  "license": "MIT",
  "guide": "https://anyplot.ai/llms.txt"
}
Part of RSI Technical Indicator Chart on anyplot.ai.