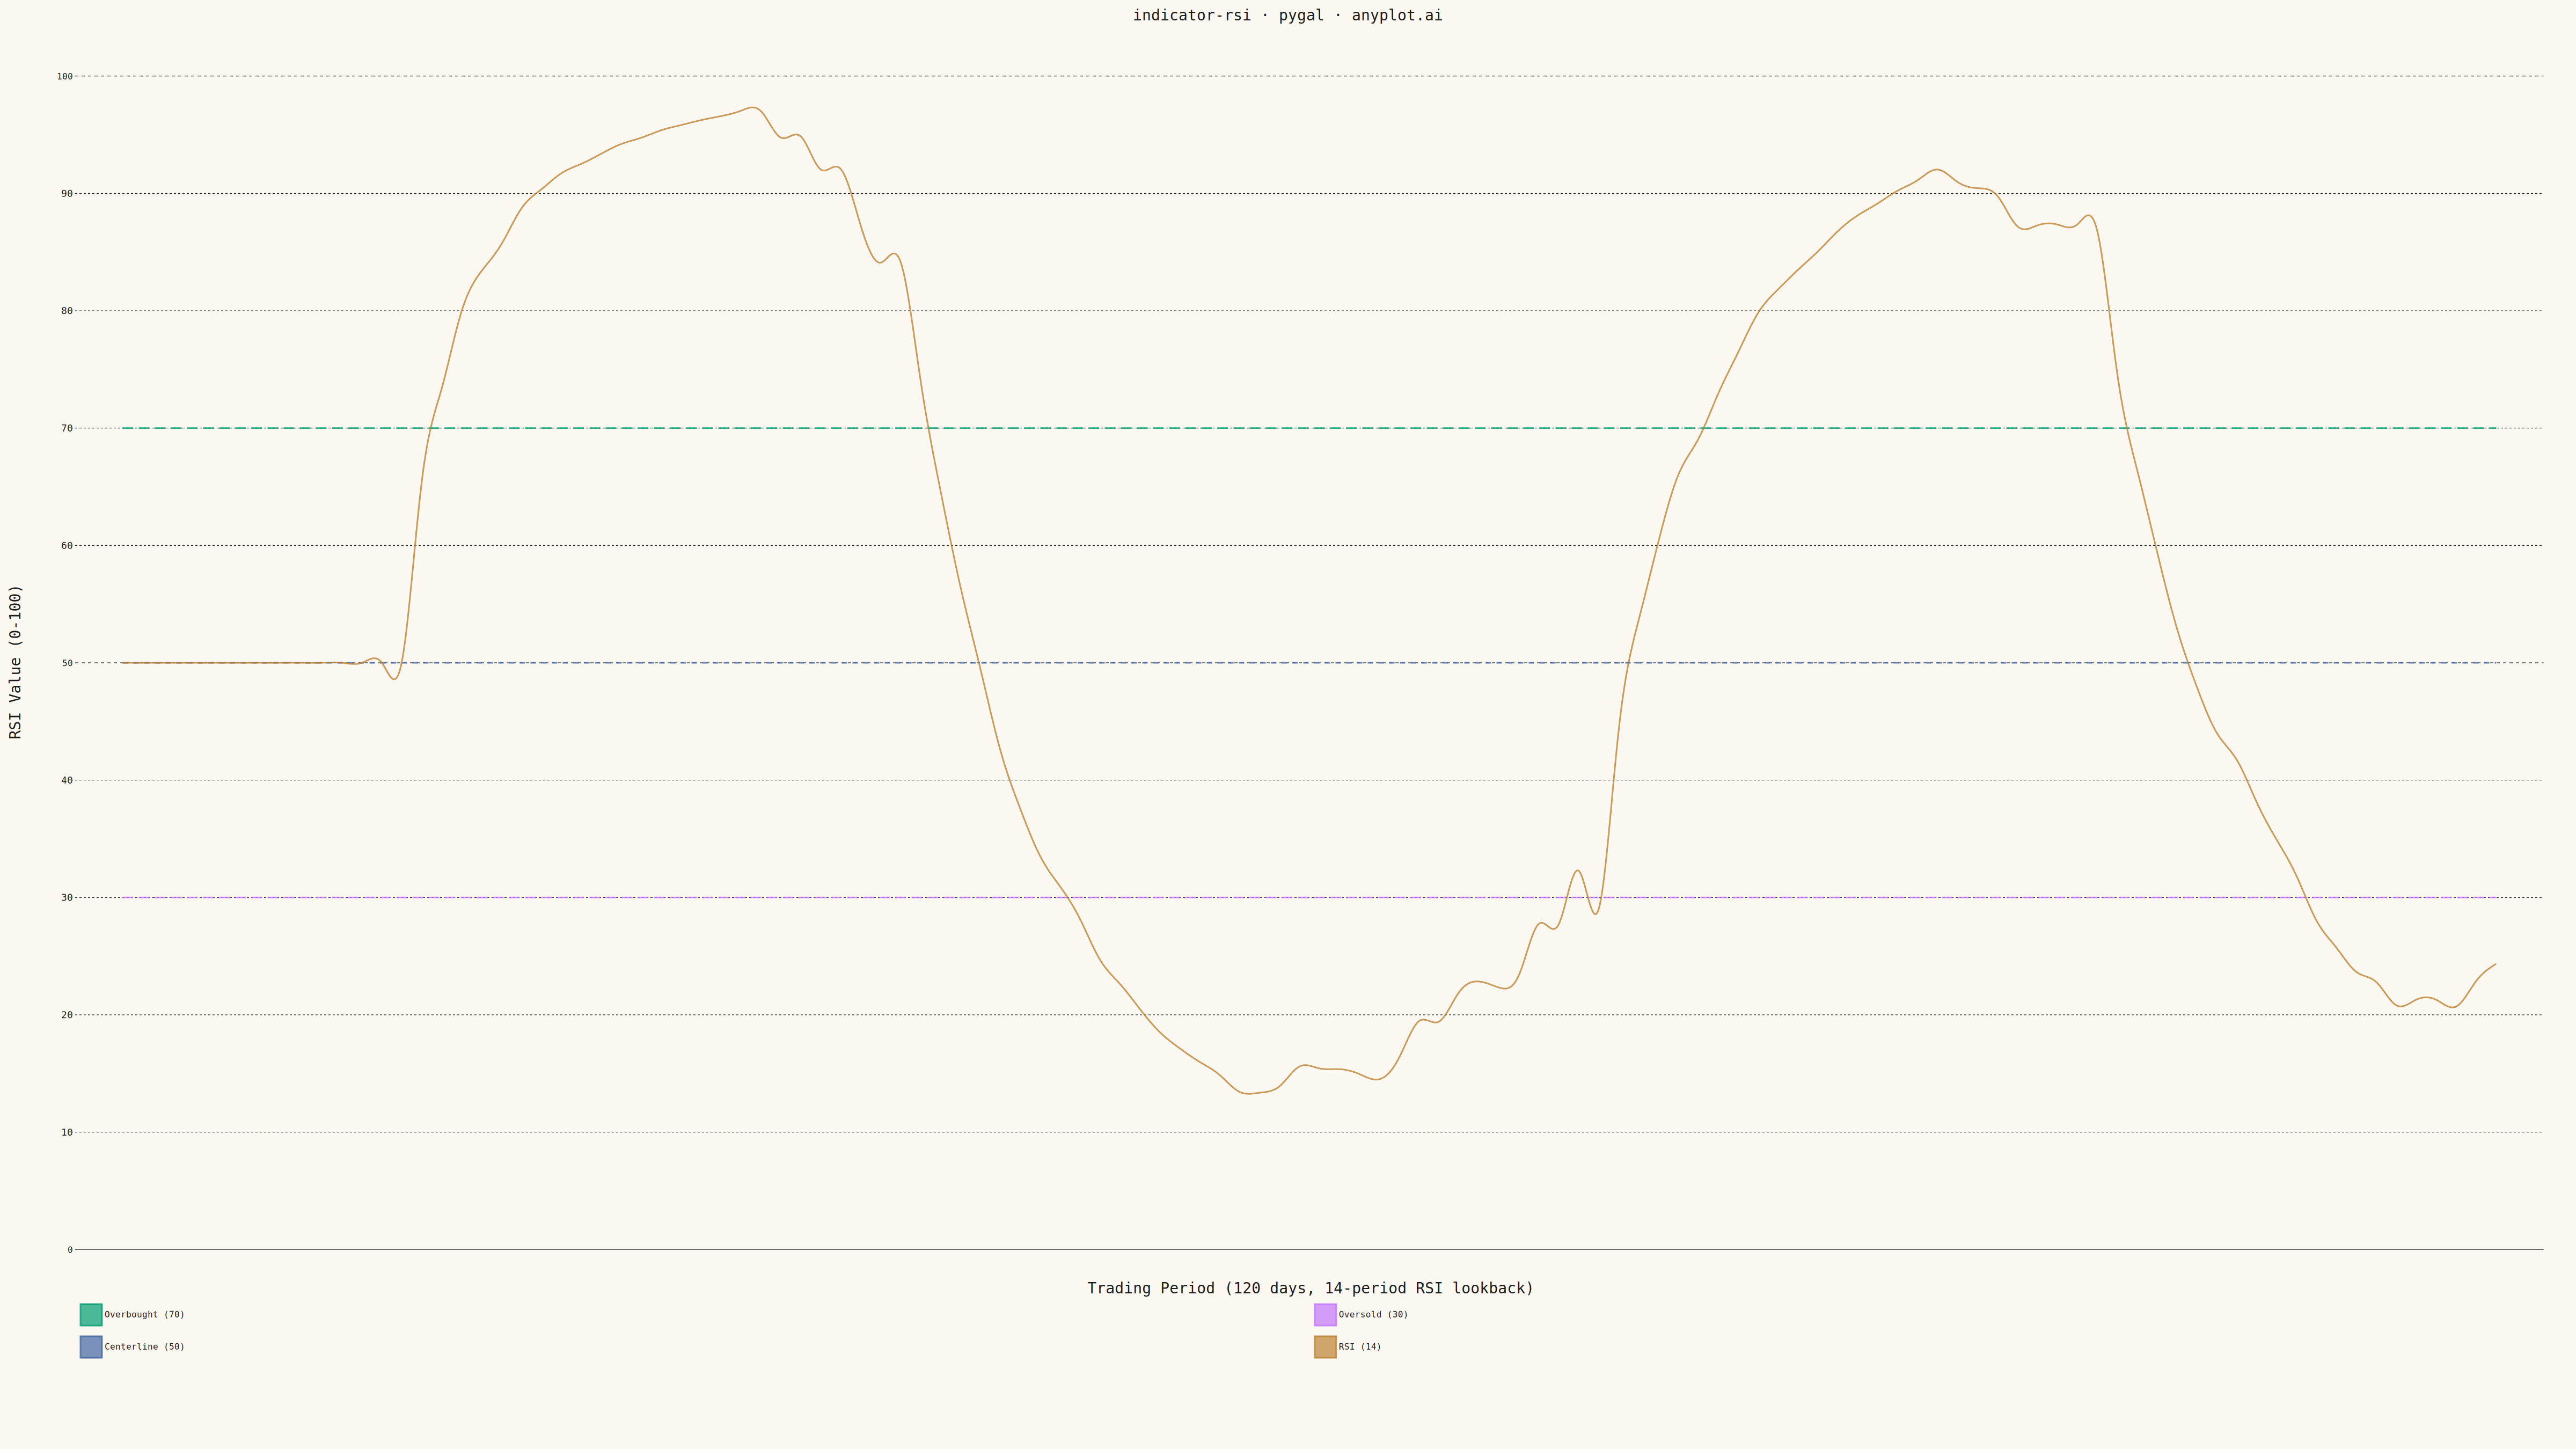
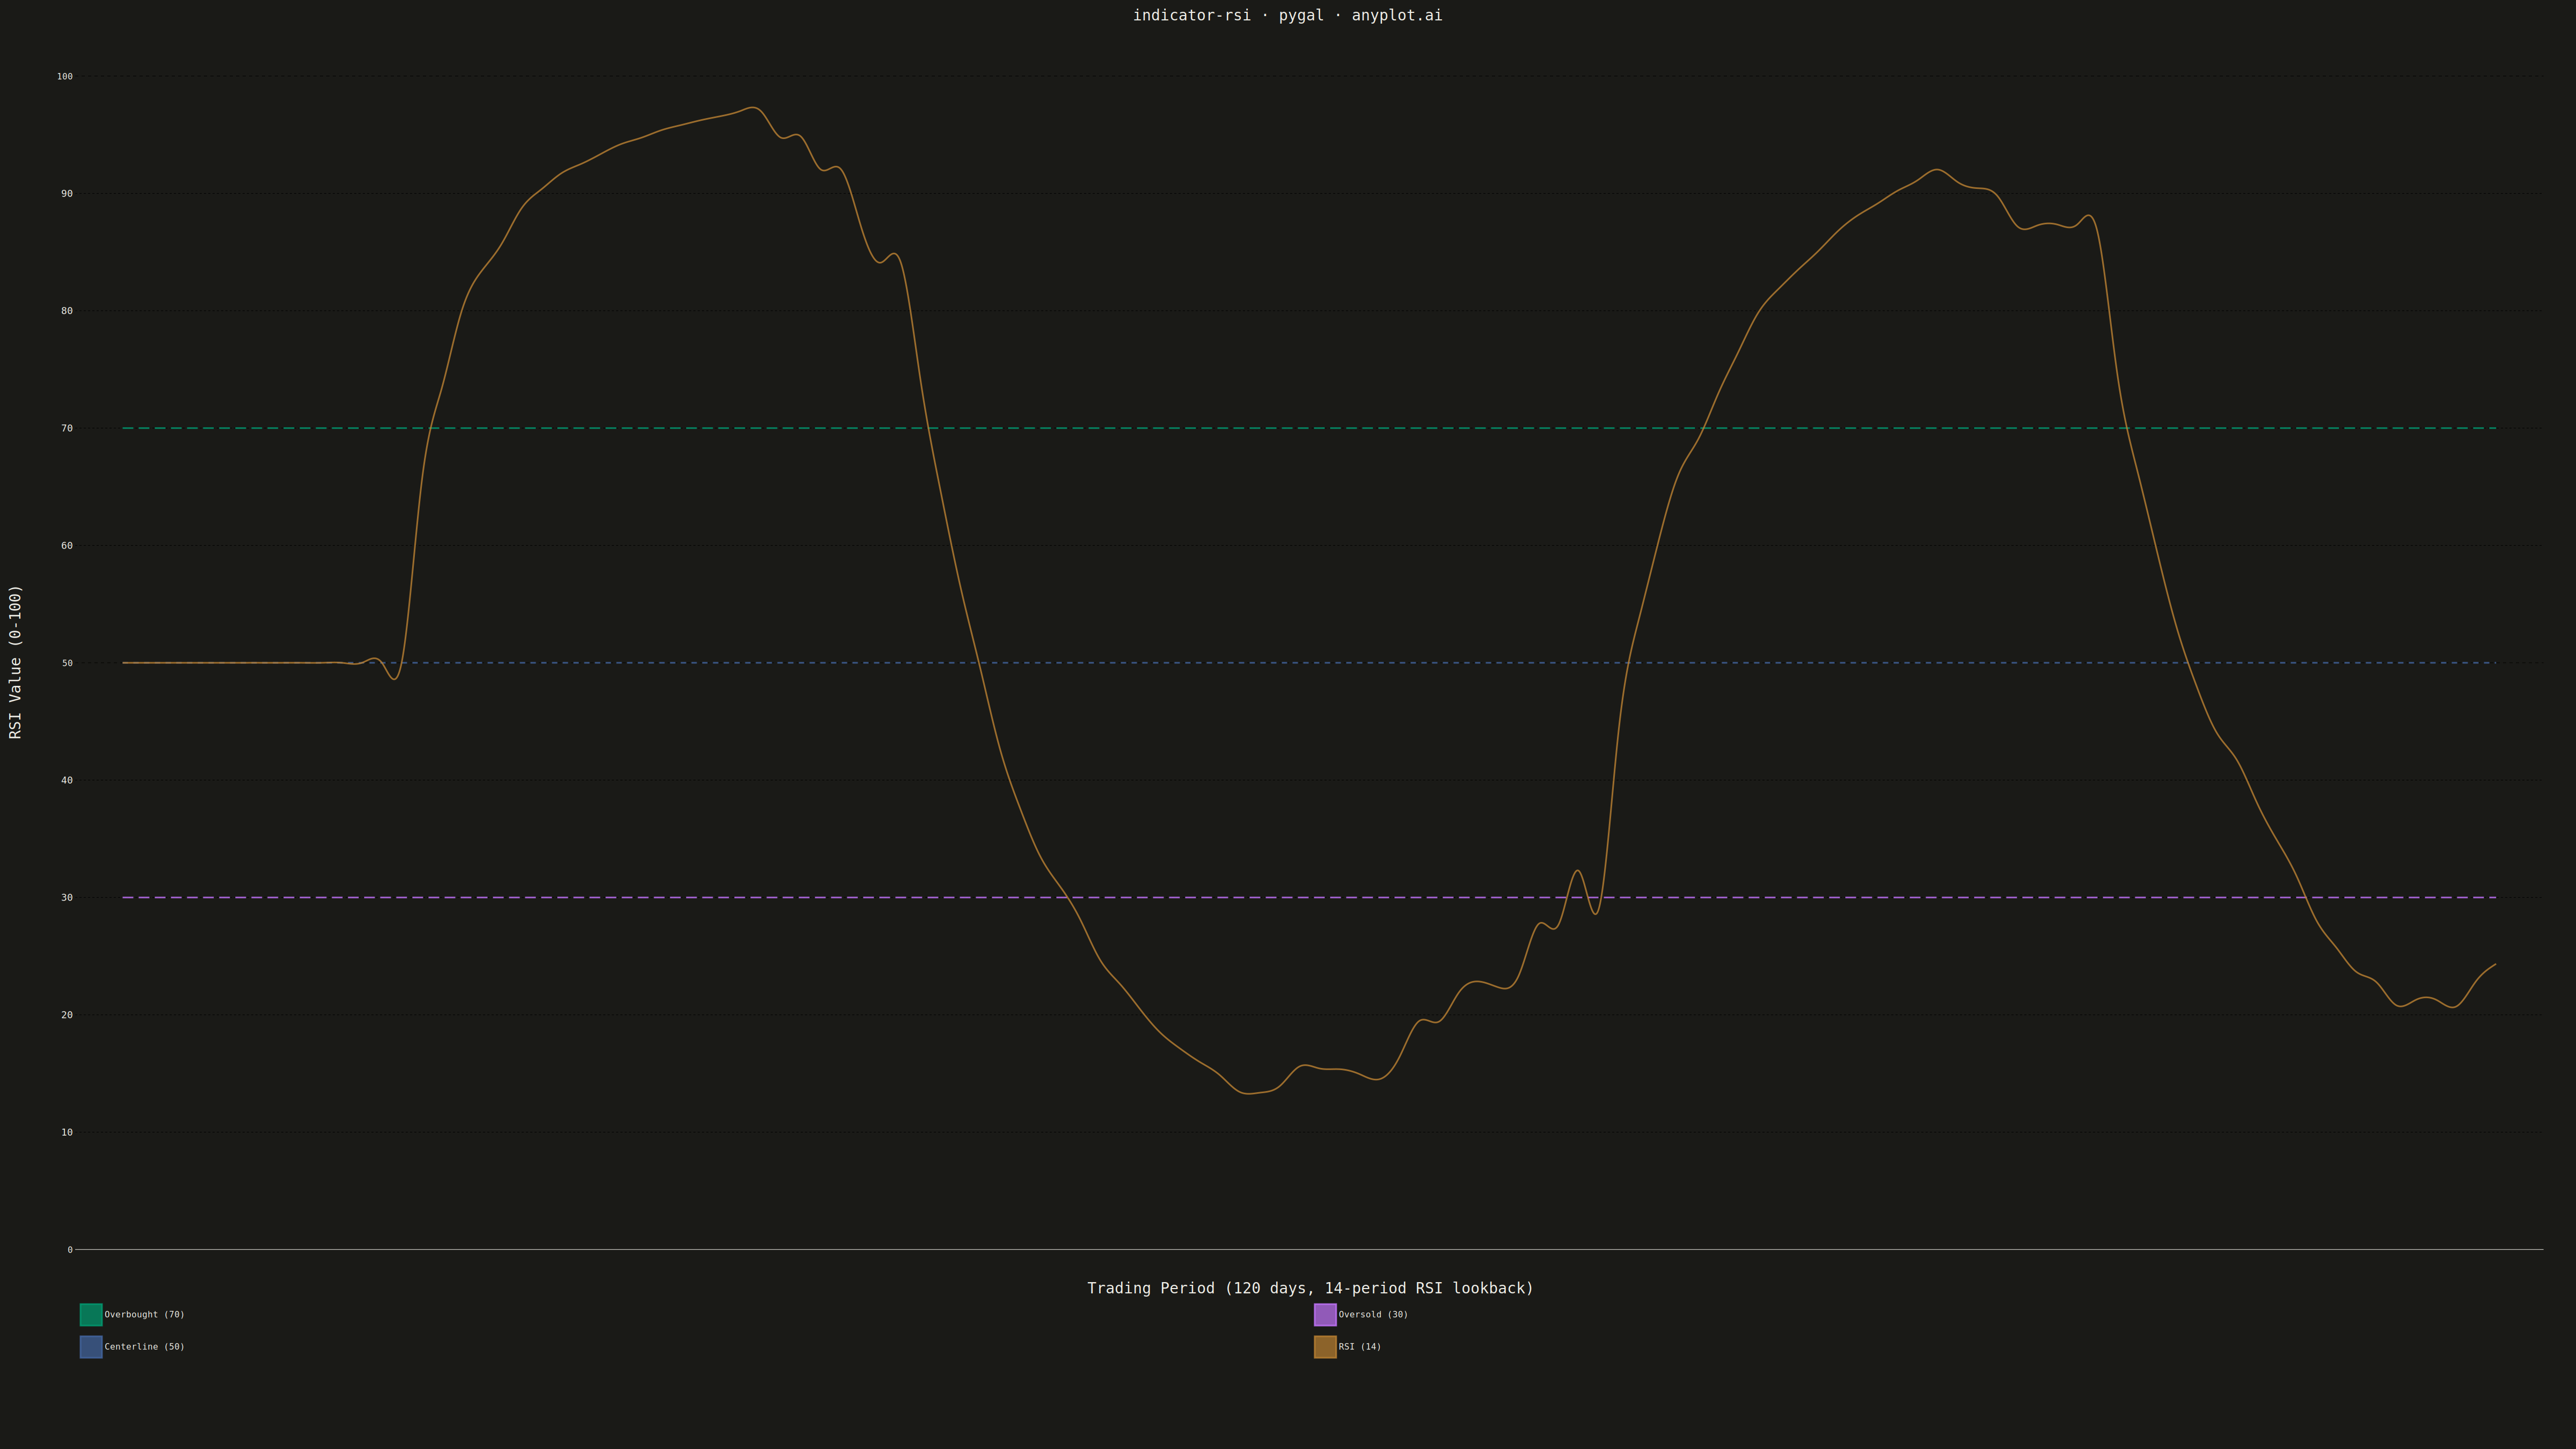
A Relative Strength Index (RSI) chart displaying the momentum oscillator on a 0-100 scale with horizontal threshold lines at 70 (overbought) and 30 (oversold). The RSI measures the speed and magnitude of recent price changes to evaluate overbought or oversold conditions. This is a fundamental momentum indicator in technical analysis, helping traders identify potential reversal points when the market reaches extreme conditions.
""" anyplot.ai
indicator-rsi: RSI Technical Indicator Chart
Library: pygal 3.1.0 | Python 3.13.13
Quality: 90/100 | Updated: 2026-05-16
"""

import os
import sys

import numpy as np


# Clear the local module from sys.modules if it was somehow loaded
if "pygal" in sys.modules and "implementations" in sys.modules["pygal"].__file__:
    del sys.modules["pygal"]

# Remove current directory from path to prevent local file from being imported
_original_path = sys.path[:]
sys.path = [p for p in sys.path if p not in ("", ".", os.getcwd())]

try:
    import pygal
    from pygal.style import Style
finally:
    # Restore path
    sys.path = _original_path

# Theme tokens
THEME = os.getenv("ANYPLOT_THEME", "light")
PAGE_BG = "#FAF8F1" if THEME == "light" else "#1A1A17"
INK = "#1A1A17" if THEME == "light" else "#F0EFE8"
INK_MUTED = "#6B6A63" if THEME == "light" else "#A8A79F"

# Data - Generate realistic RSI values over 120 trading days
np.random.seed(42)

n_days = 120
lookback = 14

# Generate price changes that produce RSI entering both overbought (>70) and oversold (<30) zones
base_changes = np.random.randn(n_days) * 0.8

# Strong uptrend periods (push RSI above 70)
base_changes[15:32] += 4.0
base_changes[75:92] += 4.5

# Strong downtrend periods (push RSI below 30)
base_changes[40:57] -= 4.0
base_changes[100:115] -= 3.5

price_changes = base_changes

# Calculate RSI using exponential moving average
gains = np.where(price_changes > 0, price_changes, 0)
losses = np.where(price_changes < 0, -price_changes, 0)

# Initialize EMA
avg_gain = np.zeros(n_days)
avg_loss = np.zeros(n_days)

# First average
avg_gain[lookback - 1] = np.mean(gains[:lookback])
avg_loss[lookback - 1] = np.mean(losses[:lookback])

# EMA for subsequent values
alpha = 1 / lookback
for i in range(lookback, n_days):
    avg_gain[i] = alpha * gains[i] + (1 - alpha) * avg_gain[i - 1]
    avg_loss[i] = alpha * losses[i] + (1 - alpha) * avg_loss[i - 1]

# Calculate RSI (avoid division by zero)
with np.errstate(divide="ignore", invalid="ignore"):
    rs = np.divide(avg_gain, avg_loss, out=np.full_like(avg_gain, 100.0), where=avg_loss > 0)
rsi = 100 - (100 / (1 + rs))
rsi[:lookback] = 50

# Okabe-Ito palette with brand green as first series
IMPRINT = ("#009E73", "#C475FD", "#4467A3", "#BD8233", "#AE3030", "#2ABCCD", "#954477")

# Custom style for theme-adaptive rendering
custom_style = Style(
    background=PAGE_BG,
    plot_background=PAGE_BG,
    foreground=INK,
    foreground_strong=INK,
    foreground_subtle=INK_MUTED,
    colors=IMPRINT,
    title_font_size=28,
    label_font_size=18,
    major_label_font_size=16,
    legend_font_size=16,
    value_font_size=14,
    stroke_width=3,
)

# Create chart
chart = pygal.Line(
    width=4800,
    height=2700,
    style=custom_style,
    title="indicator-rsi · pygal · anyplot.ai",
    x_title="Trading Period (120 days, 14-period RSI lookback)",
    y_title="RSI Value (0-100)",
    show_dots=False,
    show_x_guides=False,
    show_y_guides=True,
    range=(0, 100),
    interpolate="cubic",
    legend_at_bottom=True,
    legend_box_size=40,
    margin=60,
    margin_bottom=180,
    show_x_labels=False,
)

# Add threshold lines with colorblind-safe styling
overbought_line = [70] * n_days
oversold_line = [30] * n_days
centerline = [50] * n_days

# Overbought threshold (using Okabe-Ito position 2 - vermillion)
chart.add("Overbought (70)", overbought_line, stroke_style={"width": 4, "dasharray": "20,10"}, show_dots=False)

# Oversold threshold (using Okabe-Ito position 3 - blue)
chart.add("Oversold (30)", oversold_line, stroke_style={"width": 4, "dasharray": "20,10"}, show_dots=False)

# Centerline (using muted ink color)
chart.add("Centerline (50)", centerline, stroke_style={"width": 2, "dasharray": "10,10"}, show_dots=False)

# Add RSI data last so it appears on top with thicker line (brand green - first series)
chart.add("RSI (14)", list(rsi), stroke_style={"width": 6}, show_dots=False)

# Save as PNG and HTML with theme-suffixed filenames
chart.render_to_png(f"plot-{THEME}.png")
with open(f"plot-{THEME}.html", "wb") as f:
    f.write(chart.render())
Runnable source as JSON, for any HTTP client: https://api.anyplot.ai/specs/indicator-rsi/pygal/code. Any spec id and library id listed in llms-full.txt fit the same URL shape; every URL below is complete and callable.
{
  "spec_id": "indicator-rsi",
  "language": "python",
  "library": "pygal",
  "page": "https://anyplot.ai/indicator-rsi/python/pygal",
  "hub": "https://anyplot.ai/indicator-rsi",
  "code_json": "https://api.anyplot.ai/specs/indicator-rsi/pygal/code",
  "spec_json": "https://api.anyplot.ai/specs/indicator-rsi",
  "render_light_png": "https://storage.googleapis.com/anyplot-images/plots/indicator-rsi/python/pygal/plot-light.png",
  "render_dark_png": "https://storage.googleapis.com/anyplot-images/plots/indicator-rsi/python/pygal/plot-dark.png",
  "interactive_light_html": "https://storage.googleapis.com/anyplot-images/plots/indicator-rsi/python/pygal/plot-light.html",
  "interactive_dark_html": "https://storage.googleapis.com/anyplot-images/plots/indicator-rsi/python/pygal/plot-dark.html",
  "quality_score": 90.0,
  "license": "MIT",
  "guide": "https://anyplot.ai/llms.txt"
}
Part of RSI Technical Indicator Chart on anyplot.ai.