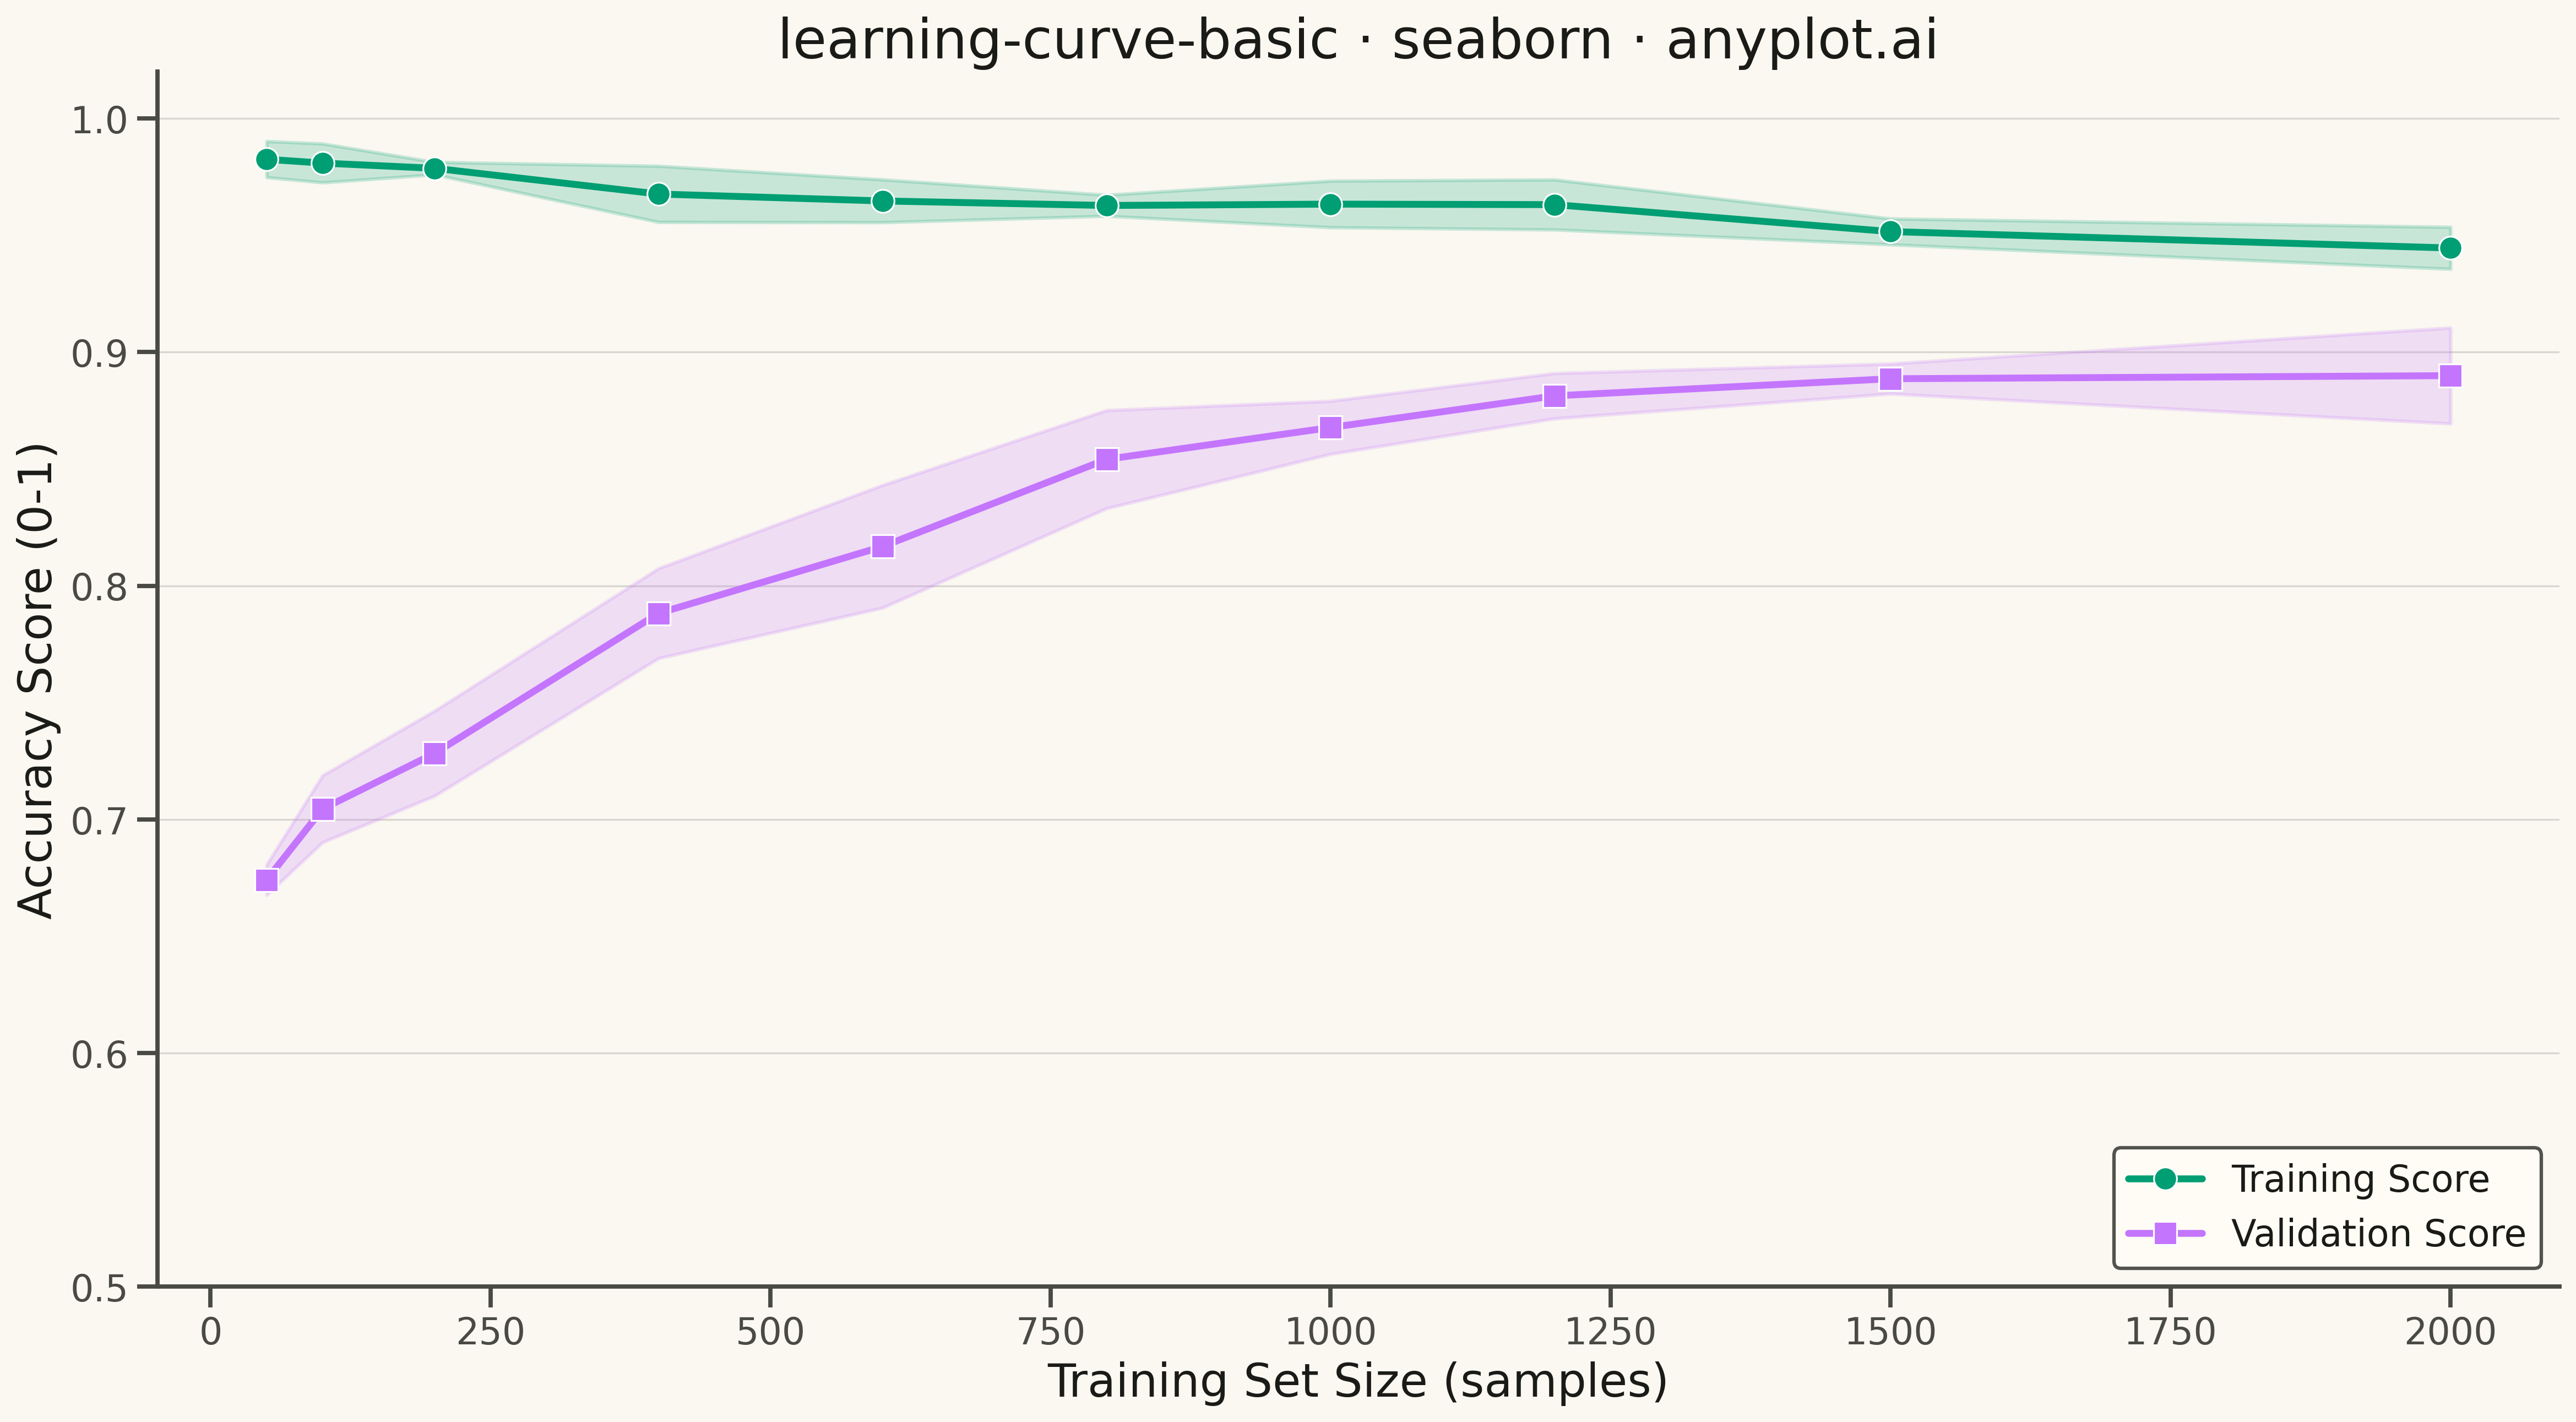
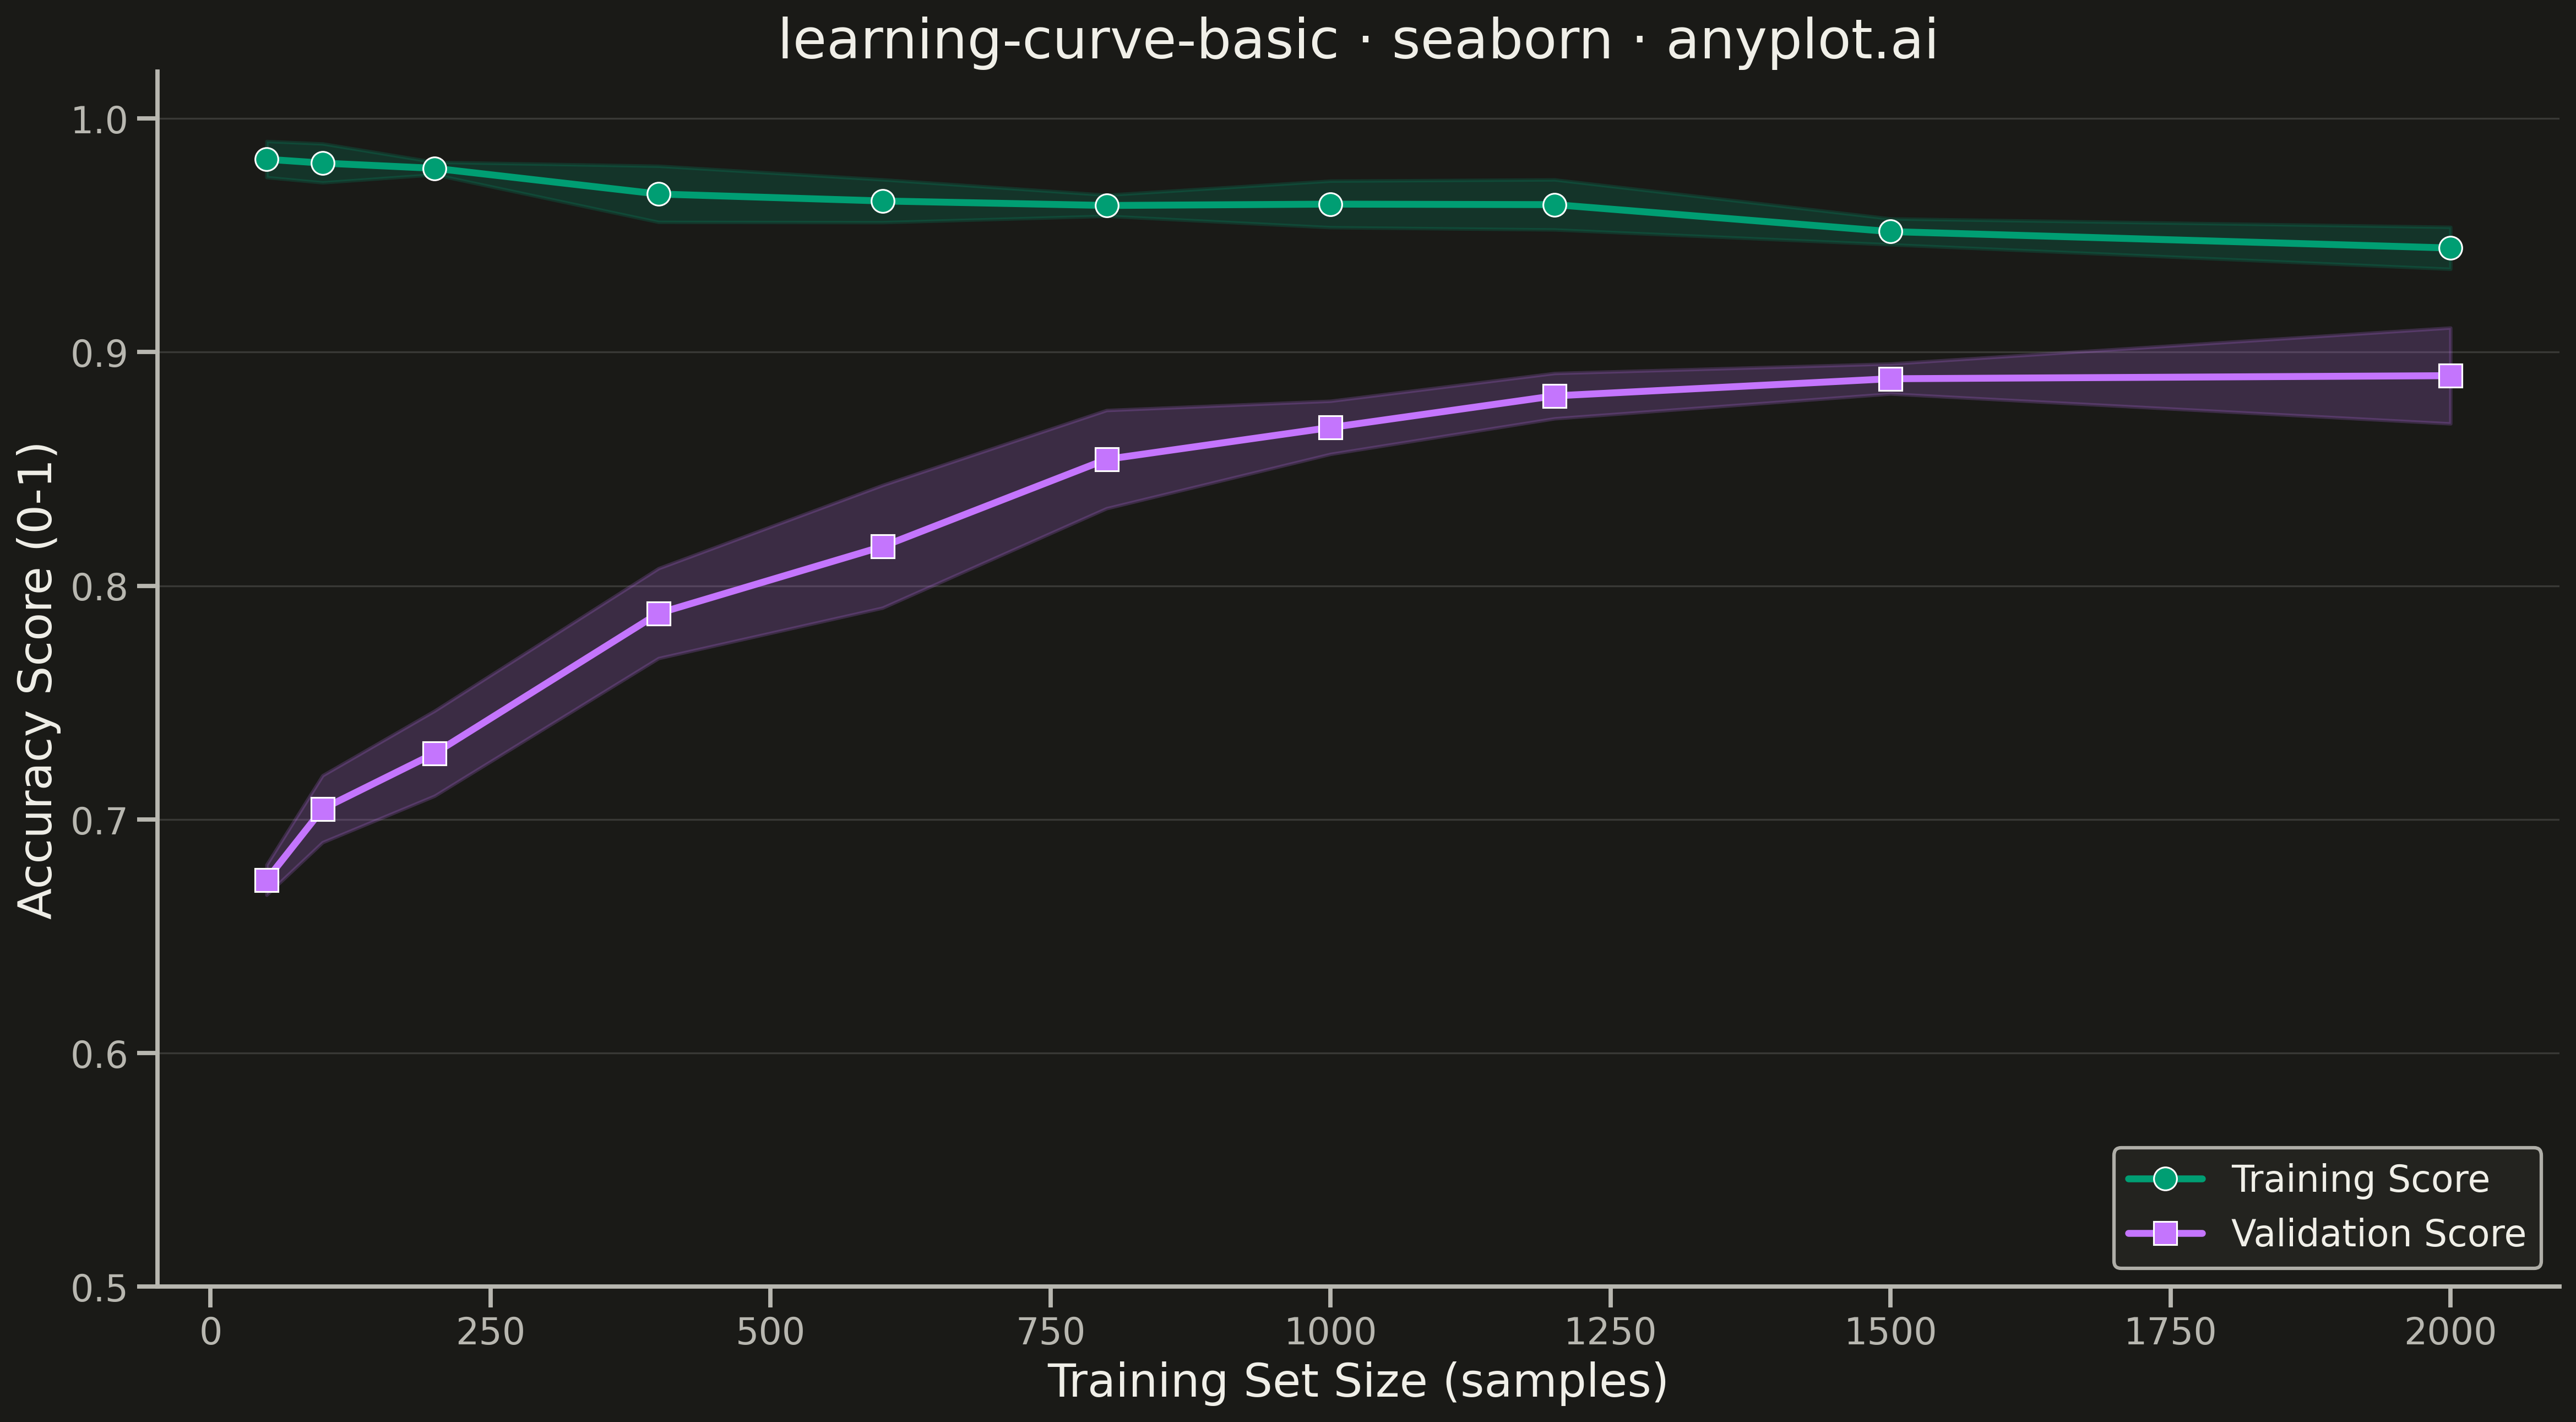
A learning curve visualizes model performance (training and validation scores) as a function of training set size. It is essential for diagnosing bias vs variance tradeoffs, determining whether collecting more data would improve model performance, and guiding model selection decisions. The plot typically shows two lines with shaded confidence bands representing variability across cross-validation folds.
Preview render from the Seaborn implementation.