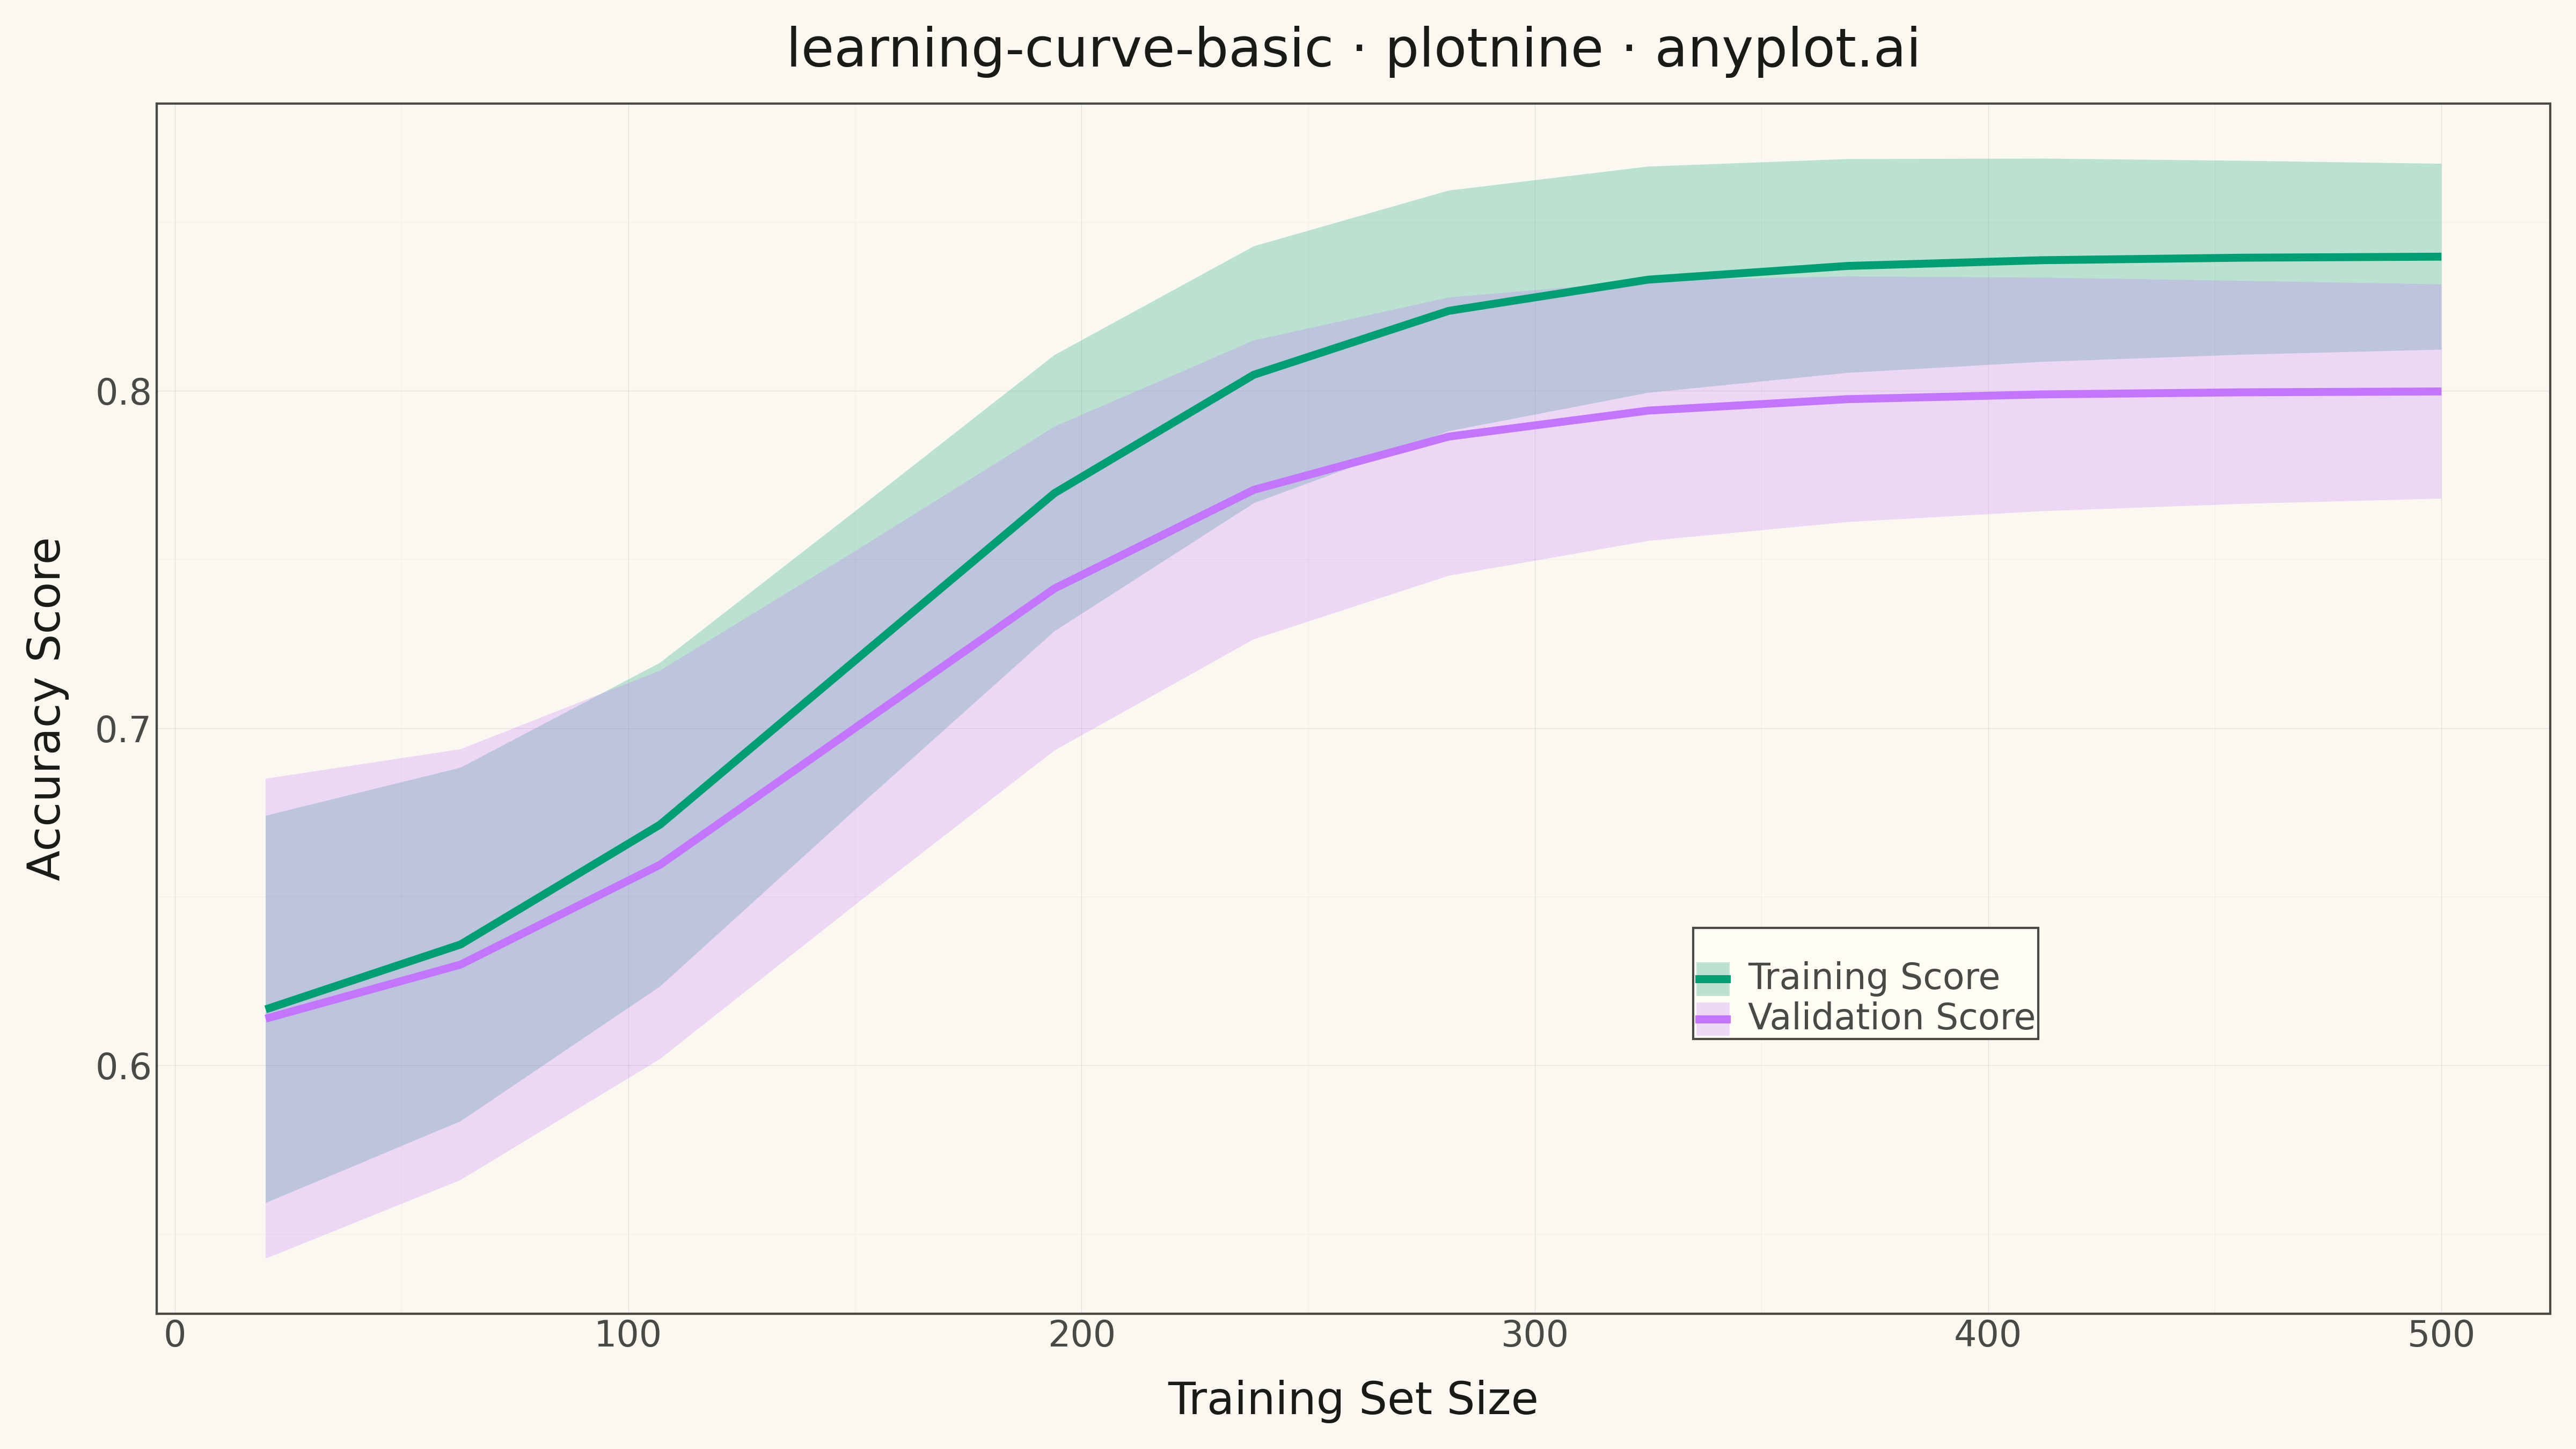
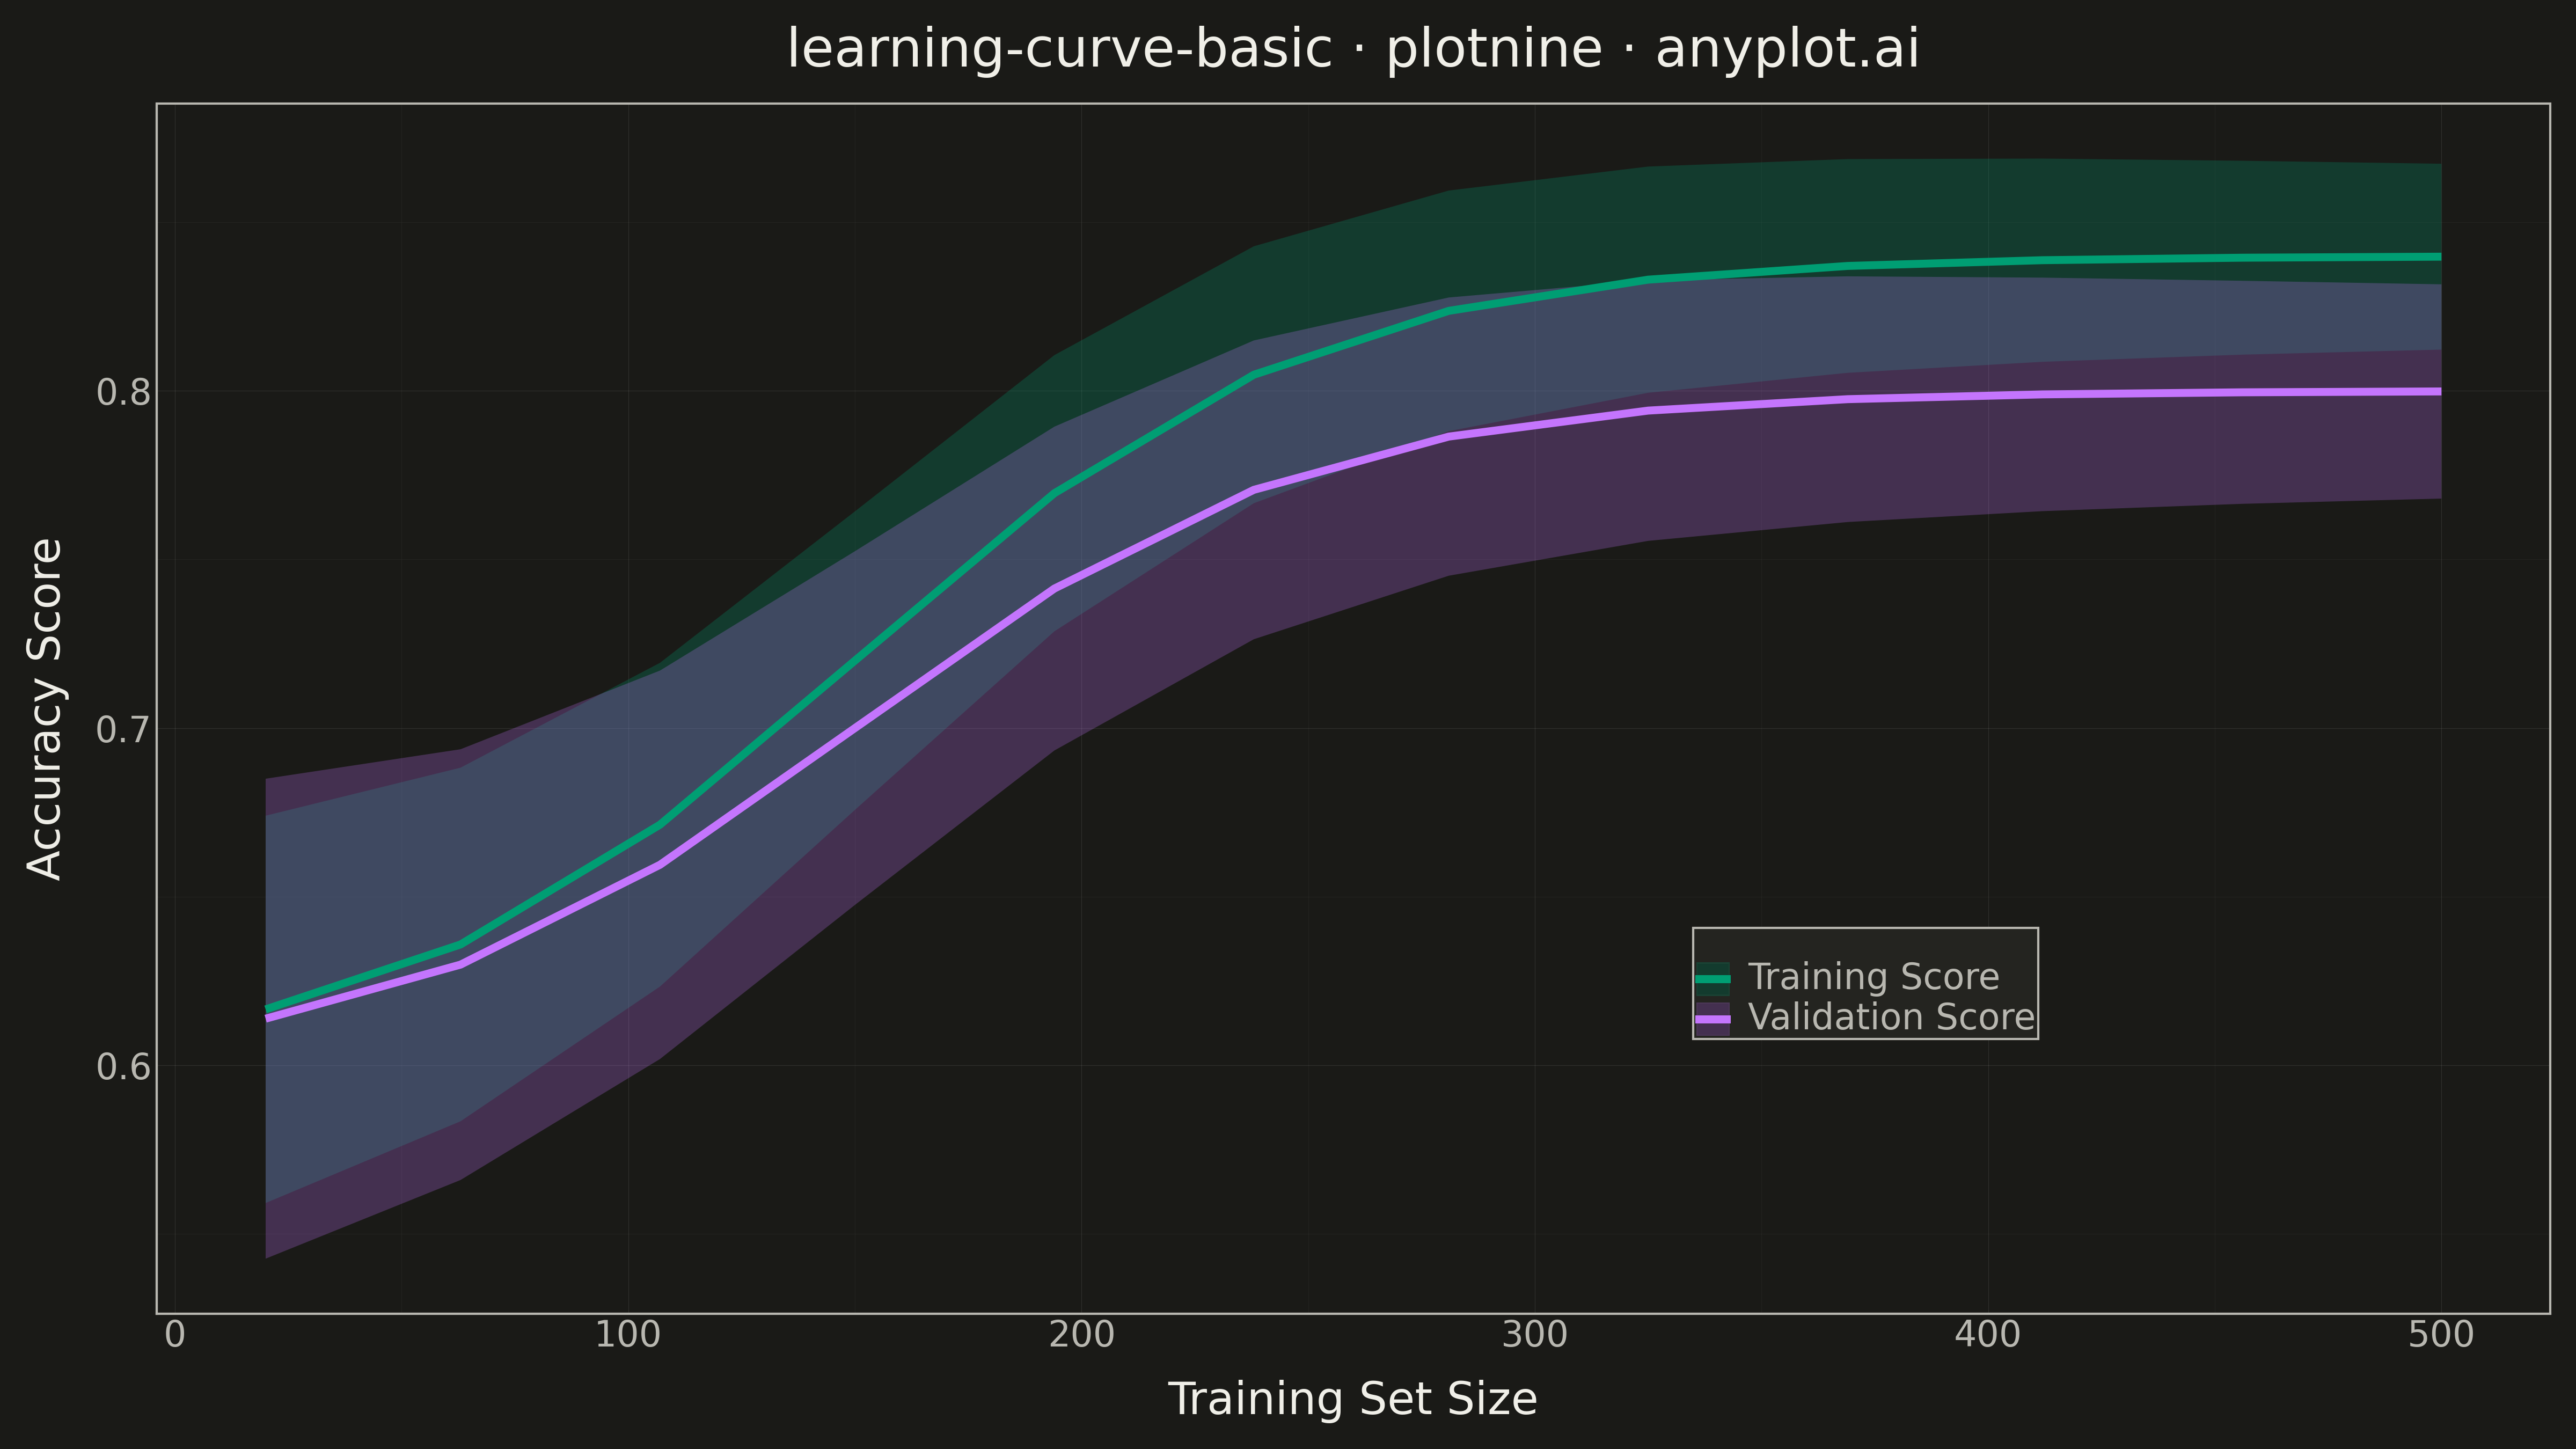
A learning curve visualizes model performance (training and validation scores) as a function of training set size. It is essential for diagnosing bias vs variance tradeoffs, determining whether collecting more data would improve model performance, and guiding model selection decisions. The plot typically shows two lines with shaded confidence bands representing variability across cross-validation folds.
""" anyplot.ai
learning-curve-basic: Model Learning Curve
Library: plotnine 0.15.4 | Python 3.13.13
Quality: 91/100 | Updated: 2026-05-10
"""

import os

import numpy as np
import pandas as pd
from plotnine import (
    aes,
    element_line,
    element_rect,
    element_text,
    geom_line,
    geom_ribbon,
    ggplot,
    ggsave,
    labs,
    scale_color_manual,
    scale_fill_manual,
    theme,
    theme_minimal,
)


# Theme tokens
THEME = os.getenv("ANYPLOT_THEME", "light")
PAGE_BG = "#FAF8F1" if THEME == "light" else "#1A1A17"
ELEVATED_BG = "#FFFDF6" if THEME == "light" else "#242420"
INK = "#1A1A17" if THEME == "light" else "#F0EFE8"
INK_SOFT = "#4A4A44" if THEME == "light" else "#B8B7B0"

# Okabe-Ito palette
IMPRINT = ["#009E73", "#C475FD", "#4467A3", "#BD8233", "#AE3030", "#2ABCCD", "#954477"]

# Data - Underfitting scenario with different seed and pattern
np.random.seed(123)

# Training set sizes (12 points from 20 to 500 samples)
train_sizes = np.linspace(20, 500, 12).astype(int)

# Underfitting pattern: both curves start low and plateau together
# This shows a model that cannot achieve high accuracy even with more data
train_mean = 0.72 + 0.12 * np.tanh((train_sizes - 150) / 100)
train_std = 0.04 * np.exp(-train_sizes / 300) + 0.02

# Validation scores follow training more closely (underfitting signature)
# Small gap between train and validation
val_mean = 0.70 + 0.10 * np.tanh((train_sizes - 150) / 100)
val_std = 0.05 * np.exp(-train_sizes / 250) + 0.025

# Create DataFrame for plotting
df_train = pd.DataFrame(
    {
        "Training Set Size": train_sizes,
        "Score": train_mean,
        "Score_low": np.maximum(0, train_mean - train_std),
        "Score_high": np.minimum(1, train_mean + train_std),
        "Type": "Training Score",
    }
)

df_val = pd.DataFrame(
    {
        "Training Set Size": train_sizes,
        "Score": val_mean,
        "Score_low": np.maximum(0, val_mean - val_std),
        "Score_high": np.minimum(1, val_mean + val_std),
        "Type": "Validation Score",
    }
)

df = pd.concat([df_train, df_val], ignore_index=True)

# Colors: Okabe-Ito brand green for training, second color for validation
colors = {"Training Score": IMPRINT[0], "Validation Score": IMPRINT[1]}

# Custom theme
anyplot_theme = theme(
    plot_background=element_rect(fill=PAGE_BG, color=PAGE_BG),
    panel_background=element_rect(fill=PAGE_BG),
    panel_grid_major=element_line(color=INK, size=0.3, alpha=0.10),
    panel_grid_minor=element_line(color=INK, size=0.2, alpha=0.05),
    panel_border=element_rect(color=INK_SOFT, fill=None),
    axis_title=element_text(color=INK, size=20),
    axis_text=element_text(color=INK_SOFT, size=16),
    axis_line=element_line(color=INK_SOFT),
    plot_title=element_text(color=INK, size=24),
    legend_background=element_rect(fill=ELEVATED_BG, color=INK_SOFT),
    legend_text=element_text(color=INK_SOFT, size=16),
    legend_title=element_text(color=INK),
    figure_size=(16, 9),
    legend_position=(0.75, 0.25),
)

# Create plot
plot = (
    ggplot(df, aes(x="Training Set Size", y="Score", color="Type", fill="Type"))
    + geom_ribbon(aes(ymin="Score_low", ymax="Score_high"), alpha=0.25, color="none")
    + geom_line(size=2)
    + scale_color_manual(values=colors)
    + scale_fill_manual(values=colors)
    + labs(
        x="Training Set Size",
        y="Accuracy Score",
        title="learning-curve-basic · plotnine · anyplot.ai",
        color="",
        fill="",
    )
    + theme_minimal()
    + anyplot_theme
)

# Save
ggsave(plot, f"plot-{THEME}.png", dpi=300, width=16, height=9)
Runnable source as JSON, for any HTTP client: https://api.anyplot.ai/specs/learning-curve-basic/plotnine/code. Any spec id and library id listed in llms-full.txt fit the same URL shape; every URL below is complete and callable.
{
  "spec_id": "learning-curve-basic",
  "language": "python",
  "library": "plotnine",
  "page": "https://anyplot.ai/learning-curve-basic/python/plotnine",
  "hub": "https://anyplot.ai/learning-curve-basic",
  "code_json": "https://api.anyplot.ai/specs/learning-curve-basic/plotnine/code",
  "spec_json": "https://api.anyplot.ai/specs/learning-curve-basic",
  "render_light_png": "https://storage.googleapis.com/anyplot-images/plots/learning-curve-basic/python/plotnine/plot-light.png",
  "render_dark_png": "https://storage.googleapis.com/anyplot-images/plots/learning-curve-basic/python/plotnine/plot-dark.png",
  "quality_score": 91.0,
  "license": "MIT",
  "guide": "https://anyplot.ai/llms.txt"
}
Part of Model Learning Curve on anyplot.ai.