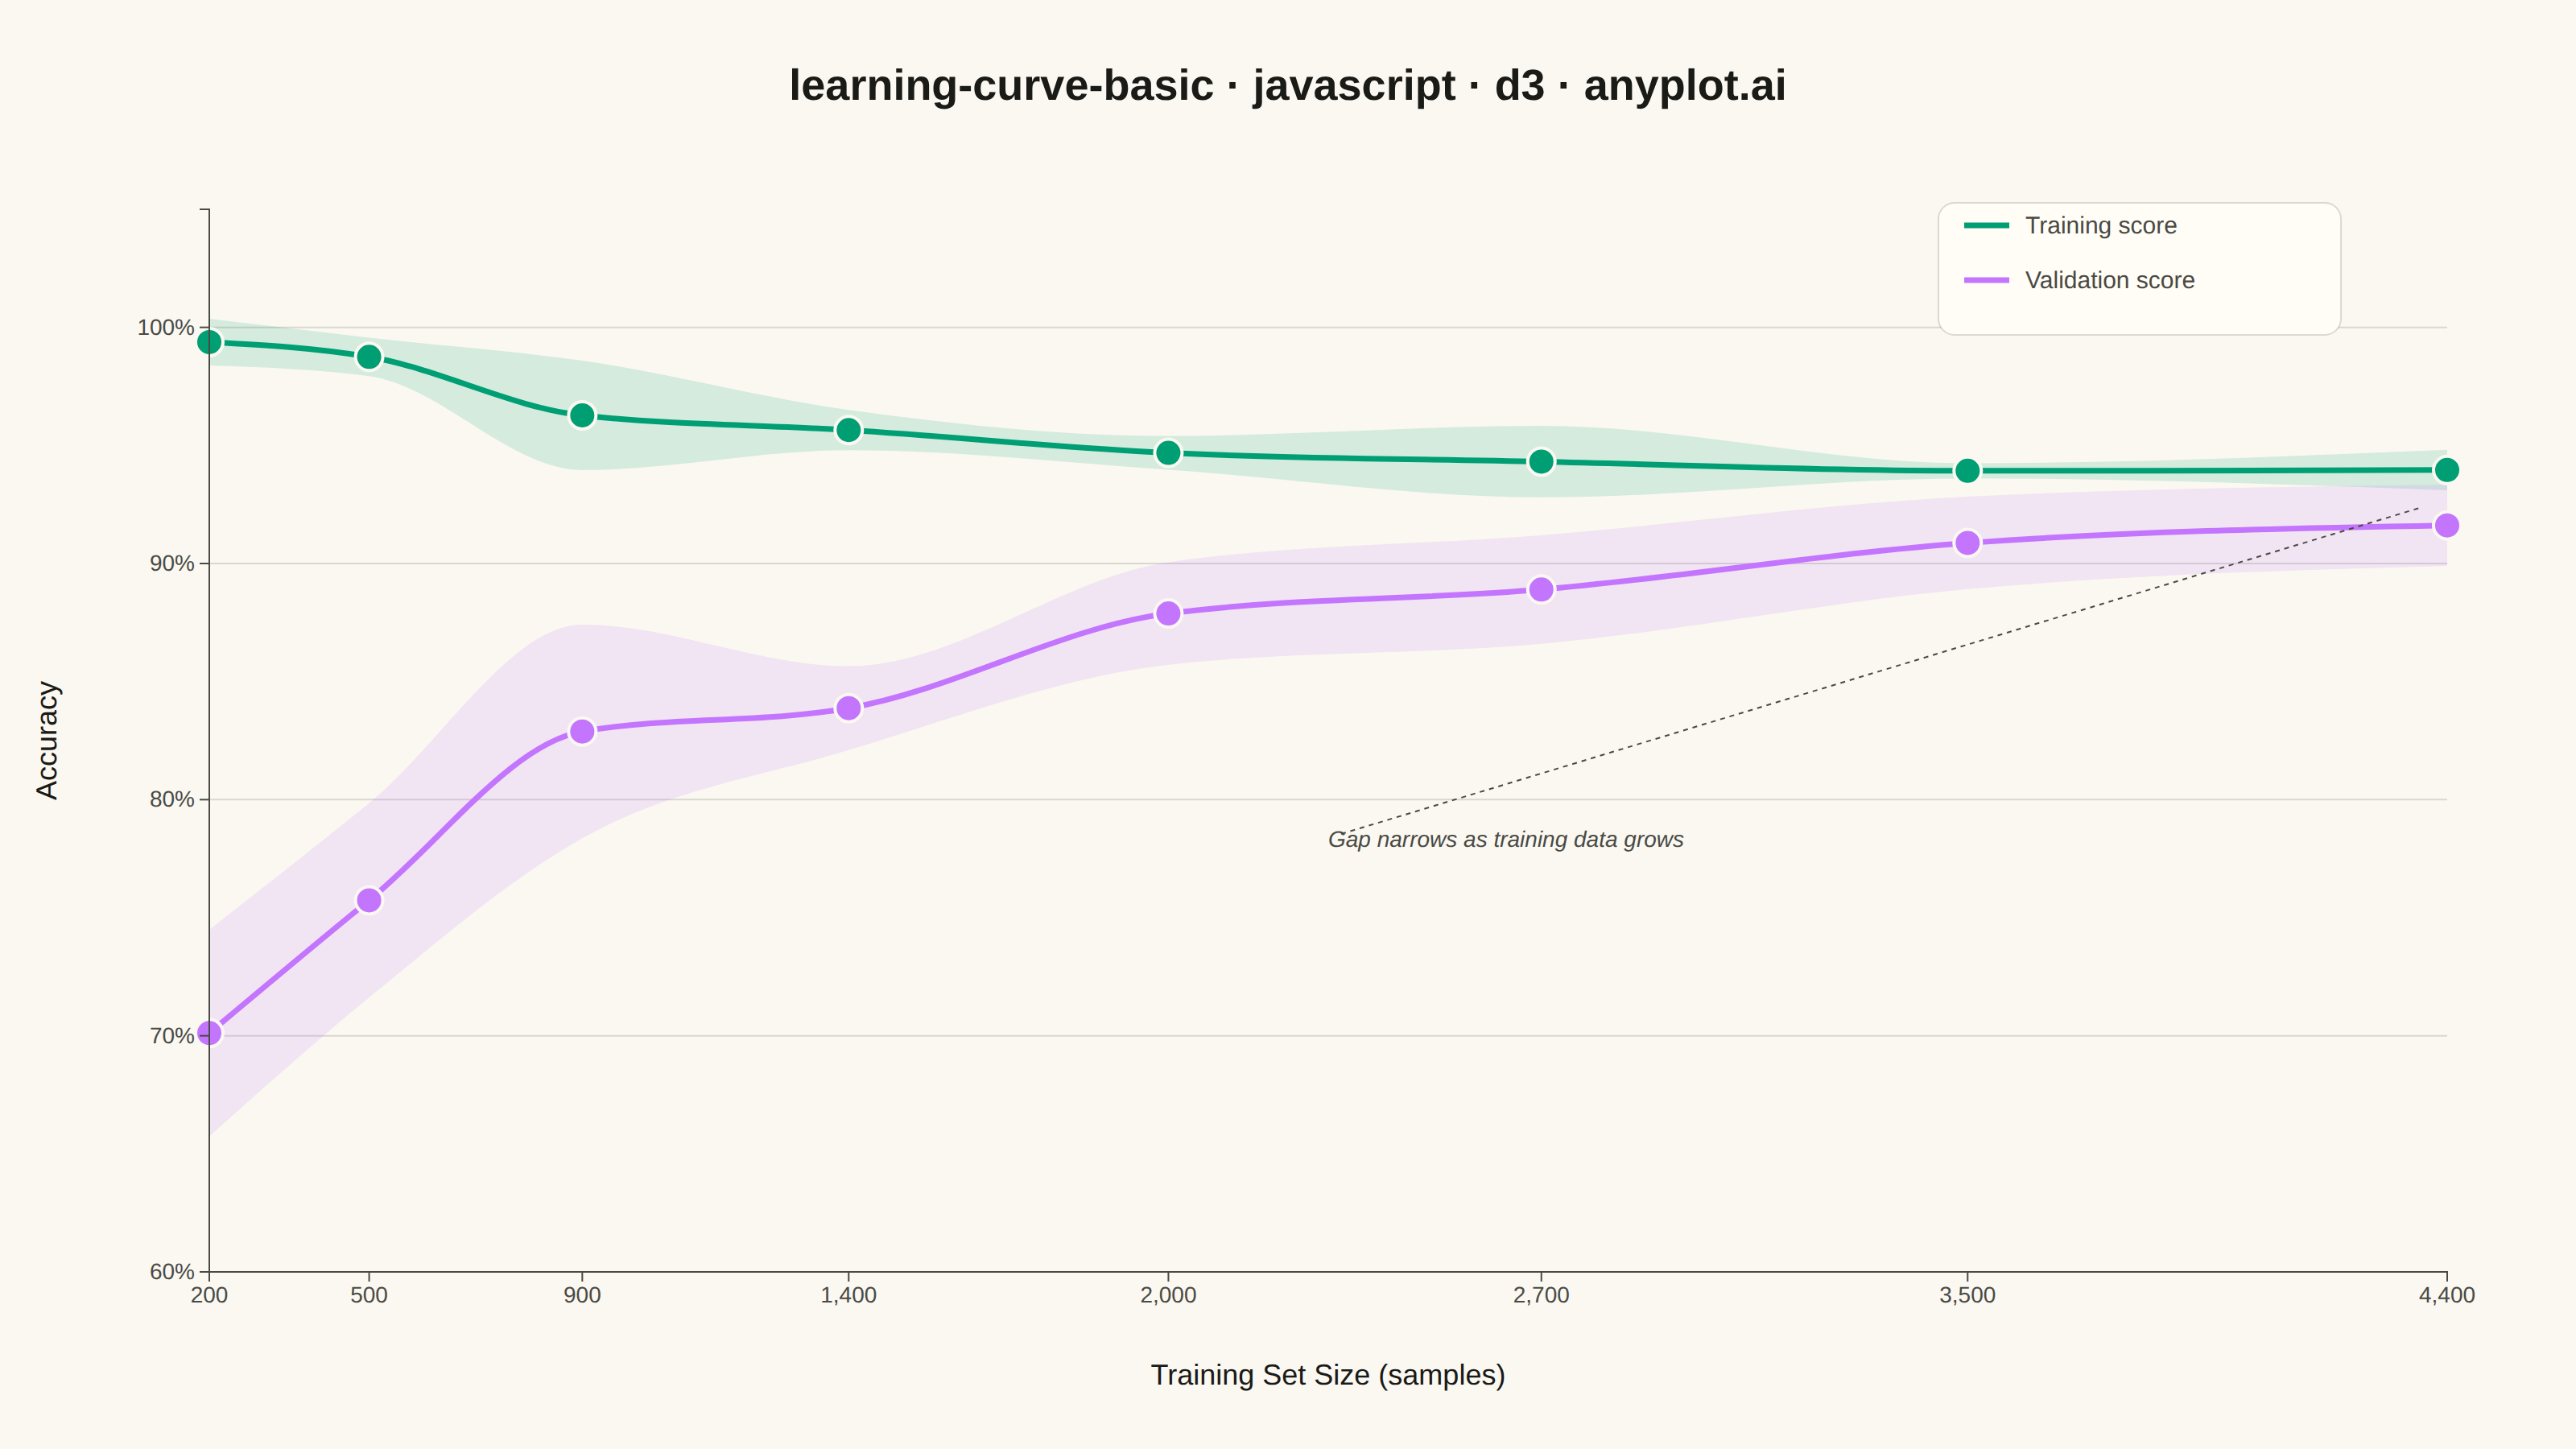
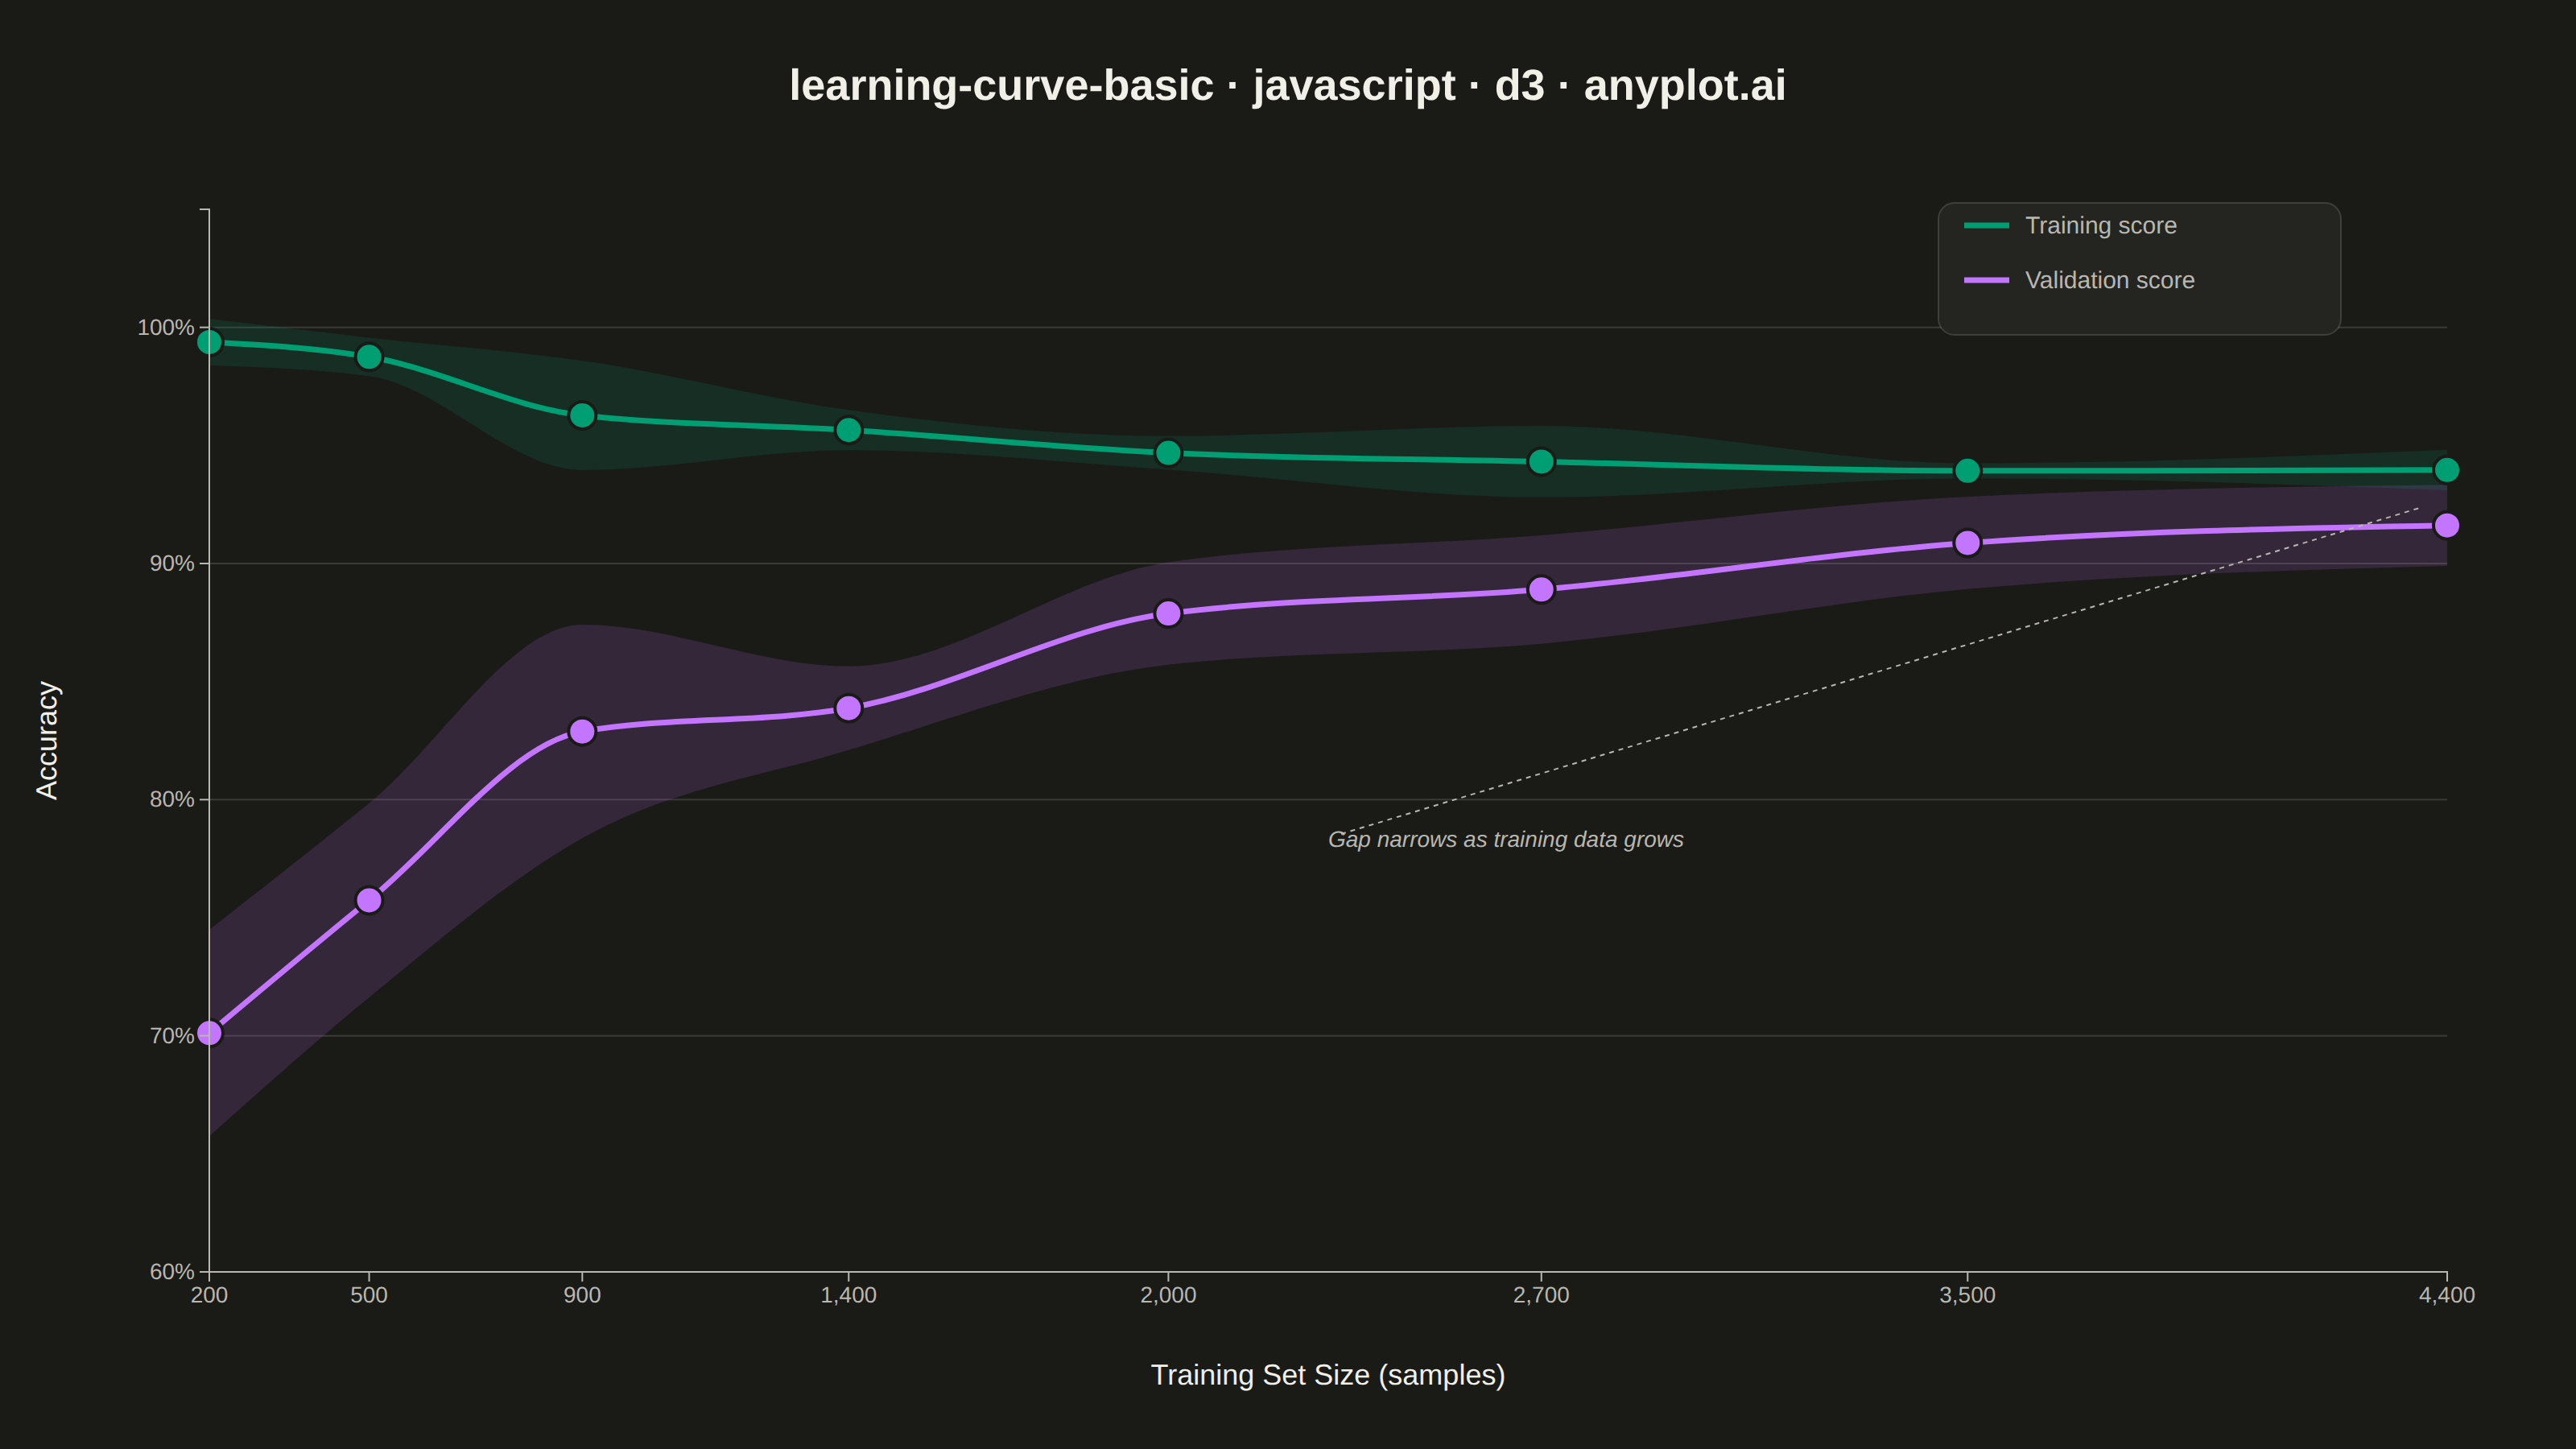
The same plot in 14 other libraries — JavaScript: Chart.js, Apache ECharts, Highcharts, MUI X Charts; Python: Altair, Bokeh, lets-plot, Matplotlib, Plotly, plotnine, Pygal, Seaborn; R: ggplot2; Julia: Makie.jl. Compare all 15 side by side: Model Learning Curve in Python, R, Julia and JavaScript.
A learning curve visualizes model performance (training and validation scores) as a function of training set size. It is essential for diagnosing bias vs variance tradeoffs, determining whether collecting more data would improve model performance, and guiding model selection decisions. The plot typically shows two lines with shaded confidence bands representing variability across cross-validation folds.
// anyplot.ai
// learning-curve-basic: Model Learning Curve
// Library: d3 7.9.0 | JavaScript 22.23.2
// Quality: 91/100 | Created: 2026-09-05

const t = window.ANYPLOT_TOKENS;
const { width, height } = window.ANYPLOT_SIZE;
const margin = { top: 130, right: 80, bottom: 110, left: 130 };
const iw = width - margin.left - margin.right;
const ih = height - margin.top - margin.bottom;

// --- Data: simulated sklearn-style learning_curve() output -----------------
// Fixed-seed LCG (no RNG in the browser) — reproducible fold noise.
function makeLcg(seed) {
  let state = seed >>> 0;
  return () => {
    state = (1664525 * state + 1013904223) >>> 0;
    return state / 4294967296;
  };
}
const rand = makeLcg(42);
function gaussian() {
  const u1 = Math.max(rand(), 1e-9);
  const u2 = rand();
  return Math.sqrt(-2 * Math.log(u1)) * Math.cos(2 * Math.PI * u2);
}

// Digit-classification model: accuracy vs. number of training samples.
const trainSizes = [200, 500, 900, 1400, 2000, 2700, 3500, 4400];
const folds = 6;

function trendMean(size, start, end, scale) {
  return start + (end - start) * (1 - Math.exp(-size / scale));
}

function foldScores(meanFn, stdFn, size) {
  const mean = meanFn(size);
  const std = stdFn(size);
  const scores = [];
  for (let f = 0; f < folds; f++) {
    scores.push(Math.min(1, Math.max(0, mean + std * gaussian())));
  }
  return scores;
}

const trainMeanFn = (size) => trendMean(size, 0.995, 0.935, 1300);
const trainStdFn = (size) => 0.006 + 0.02 * Math.exp(-size / 1800);
const valMeanFn = (size) => trendMean(size, 0.7, 0.925, 1300);
const valStdFn = (size) => 0.012 + 0.05 * Math.exp(-size / 1800);

function summarize(scores) {
  const mean = scores.reduce((a, b) => a + b, 0) / scores.length;
  const variance = scores.reduce((a, b) => a + (b - mean) ** 2, 0) / scores.length;
  return { mean, std: Math.sqrt(variance) };
}

const trainStats = trainSizes.map((s) => summarize(foldScores(trainMeanFn, trainStdFn, s)));
const valStats = trainSizes.map((s) => summarize(foldScores(valMeanFn, valStdFn, s)));

// --- SVG mount ---------------------------------------------------------------
const svg = d3.select("#container").append("svg").attr("width", width).attr("height", height);
const g = svg.append("g").attr("transform", `translate(${margin.left},${margin.top})`);

// --- Scales -------------------------------------------------------------------
const x = d3.scaleLinear().domain(d3.extent(trainSizes)).range([0, iw]);
const yMin = d3.min([...trainStats, ...valStats], (d) => d.mean - d.std) - 0.03;
const yMax = d3.max([...trainStats, ...valStats], (d) => d.mean + d.std) + 0.03;
const y = d3.scaleLinear().domain([yMin, yMax]).nice().range([ih, 0]);

// --- Gridlines (y-axis only, subtle) ------------------------------------------
g.append("g")
  .selectAll("line")
  .data(y.ticks(6))
  .join("line")
  .attr("x1", 0)
  .attr("x2", iw)
  .attr("y1", (d) => y(d))
  .attr("y2", (d) => y(d))
  .attr("stroke", t.grid);

// --- Confidence bands (±1 std across folds) -----------------------------------
const bandColor = (color) => color;
const trainArea = d3
  .area()
  .x((d, i) => x(trainSizes[i]))
  .y0((d) => y(d.mean - d.std))
  .y1((d) => y(d.mean + d.std))
  .curve(d3.curveMonotoneX);
const valArea = d3
  .area()
  .x((d, i) => x(trainSizes[i]))
  .y0((d) => y(d.mean - d.std))
  .y1((d) => y(d.mean + d.std))
  .curve(d3.curveMonotoneX);

g.append("path").datum(trainStats).attr("d", trainArea).attr("fill", t.palette[0]).attr("opacity", 0.15);
g.append("path").datum(valStats).attr("d", valArea).attr("fill", t.palette[1]).attr("opacity", 0.15);

// --- Lines ---------------------------------------------------------------------
const line = d3
  .line()
  .x((d, i) => x(trainSizes[i]))
  .y((d) => y(d.mean))
  .curve(d3.curveMonotoneX);

g.append("path").datum(trainStats).attr("d", line).attr("fill", "none").attr("stroke", t.palette[0]).attr("stroke-width", 3.5);
g.append("path").datum(valStats).attr("d", line).attr("fill", "none").attr("stroke", t.palette[1]).attr("stroke-width", 3.5);

// --- Markers ---------------------------------------------------------------------
g.selectAll(".train-dot")
  .data(trainStats)
  .join("circle")
  .attr("cx", (d, i) => x(trainSizes[i]))
  .attr("cy", (d) => y(d.mean))
  .attr("r", 8.5)
  .attr("fill", t.palette[0])
  .attr("stroke", t.pageBg)
  .attr("stroke-width", 2);

g.selectAll(".val-dot")
  .data(valStats)
  .join("circle")
  .attr("cx", (d, i) => x(trainSizes[i]))
  .attr("cy", (d) => y(d.mean))
  .attr("r", 8.5)
  .attr("fill", t.palette[1])
  .attr("stroke", t.pageBg)
  .attr("stroke-width", 2);

// --- Axes ---------------------------------------------------------------------
const xAxis = g
  .append("g")
  .attr("transform", `translate(0,${ih})`)
  .call(d3.axisBottom(x).tickValues(trainSizes).tickFormat(d3.format(",")));
const yAxis = g.append("g").call(d3.axisLeft(y).ticks(6).tickFormat(d3.format(".0%")));

for (const ax of [xAxis, yAxis]) {
  ax.selectAll("text").attr("fill", t.inkSoft).style("font-size", "14px");
  ax.selectAll("line").attr("stroke", t.inkSoft);
  ax.select(".domain").attr("stroke", t.inkSoft);
}

// --- Axis labels ---------------------------------------------------------------
g.append("text")
  .attr("x", iw / 2)
  .attr("y", ih + 70)
  .attr("text-anchor", "middle")
  .attr("fill", t.ink)
  .style("font-size", "18px")
  .text("Training Set Size (samples)");

g.append("text")
  .attr("transform", "rotate(-90)")
  .attr("x", -ih / 2)
  .attr("y", -95)
  .attr("text-anchor", "middle")
  .attr("fill", t.ink)
  .style("font-size", "18px")
  .text("Accuracy");

// --- Legend (free space: top-right, above the converging curves) ---------------
const legend = g.append("g").attr("transform", `translate(${iw - 300},10)`);
legend
  .append("rect")
  .attr("x", -16)
  .attr("y", -14)
  .attr("width", 250)
  .attr("height", 82)
  .attr("rx", 10)
  .attr("fill", t.elevatedBg)
  .attr("stroke", t.grid);
const legendItems = [
  { label: "Training score", color: t.palette[0] },
  { label: "Validation score", color: t.palette[1] },
];
legendItems.forEach((item, i) => {
  const row = legend.append("g").attr("transform", `translate(0,${i * 34})`);
  row.append("line").attr("x1", 0).attr("x2", 28).attr("y1", 0).attr("y2", 0).attr("stroke", item.color).attr("stroke-width", 3.5);
  row
    .append("text")
    .attr("x", 38)
    .attr("y", 5)
    .attr("fill", t.inkSoft)
    .style("font-size", "15px")
    .text(item.label);
});

// --- Annotation: call out the narrowing train/validation gap --------------------
// Placed in the empty lower-middle whitespace, well clear of the legend and
// the axis labels, with a dashed leader pointing at the converged tail.
const lastIdx = trainSizes.length - 1;
const gapX = x(trainSizes[lastIdx]);
const gapMidY = (y(trainStats[lastIdx].mean) + y(valStats[lastIdx].mean)) / 2;
const labelX = iw * 0.5;
const labelY = ih * 0.6;
g.append("line")
  .attr("x1", labelX + 8)
  .attr("y1", labelY - 8)
  .attr("x2", gapX - 16)
  .attr("y2", gapMidY + 6)
  .attr("stroke", t.inkSoft)
  .attr("stroke-width", 1)
  .attr("stroke-dasharray", "3,3");
g.append("text")
  .attr("x", labelX)
  .attr("y", labelY)
  .attr("text-anchor", "start")
  .attr("fill", t.inkSoft)
  .style("font-size", "14px")
  .style("font-style", "italic")
  .text("Gap narrows as training data grows");

// --- Title -----------------------------------------------------------------------
svg
  .append("text")
  .attr("x", width / 2)
  .attr("y", 62)
  .attr("text-anchor", "middle")
  .attr("fill", t.ink)
  .style("font-size", "27px")
  .style("font-weight", "600")
  .text("learning-curve-basic · javascript · d3 · anyplot.ai");
Runnable source as JSON, for any HTTP client: https://api.anyplot.ai/specs/learning-curve-basic/d3/code. Any spec id and library id listed in llms-full.txt fit the same URL shape; every URL below is complete and callable.
{
  "spec_id": "learning-curve-basic",
  "language": "javascript",
  "library": "d3",
  "page": "https://anyplot.ai/learning-curve-basic/javascript/d3",
  "hub": "https://anyplot.ai/learning-curve-basic",
  "code_json": "https://api.anyplot.ai/specs/learning-curve-basic/d3/code",
  "spec_json": "https://api.anyplot.ai/specs/learning-curve-basic",
  "render_light_png": "https://storage.googleapis.com/anyplot-images/plots/learning-curve-basic/javascript/d3/plot-light.png",
  "render_dark_png": "https://storage.googleapis.com/anyplot-images/plots/learning-curve-basic/javascript/d3/plot-dark.png",
  "interactive_light_html": "https://storage.googleapis.com/anyplot-images/plots/learning-curve-basic/javascript/d3/plot-light.html",
  "interactive_dark_html": "https://storage.googleapis.com/anyplot-images/plots/learning-curve-basic/javascript/d3/plot-dark.html",
  "quality_score": 91.0,
  "license": "MIT",
  "guide": "https://anyplot.ai/llms.txt"
}
Part of Model Learning Curve on anyplot.ai.