The same plot in 14 other libraries — JavaScript: Chart.js, D3.js, Highcharts, MUI X Charts; Python: Altair, Bokeh, lets-plot, Matplotlib, Plotly, plotnine, Pygal, Seaborn; R: ggplot2; Julia: Makie.jl. Compare all 15 side by side: Model Learning Curve in Python, R, Julia and JavaScript.
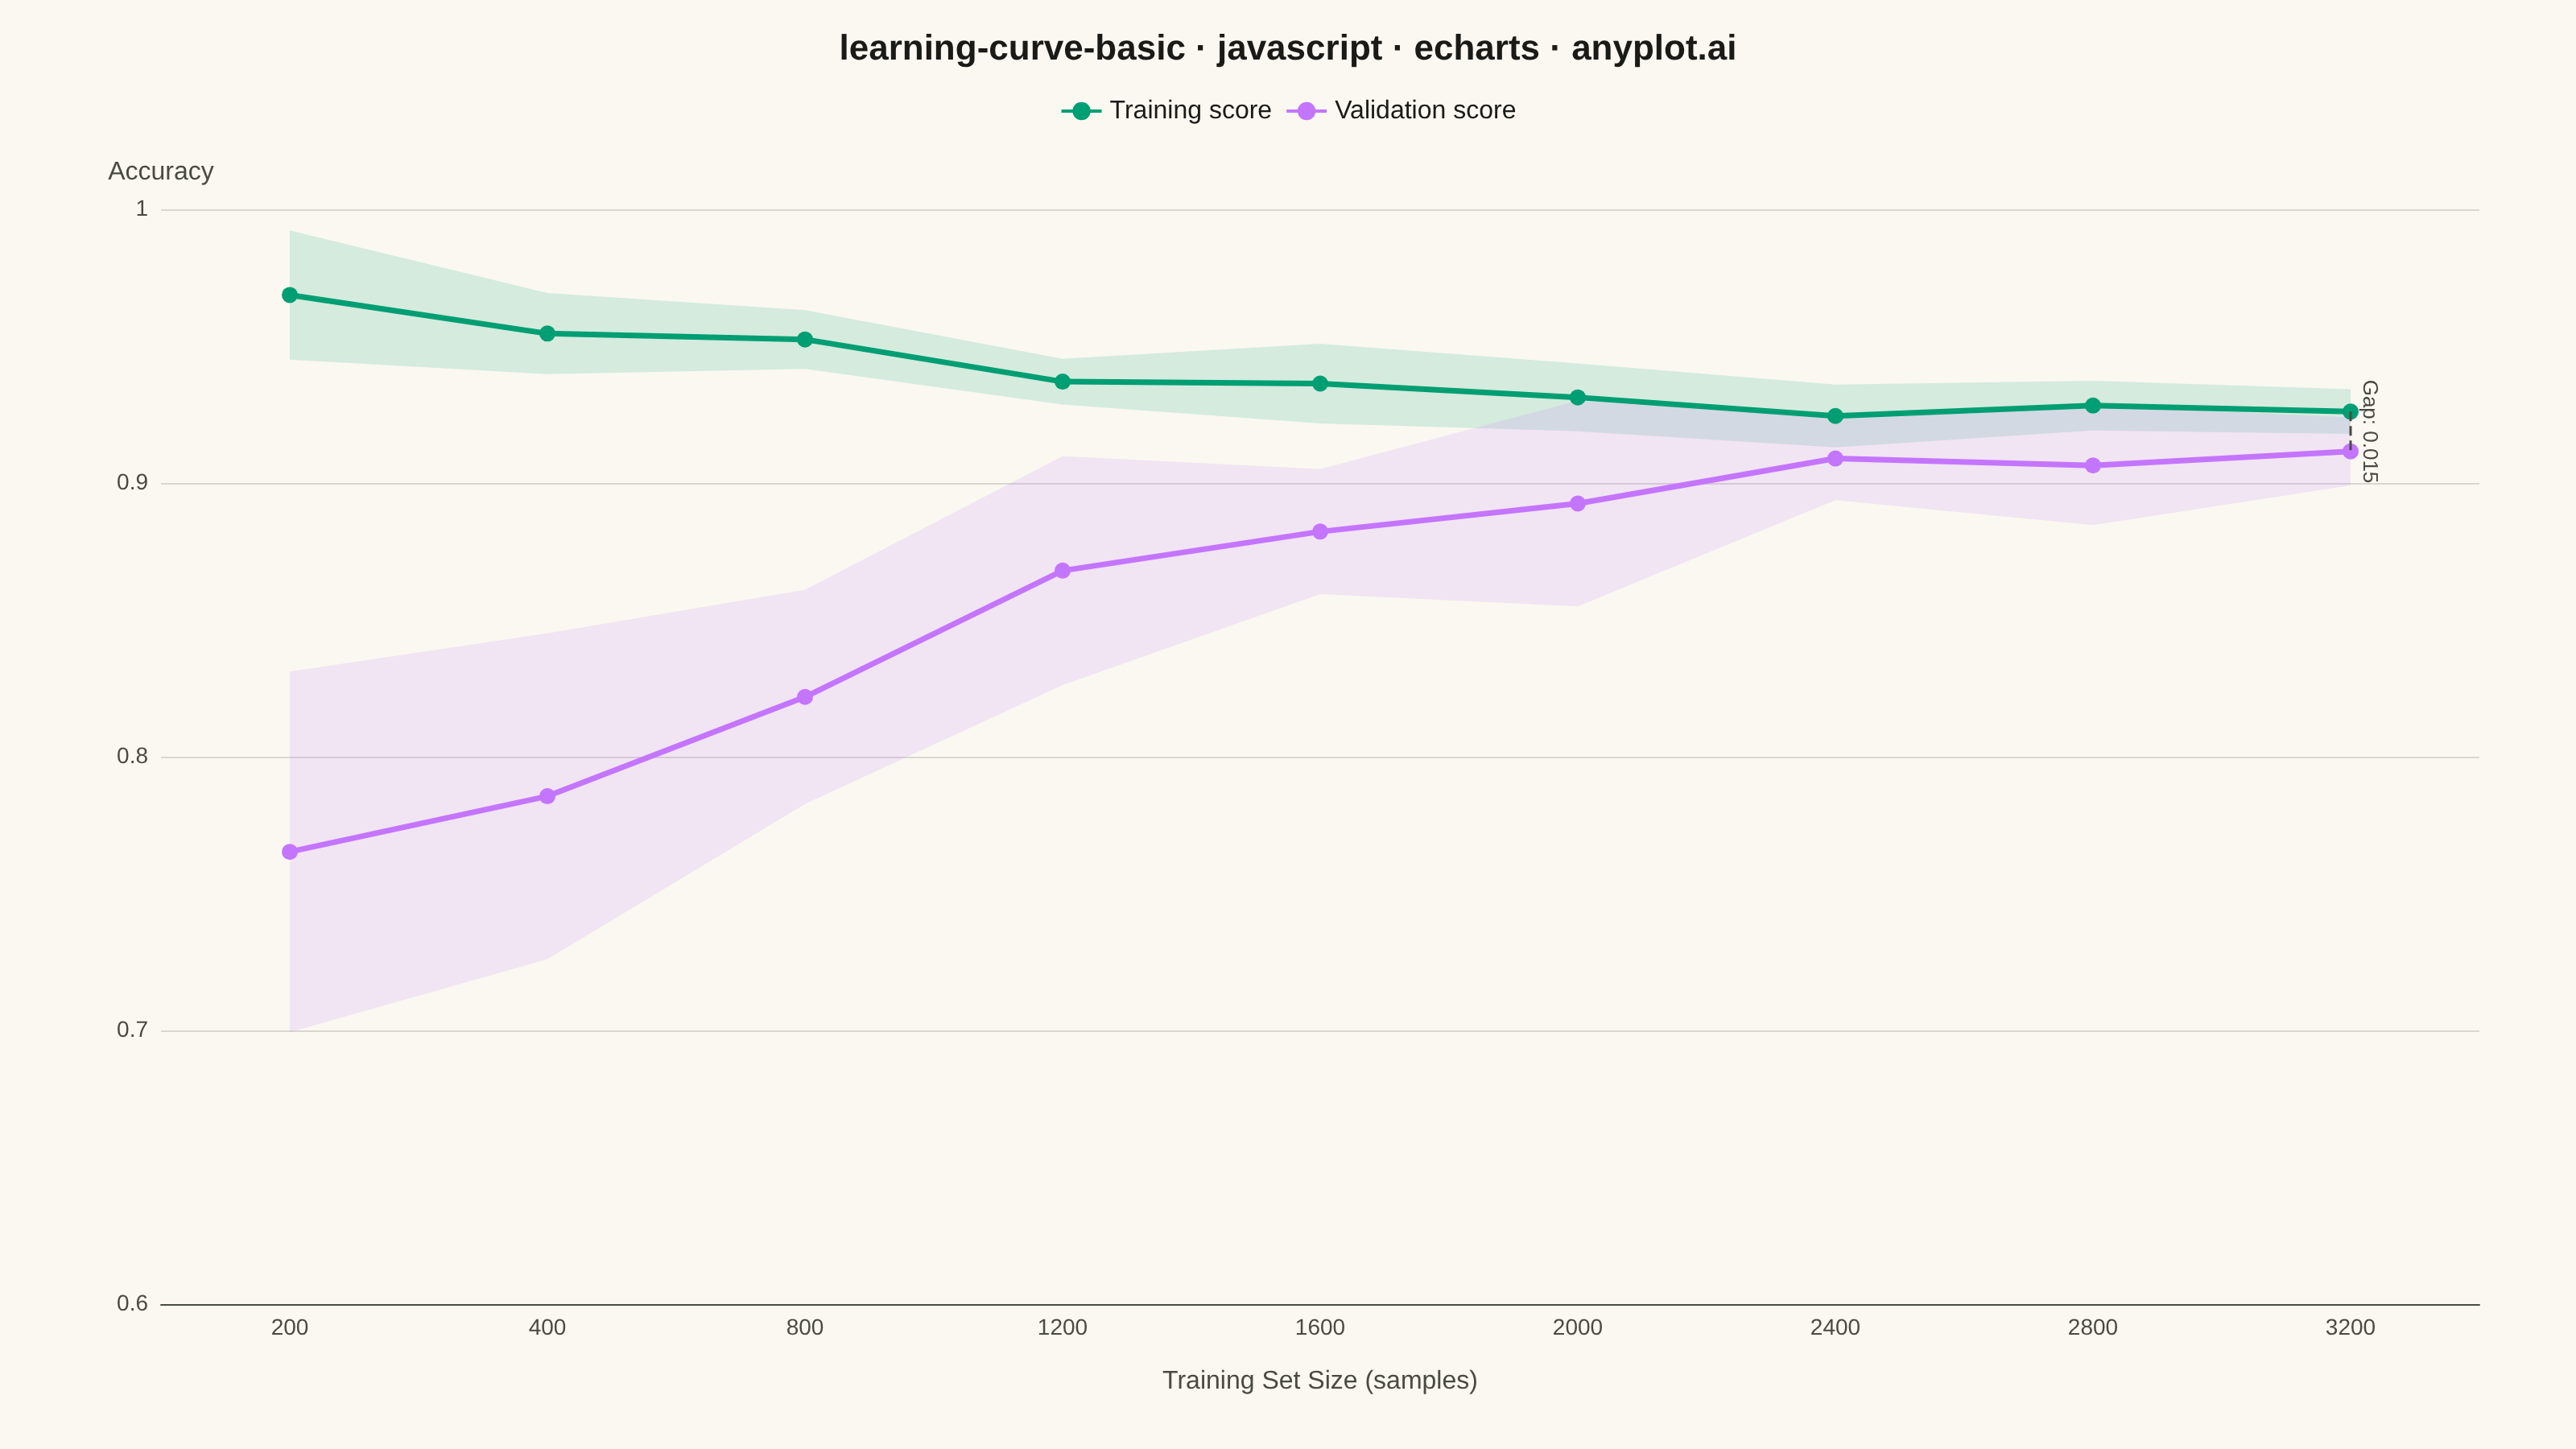
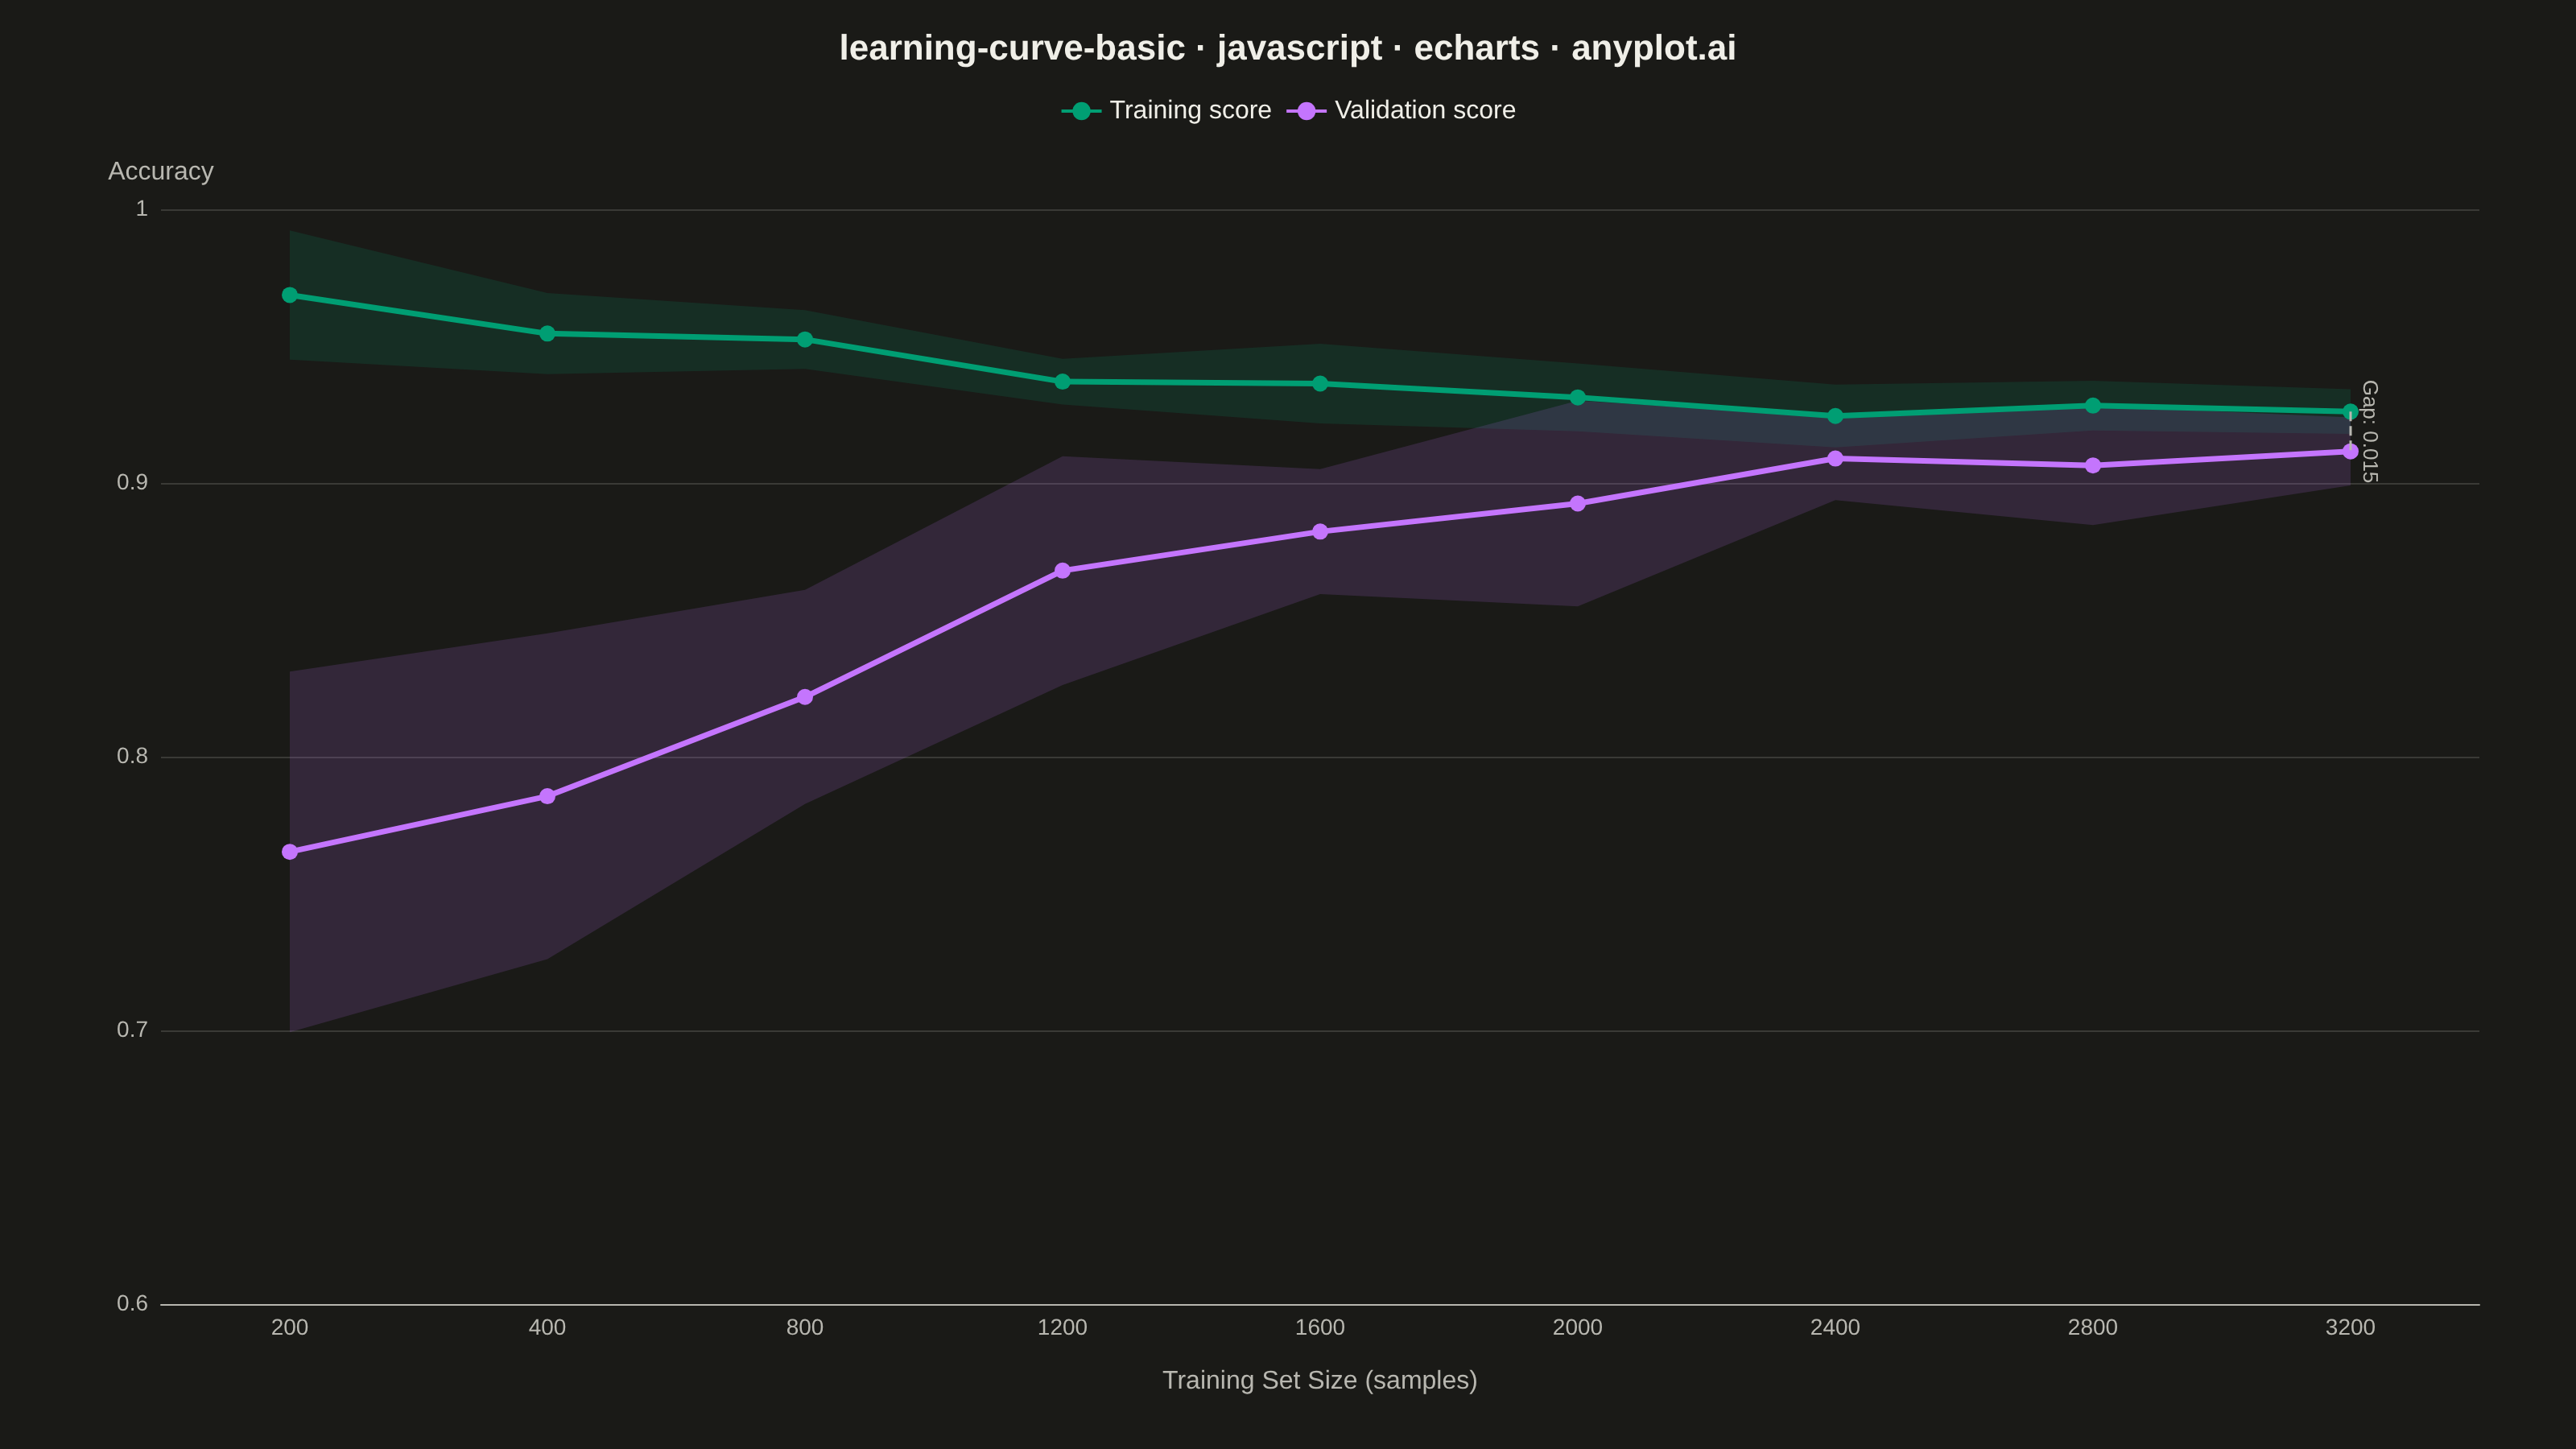
A learning curve visualizes model performance (training and validation scores) as a function of training set size. It is essential for diagnosing bias vs variance tradeoffs, determining whether collecting more data would improve model performance, and guiding model selection decisions. The plot typically shows two lines with shaded confidence bands representing variability across cross-validation folds.
// anyplot.ai
// learning-curve-basic: Model Learning Curve
// Library: echarts 6.1.0 | JavaScript 22.23.2
// Quality: 91/100 | Created: 2026-09-05

const t = window.ANYPLOT_TOKENS;

// --- Data (in-memory, deterministic) ---------------------------------------
// Simulated 10-fold cross-validation learning curve for a random-forest
// churn classifier: accuracy vs. training set size.
let lcgState = 42;
function lcgRandom() {
  lcgState = (lcgState * 1664525 + 1013904223) % 4294967296;
  return lcgState / 4294967296;
}
function gaussianNoise(std) {
  const u1 = lcgRandom() || 1e-9;
  const u2 = lcgRandom();
  return std * Math.sqrt(-2 * Math.log(u1)) * Math.cos(2 * Math.PI * u2);
}

const trainSizes = [200, 400, 800, 1200, 1600, 2000, 2400, 2800, 3200];
const foldCount = 10;

// Training accuracy starts near-perfect and eases down as the model sees
// more (harder) examples; validation accuracy starts low and climbs toward
// the training curve — the classic converging-gap shape of a well-fit model.
const trainMean = trainSizes.map((n) => 0.975 - 0.05 * (1 - Math.exp(-n / 900)));
const validationMean = trainSizes.map((n) => 0.72 + 0.205 * (1 - Math.exp(-n / 1100)));

function simulateFolds(meanCurve, baseStd, decayScale) {
  const folds = [];
  for (let f = 0; f < foldCount; f += 1) {
    folds.push(
      meanCurve.map((mean, i) => {
        const std = baseStd * Math.exp(-trainSizes[i] / decayScale) + baseStd * 0.25;
        return Math.min(1, Math.max(0, mean + gaussianNoise(std)));
      })
    );
  }
  return folds;
}

// Validation folds carry more spread than training folds, especially at
// small sample sizes — the usual high-variance signature of held-out data.
const trainFolds = simulateFolds(trainMean, 0.02, 1800);
const validationFolds = simulateFolds(validationMean, 0.06, 1400);

function meanAndStd(folds) {
  const sizeCount = folds[0].length;
  const mean = [];
  const std = [];
  for (let i = 0; i < sizeCount; i += 1) {
    const column = folds.map((row) => row[i]);
    const m = column.reduce((a, b) => a + b, 0) / column.length;
    const variance = column.reduce((a, b) => a + (b - m) ** 2, 0) / column.length;
    mean.push(m);
    std.push(Math.sqrt(variance));
  }
  return { mean, std };
}

const train = meanAndStd(trainFolds);
const validation = meanAndStd(validationFolds);

// Remaining generalization gap at the largest training set size — annotated
// below with a markLine connecting the two final points.
const lastIndex = trainSizes.length - 1;
const finalGap = train.mean[lastIndex] - validation.mean[lastIndex];

// --- Init -------------------------------------------------------------------
const chart = echarts.init(document.getElementById("container"));

// --- Option -----------------------------------------------------------------
const trainColor = t.palette[0]; // brand green — always first series
const validationColor = t.palette[1]; // lavender — second categorical series

// A ±1 std confidence band, drawn with the standard ECharts stacked-area
// trick: an invisible line at (mean - std), then a filled band of height
// (2 * std) stacked on top of it, so the visible area spans mean ± std.
function confidenceBand(name, mean, std, color) {
  const lowerBound = mean.map((m, i) => m - std[i]);
  const bandHeight = mean.map((_, i) => 2 * std[i]);
  return [
    {
      name: `${name} lower bound`,
      type: "line",
      data: lowerBound,
      stack: `${name}-band`,
      symbol: "none",
      lineStyle: { opacity: 0 },
      areaStyle: { opacity: 0 },
      silent: true,
      tooltip: { show: false },
    },
    {
      name: `${name} band`,
      type: "line",
      data: bandHeight,
      stack: `${name}-band`,
      symbol: "none",
      lineStyle: { opacity: 0 },
      areaStyle: { color, opacity: 0.15 },
      silent: true,
      tooltip: { show: false },
    },
  ];
}

chart.setOption({
  animation: false,
  color: [trainColor, validationColor],
  backgroundColor: "transparent",
  title: {
    text: "learning-curve-basic · javascript · echarts · anyplot.ai",
    left: "center",
    textStyle: { color: t.ink, fontSize: 22 },
  },
  legend: {
    data: ["Training score", "Validation score"],
    top: 56,
    textStyle: { color: t.ink, fontSize: 16 },
  },
  tooltip: { trigger: "axis" },
  grid: { left: 100, right: 60, top: 130, bottom: 90 },
  xAxis: {
    type: "category",
    data: trainSizes,
    name: "Training Set Size (samples)",
    nameLocation: "middle",
    nameGap: 40,
    nameTextStyle: { color: t.inkSoft, fontSize: 16 },
    axisLabel: { color: t.inkSoft, fontSize: 14 },
    axisLine: { lineStyle: { color: t.inkSoft } },
    axisTick: { show: false },
    splitLine: { show: false },
  },
  yAxis: {
    type: "value",
    name: "Accuracy",
    min: 0.6,
    max: 1.0,
    nameTextStyle: { color: t.inkSoft, fontSize: 16 },
    axisLabel: { color: t.inkSoft, fontSize: 14 },
    axisLine: { lineStyle: { color: t.inkSoft } },
    axisTick: { show: false },
    splitLine: { lineStyle: { color: t.grid } },
  },
  series: [
    ...confidenceBand("Training score", train.mean, train.std, trainColor),
    {
      name: "Training score",
      type: "line",
      data: train.mean,
      symbol: "circle",
      symbolSize: 10,
      lineStyle: { width: 3.5, color: trainColor },
      itemStyle: { color: trainColor },
    },
    ...confidenceBand("Validation score", validation.mean, validation.std, validationColor),
    {
      name: "Validation score",
      type: "line",
      data: validation.mean,
      symbol: "circle",
      symbolSize: 10,
      lineStyle: { width: 3.5, color: validationColor },
      itemStyle: { color: validationColor },
      // Connects the final training/validation points with a labeled
      // markLine calling out the residual generalization gap — a distinctive
      // use of ECharts' arbitrary-coordinate markLine feature.
      markLine: {
        symbol: ["none", "none"],
        silent: true,
        lineStyle: { color: t.inkSoft, type: "dashed", width: 1.5 },
        label: {
          formatter: `Gap: ${finalGap.toFixed(3)}`,
          color: t.inkSoft,
          fontSize: 13,
          position: "middle",
        },
        data: [
          [
            { coord: [lastIndex, train.mean[lastIndex]] },
            { coord: [lastIndex, validation.mean[lastIndex]] },
          ],
        ],
      },
    },
  ],
});
Runnable source as JSON, for any HTTP client: https://api.anyplot.ai/specs/learning-curve-basic/echarts/code. Any spec id and library id listed in llms-full.txt fit the same URL shape; every URL below is complete and callable.
{
  "spec_id": "learning-curve-basic",
  "language": "javascript",
  "library": "echarts",
  "page": "https://anyplot.ai/learning-curve-basic/javascript/echarts",
  "hub": "https://anyplot.ai/learning-curve-basic",
  "code_json": "https://api.anyplot.ai/specs/learning-curve-basic/echarts/code",
  "spec_json": "https://api.anyplot.ai/specs/learning-curve-basic",
  "render_light_png": "https://storage.googleapis.com/anyplot-images/plots/learning-curve-basic/javascript/echarts/plot-light.png",
  "render_dark_png": "https://storage.googleapis.com/anyplot-images/plots/learning-curve-basic/javascript/echarts/plot-dark.png",
  "interactive_light_html": "https://storage.googleapis.com/anyplot-images/plots/learning-curve-basic/javascript/echarts/plot-light.html",
  "interactive_dark_html": "https://storage.googleapis.com/anyplot-images/plots/learning-curve-basic/javascript/echarts/plot-dark.html",
  "quality_score": 91.0,
  "license": "MIT",
  "guide": "https://anyplot.ai/llms.txt"
}
Part of Model Learning Curve on anyplot.ai.