The same plot in 14 other libraries — JavaScript: Chart.js, D3.js, Apache ECharts, Highcharts; Python: Altair, Bokeh, lets-plot, Matplotlib, Plotly, plotnine, Pygal, Seaborn; R: ggplot2; Julia: Makie.jl. Compare all 15 side by side: Model Learning Curve in Python, R, Julia and JavaScript.
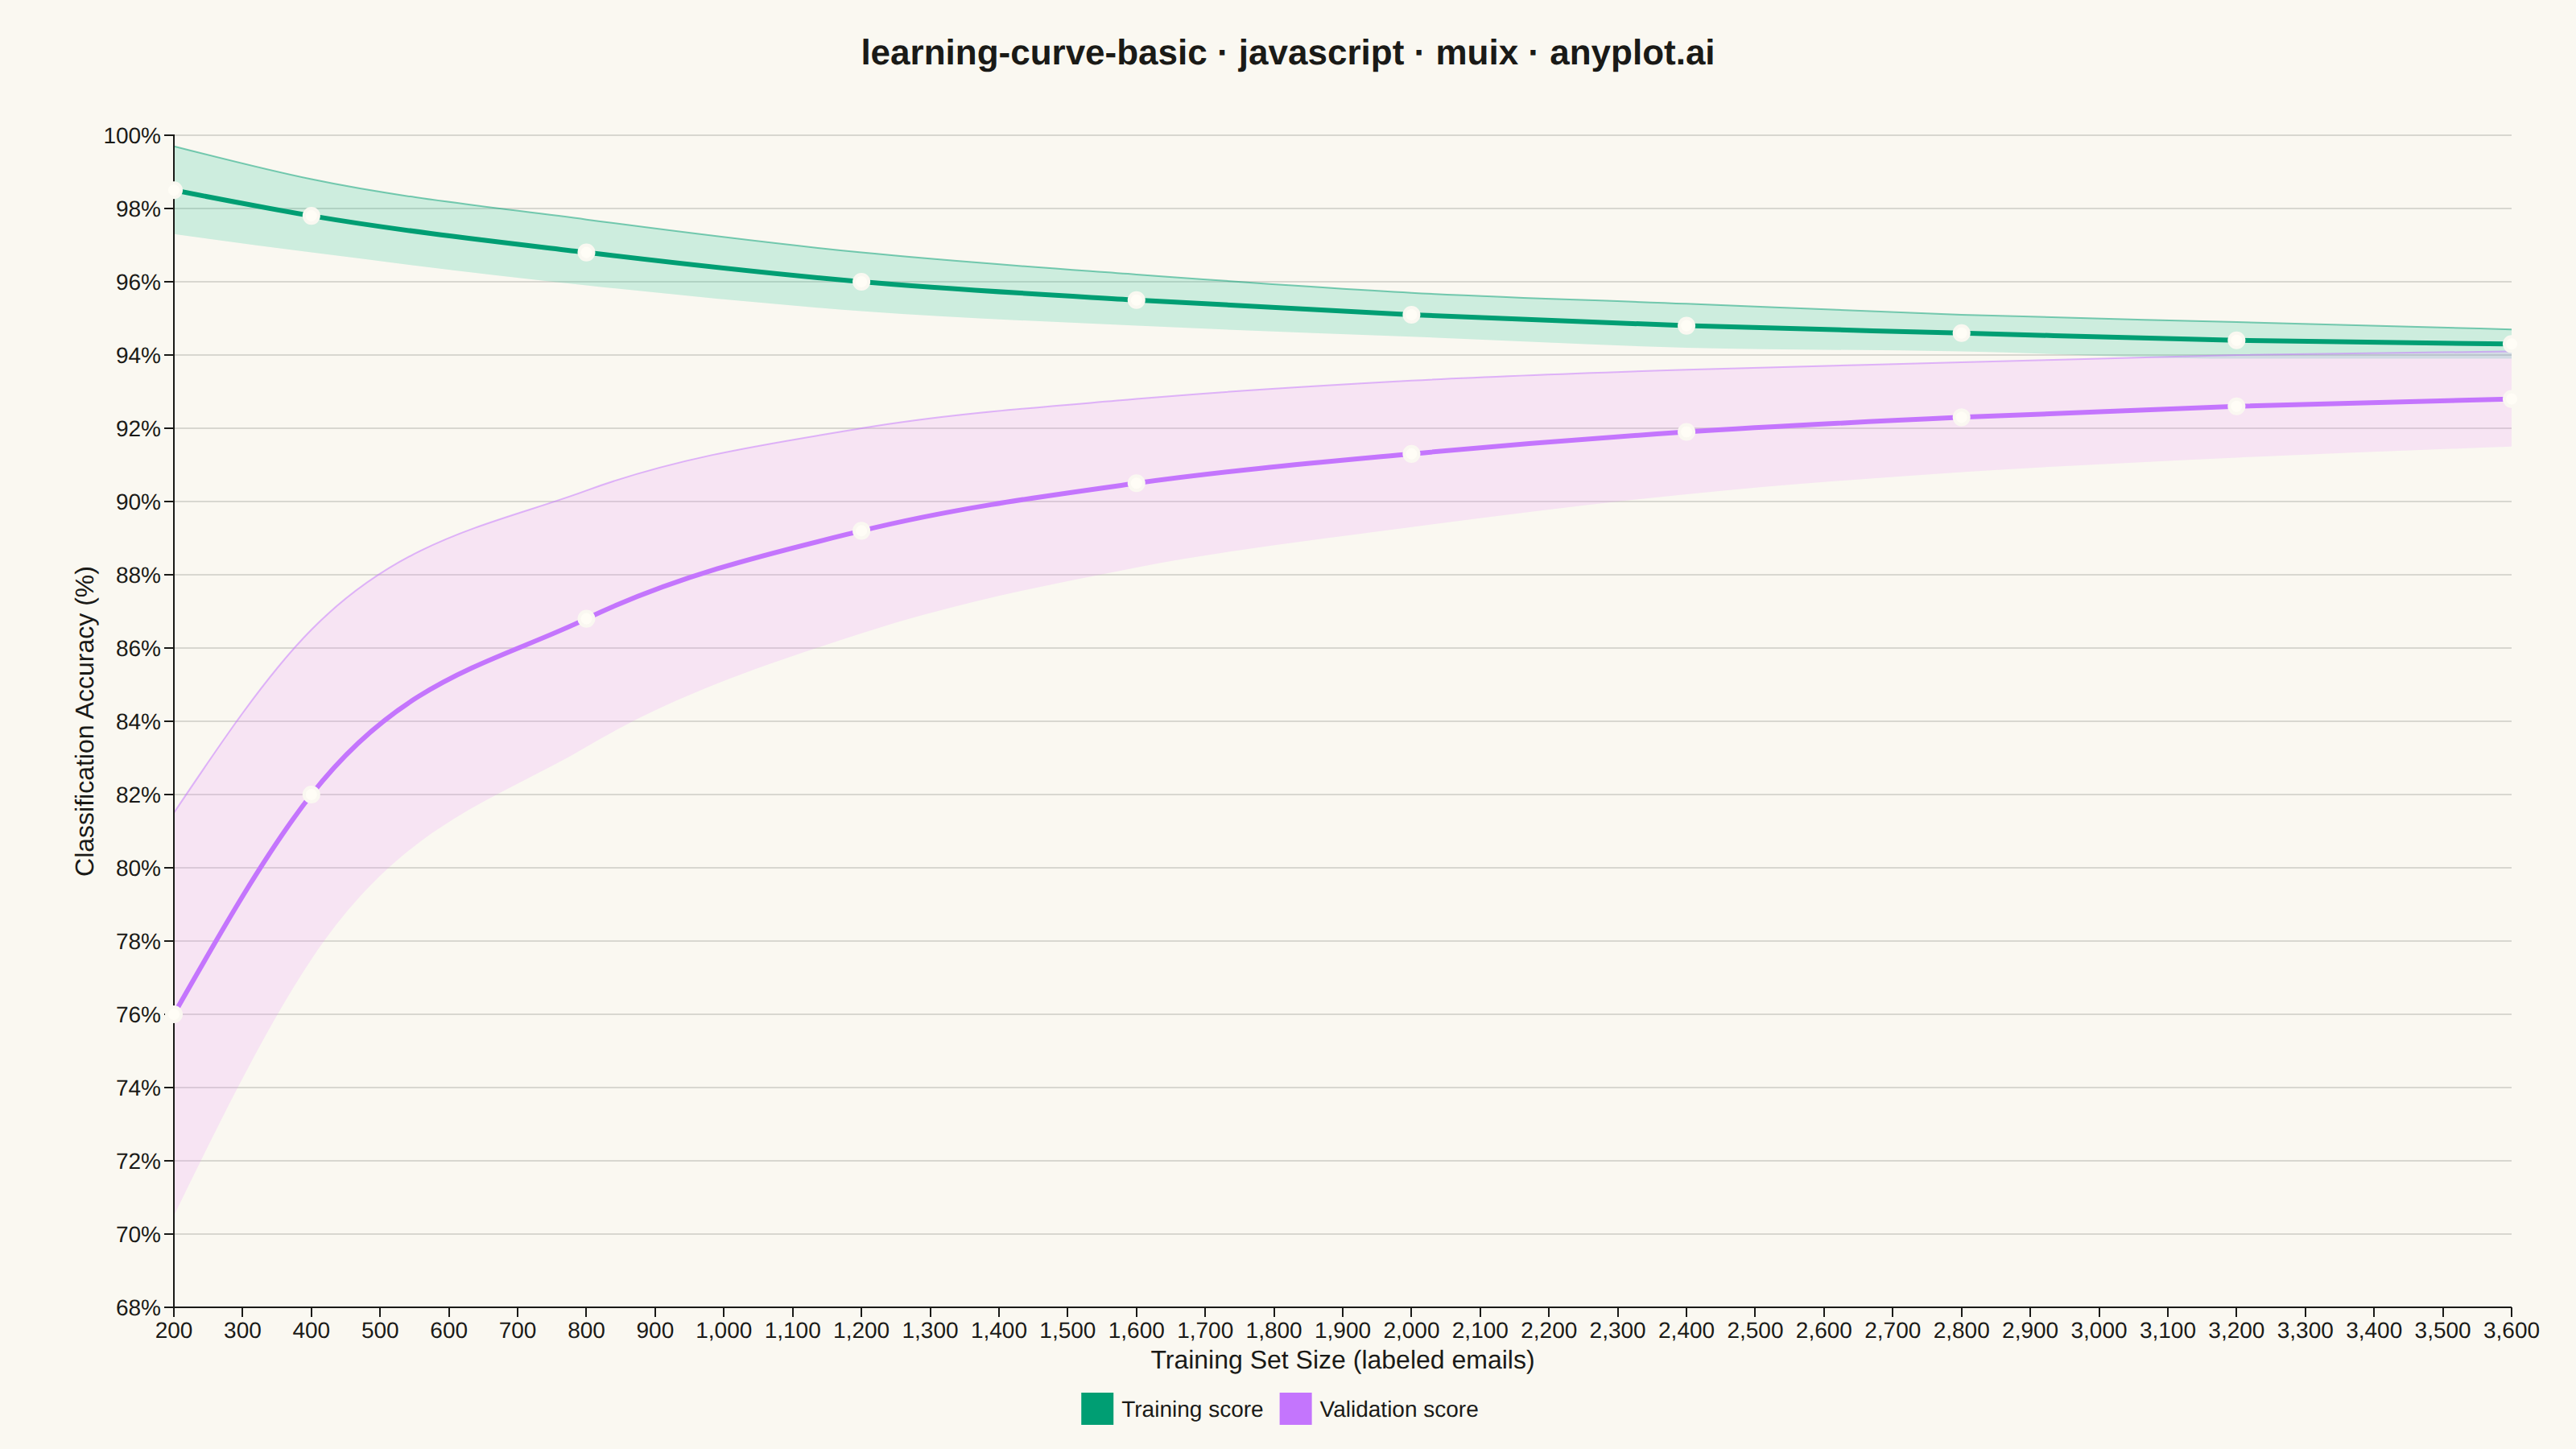
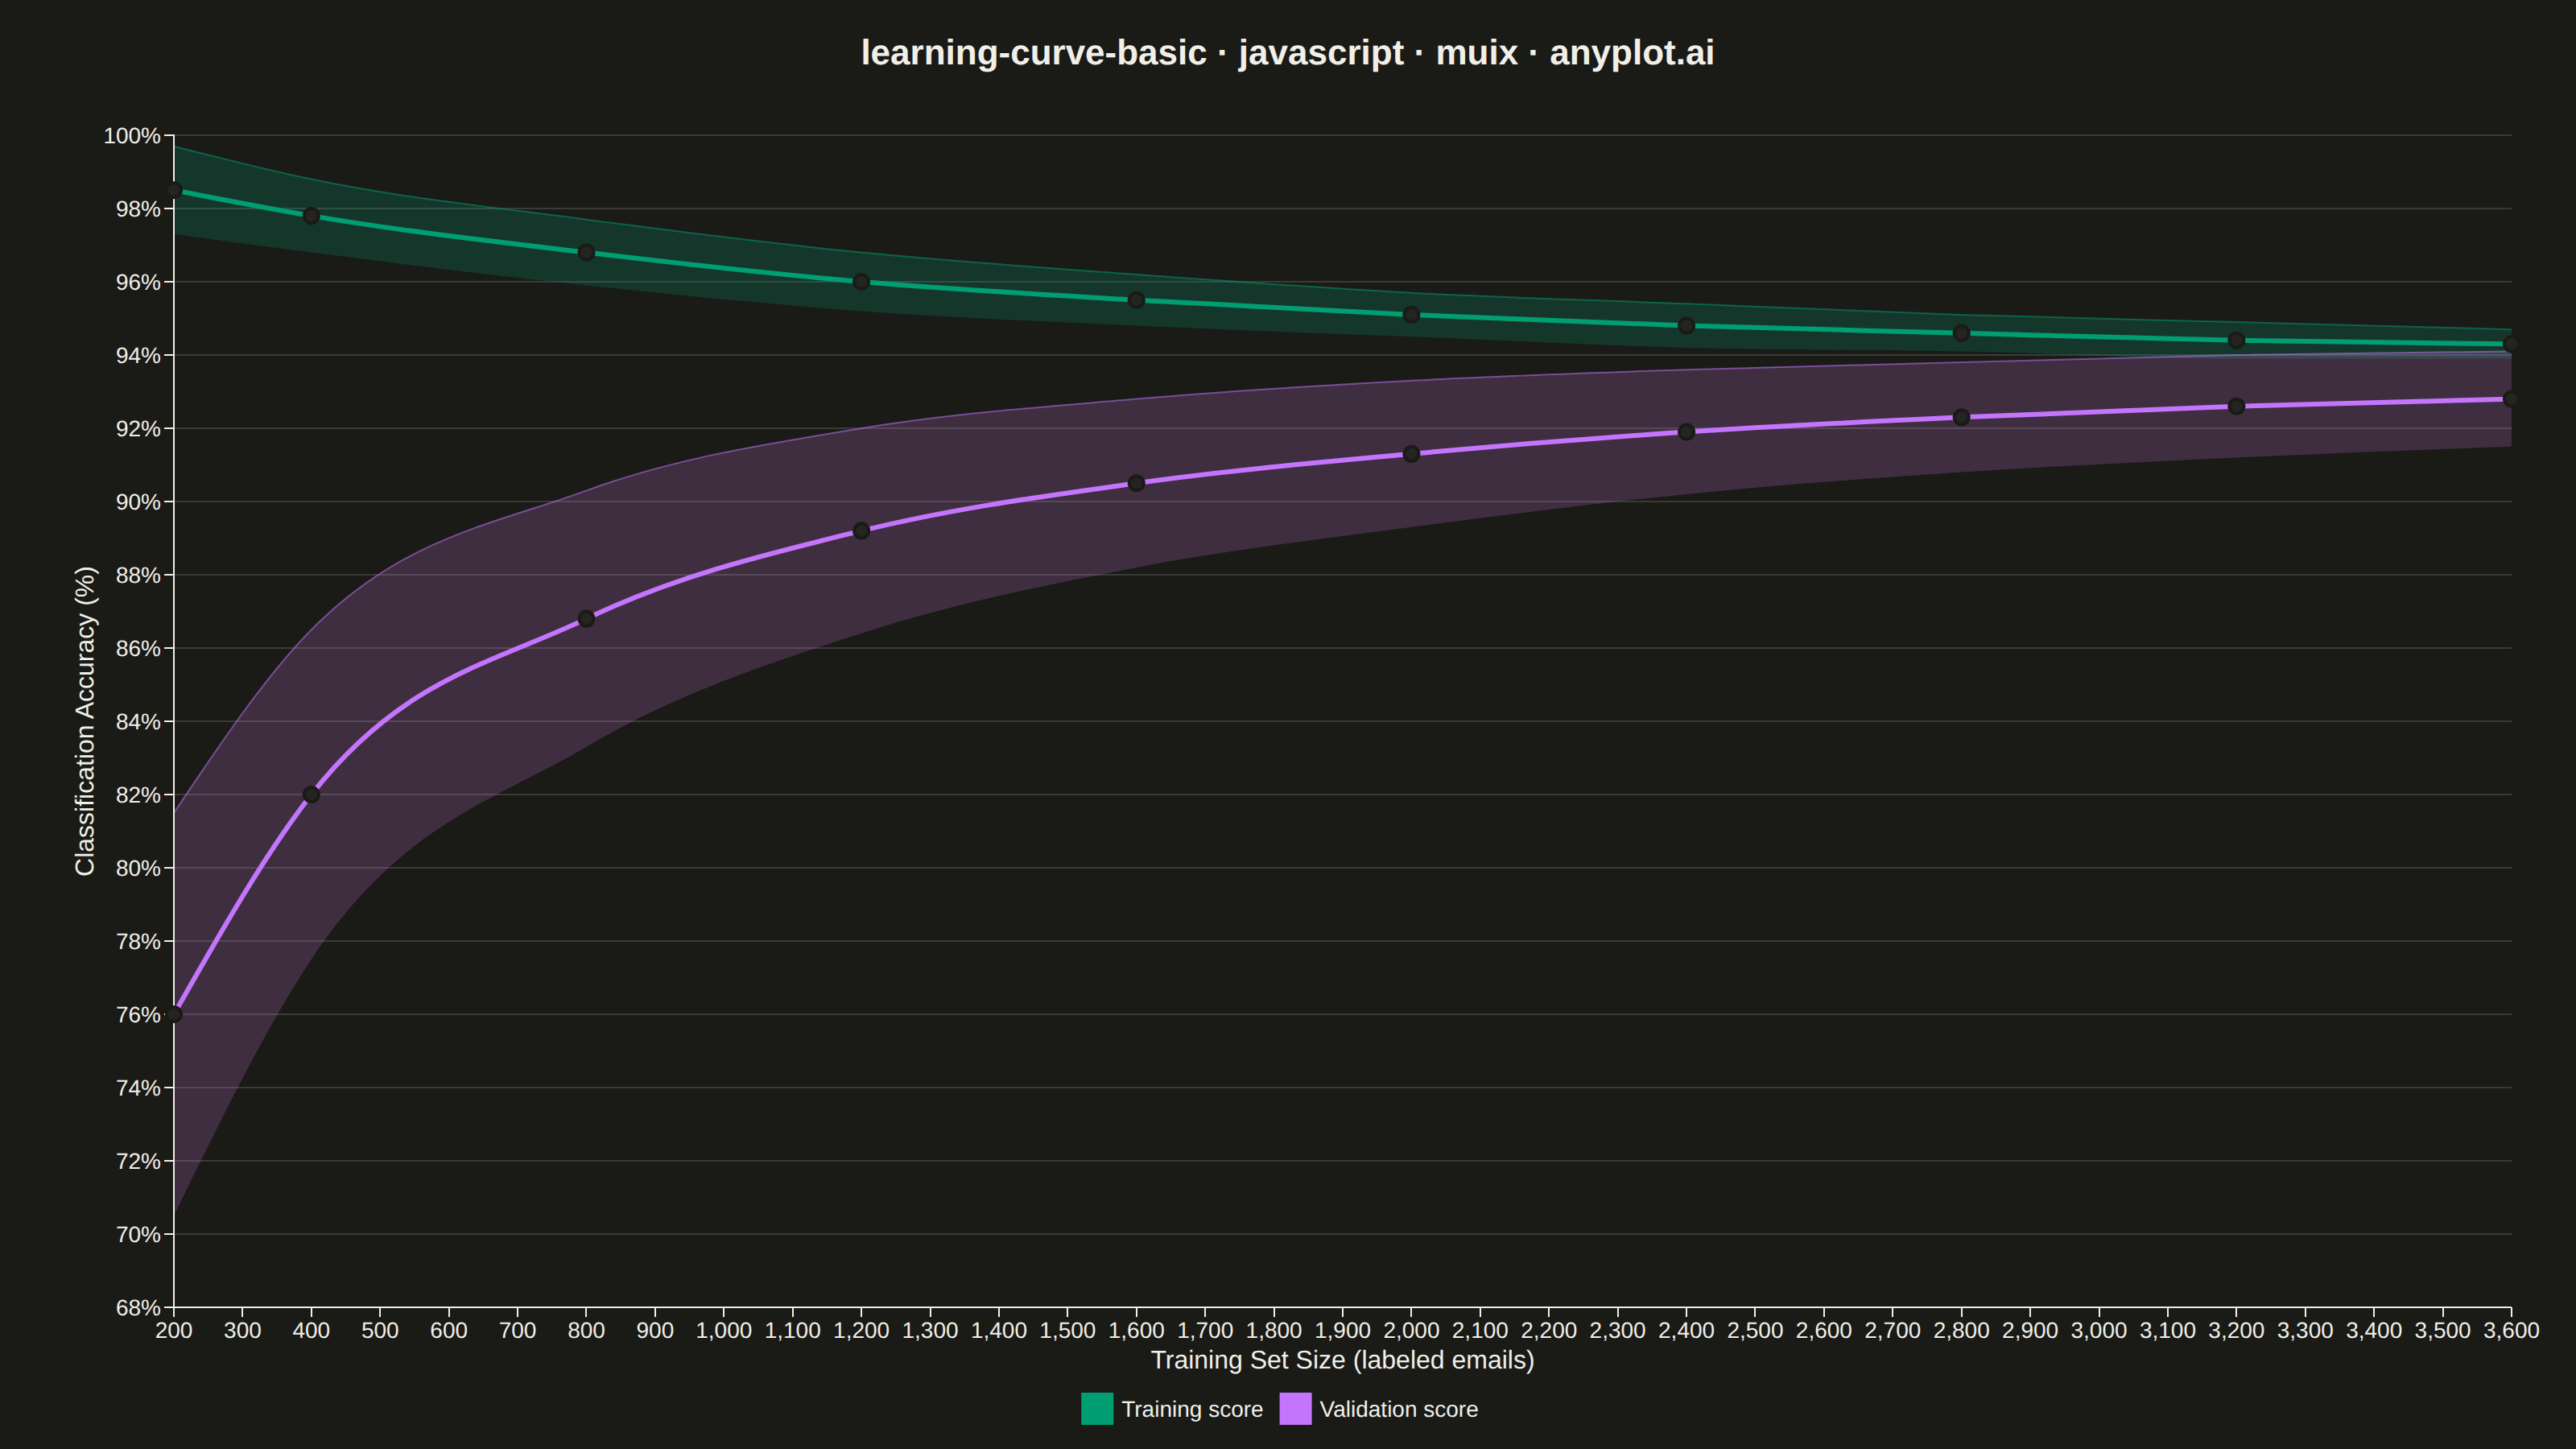
A learning curve visualizes model performance (training and validation scores) as a function of training set size. It is essential for diagnosing bias vs variance tradeoffs, determining whether collecting more data would improve model performance, and guiding model selection decisions. The plot typically shows two lines with shaded confidence bands representing variability across cross-validation folds.
// anyplot.ai
// learning-curve-basic: Model Learning Curve
// Library: muix 7.29.1 | JavaScript 22.23.2
// Quality: 89/100 | Created: 2026-09-05
import { LineChart } from "@mui/x-charts/LineChart";
import { Box, Typography } from "@mui/material";

const t = window.ANYPLOT_TOKENS;

// --- Data (in-memory, deterministic) ----------------------------------------
// A spam-filter classifier evaluated at 10 training-set sizes via 8-fold
// cross-validation. Training accuracy drifts slightly downward as the fixed
// model has to fit more varied examples, while validation accuracy climbs and
// the two converge — but don't fully close — as more labeled email tightens
// the ±1 std-dev spread across folds. That persistent, narrowing gap is the
// classic "more data would still help a bit" diagnosis a learning curve exists
// to reveal.
const trainSizes = [200, 400, 800, 1200, 1600, 2000, 2400, 2800, 3200, 3600];
const trainMean = [0.985, 0.978, 0.968, 0.96, 0.955, 0.951, 0.948, 0.946, 0.944, 0.943];
const trainStd = [0.012, 0.01, 0.009, 0.008, 0.007, 0.006, 0.006, 0.005, 0.005, 0.004];
const valMean = [0.76, 0.82, 0.868, 0.892, 0.905, 0.913, 0.919, 0.923, 0.926, 0.928];
const valStd = [0.055, 0.045, 0.035, 0.028, 0.023, 0.02, 0.017, 0.015, 0.014, 0.013];

// ±1 std-dev confidence band via the stacked-area trick: a fully transparent
// "lower" series carries the band's floor, and a "width" series (2×std)
// stacked on top of it fills exactly the [mean-std, mean+std] interval.
const trainLower = trainMean.map((m, i) => m - trainStd[i]);
const trainWidth = trainStd.map((s) => 2 * s);
const valLower = valMean.map((m, i) => m - valStd[i]);
const valWidth = valStd.map((s) => 2 * s);

const TITLE = "learning-curve-basic · javascript · muix · anyplot.ai";

// --- Chart (default-exported component — the harness mounts it) ------------
export default function Chart() {
  const size = window.ANYPLOT_SIZE;
  const titleH = 64;
  const chartH = size.height - titleH;

  return (
    <Box
      sx={{
        width: size.width,
        height: size.height,
        boxSizing: "border-box",
        display: "flex",
        flexDirection: "column",
      }}
    >
      <Box sx={{ height: titleH, display: "flex", alignItems: "center", justifyContent: "center" }}>
        <Typography sx={{ color: t.ink, fontSize: 22, fontWeight: 600 }}>{TITLE}</Typography>
      </Box>
      <LineChart
        width={size.width}
        height={chartH}
        skipAnimation
        margin={{ top: 20, right: 40, bottom: 88, left: 108 }}
        series={[
          { id: "trainLower", data: trainLower, stack: "trainBand", area: true, showMark: false, color: t.palette[0] },
          { id: "trainBand", data: trainWidth, stack: "trainBand", area: true, showMark: false, color: t.palette[0] },
          {
            id: "trainMean",
            data: trainMean,
            label: "Training score",
            color: t.palette[0],
            showMark: true,
            curve: "monotoneX",
            valueFormatter: (v) => `${(v * 100).toFixed(1)}%`,
          },
          { id: "valLower", data: valLower, stack: "valBand", area: true, showMark: false, color: t.palette[1] },
          { id: "valBand", data: valWidth, stack: "valBand", area: true, showMark: false, color: t.palette[1] },
          {
            id: "valMean",
            data: valMean,
            label: "Validation score",
            color: t.palette[1],
            showMark: true,
            curve: "monotoneX",
            valueFormatter: (v) => `${(v * 100).toFixed(1)}%`,
          },
        ]}
        xAxis={[
          {
            data: trainSizes,
            scaleType: "linear",
            label: "Training Set Size (labeled emails)",
            tickLabelStyle: { fontSize: 14 },
            labelStyle: { fontSize: 16 },
          },
        ]}
        yAxis={[
          {
            min: 0.68,
            max: 1.0,
            label: "Classification Accuracy (%)",
            valueFormatter: (v) => `${Math.round(v * 100)}%`,
            // tickFontSize drives the label's reserved offset from the tick
            // text (MUI X sizes that gap off this prop, not tickLabelStyle),
            // so it must stay wide enough for a 4-char "100%" tick.
            tickFontSize: 34,
            tickLabelStyle: { fontSize: 14 },
            labelStyle: { fontSize: 16 },
          },
        ]}
        grid={{ horizontal: true }}
        slotProps={{
          legend: {
            position: { vertical: "bottom", horizontal: "middle" },
            direction: "row",
            labelStyle: { fontSize: 14 },
          },
        }}
        sx={{
          "& .MuiLineElement-series-trainMean": { strokeWidth: 3 },
          "& .MuiLineElement-series-valMean": { strokeWidth: 3 },
          "& .MuiLineElement-series-trainLower, & .MuiLineElement-series-valLower": { stroke: "none" },
          "& .MuiLineElement-series-trainBand": { stroke: t.palette[0], strokeWidth: 1, strokeOpacity: 0.5 },
          "& .MuiLineElement-series-valBand": { stroke: t.palette[1], strokeWidth: 1, strokeOpacity: 0.5 },
          "& .MuiAreaElement-series-trainLower, & .MuiAreaElement-series-valLower": { fillOpacity: 0 },
          "& .MuiAreaElement-series-trainBand, & .MuiAreaElement-series-valBand": { fillOpacity: 0.18 },
          "& .MuiMarkElement-series-trainMean, & .MuiMarkElement-series-valMean": {
            r: 9,
            stroke: t.pageBg,
            strokeWidth: 2,
          },
          "& .MuiChartsGrid-line": { stroke: t.grid },
        }}
      />
    </Box>
  );
}
Runnable source as JSON, for any HTTP client: https://api.anyplot.ai/specs/learning-curve-basic/muix/code. Any spec id and library id listed in llms-full.txt fit the same URL shape; every URL below is complete and callable.
{
  "spec_id": "learning-curve-basic",
  "language": "javascript",
  "library": "muix",
  "page": "https://anyplot.ai/learning-curve-basic/javascript/muix",
  "hub": "https://anyplot.ai/learning-curve-basic",
  "code_json": "https://api.anyplot.ai/specs/learning-curve-basic/muix/code",
  "spec_json": "https://api.anyplot.ai/specs/learning-curve-basic",
  "render_light_png": "https://storage.googleapis.com/anyplot-images/plots/learning-curve-basic/javascript/muix/plot-light.png",
  "render_dark_png": "https://storage.googleapis.com/anyplot-images/plots/learning-curve-basic/javascript/muix/plot-dark.png",
  "interactive_light_html": "https://storage.googleapis.com/anyplot-images/plots/learning-curve-basic/javascript/muix/plot-light.html",
  "interactive_dark_html": "https://storage.googleapis.com/anyplot-images/plots/learning-curve-basic/javascript/muix/plot-dark.html",
  "quality_score": 89.0,
  "license": "MIT",
  "guide": "https://anyplot.ai/llms.txt"
}
Part of Model Learning Curve on anyplot.ai.