The same plot in 14 other libraries — JavaScript: D3.js, Apache ECharts, Highcharts, MUI X Charts; Python: Altair, Bokeh, lets-plot, Matplotlib, Plotly, plotnine, Pygal, Seaborn; R: ggplot2; Julia: Makie.jl. Compare all 15 side by side: Parametric Curve Plot in Python, R, Julia and JavaScript.
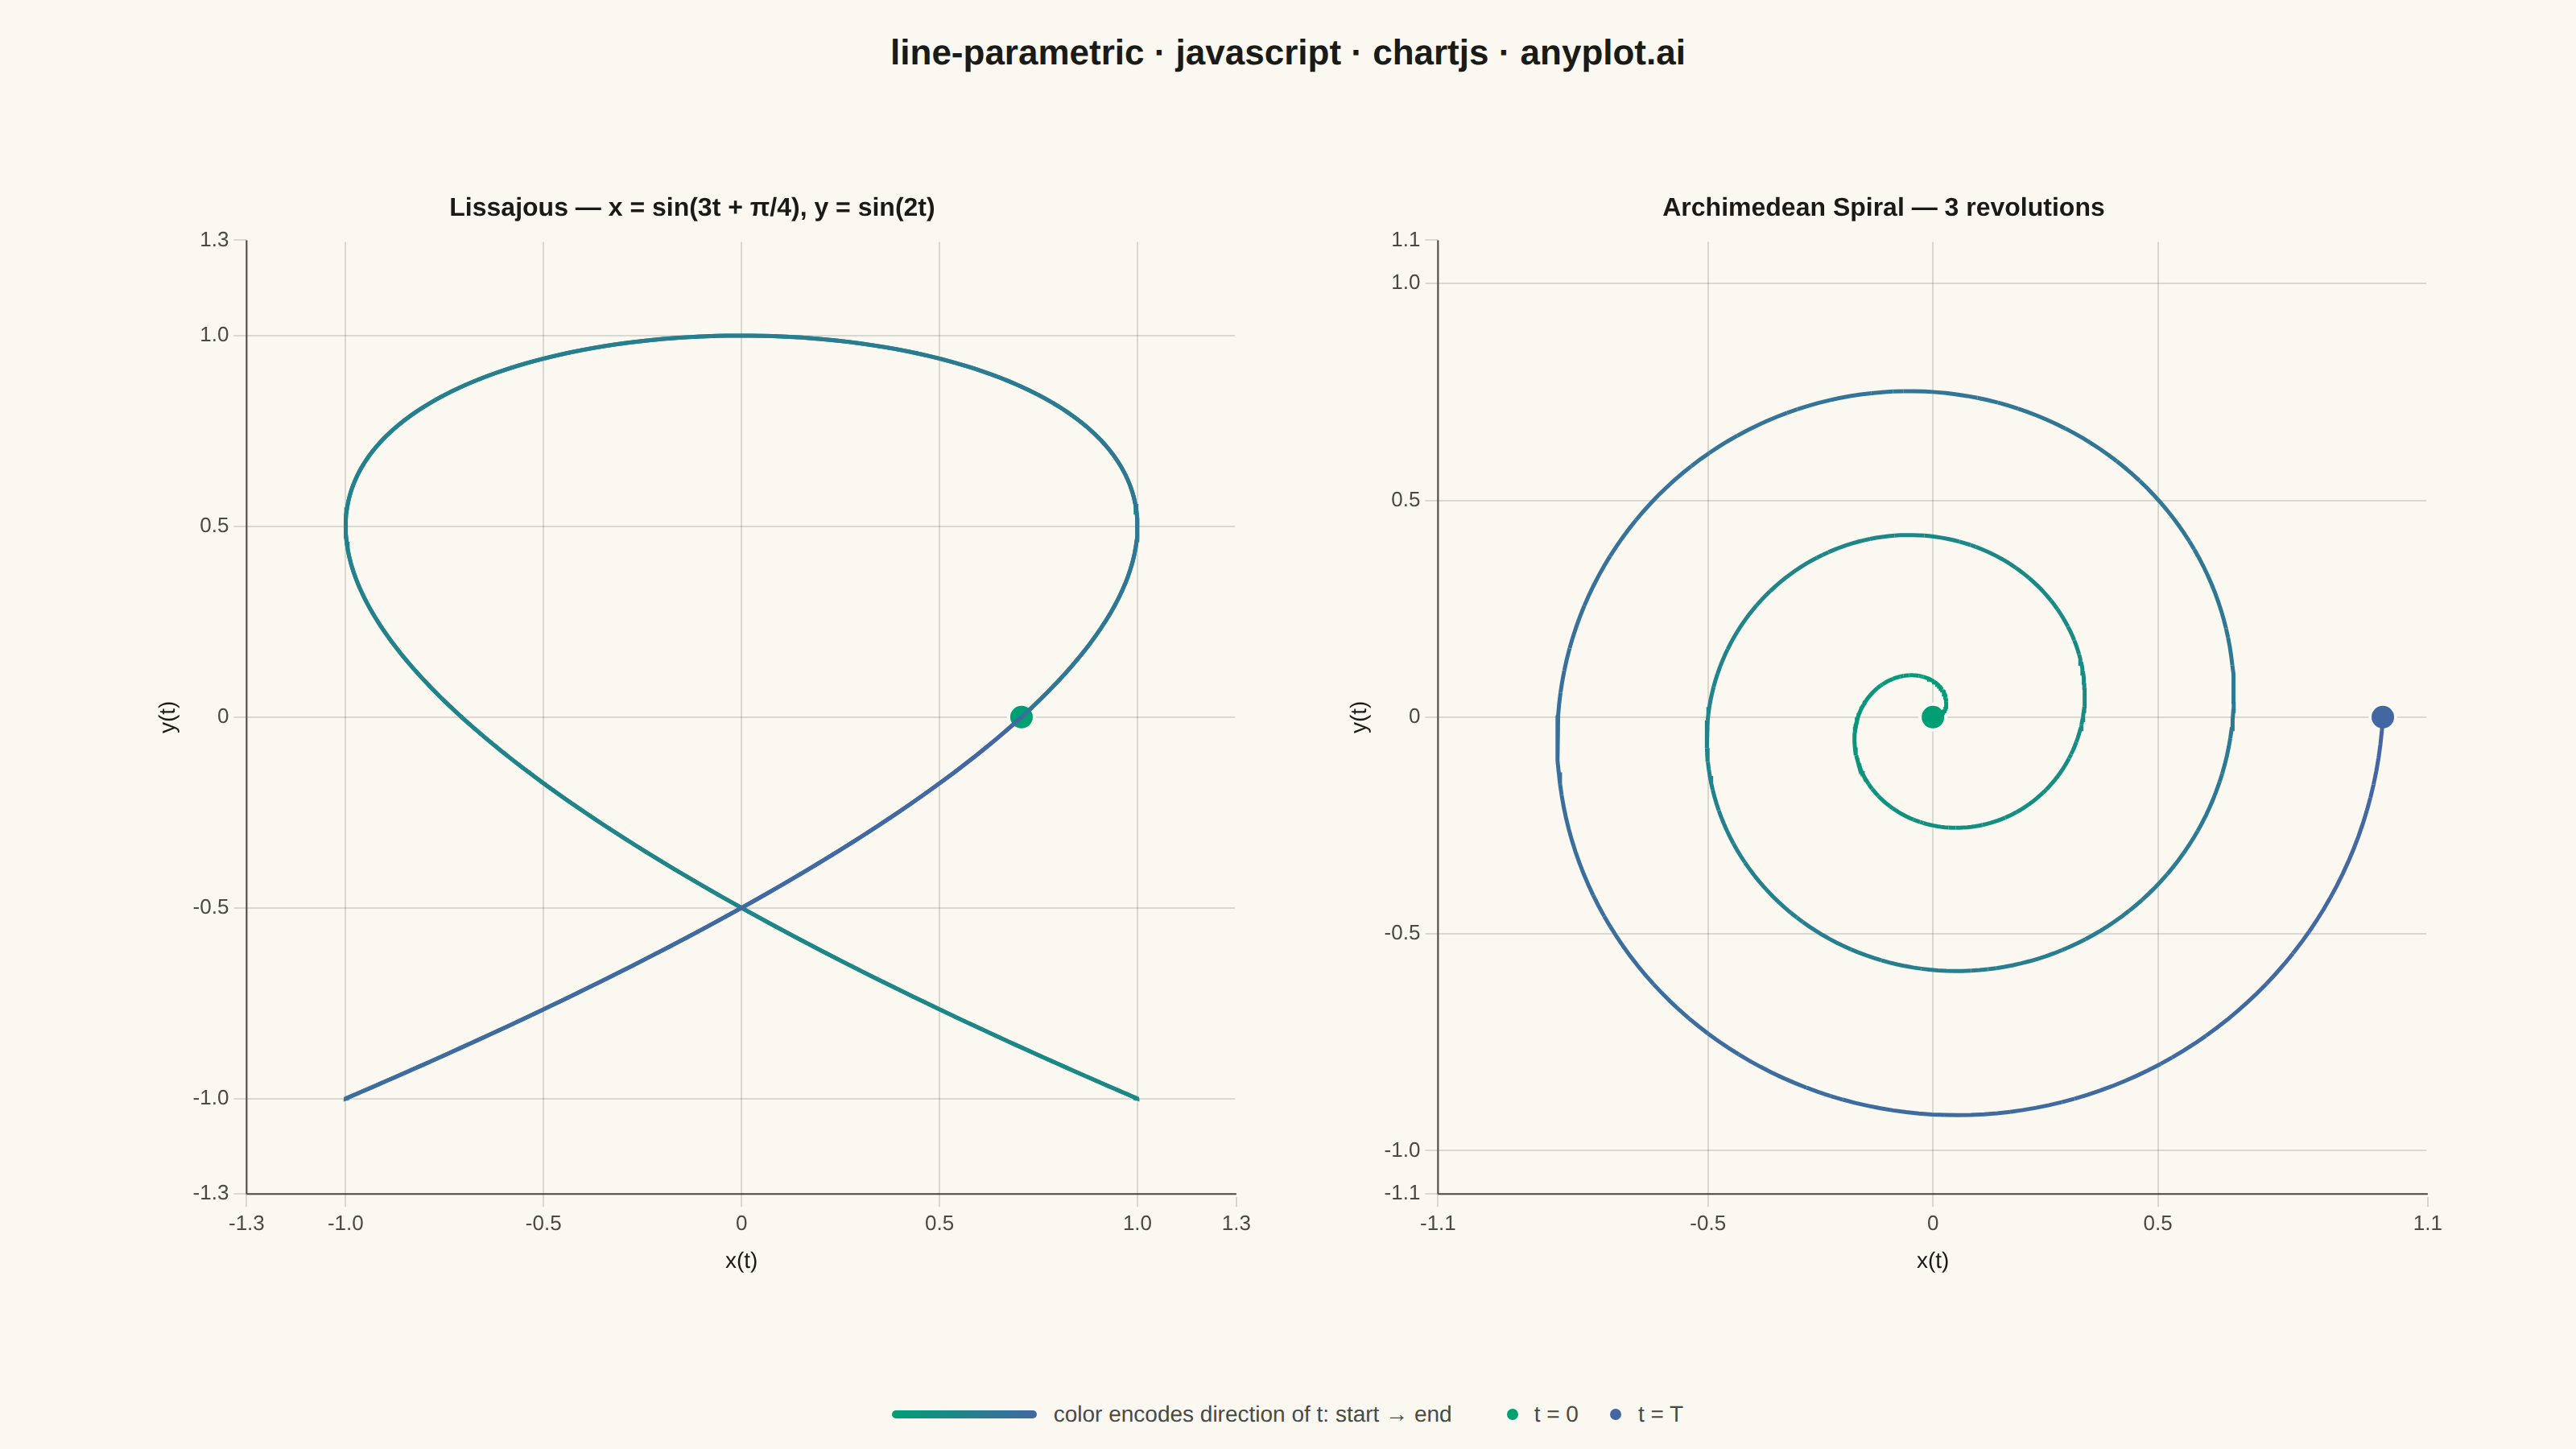
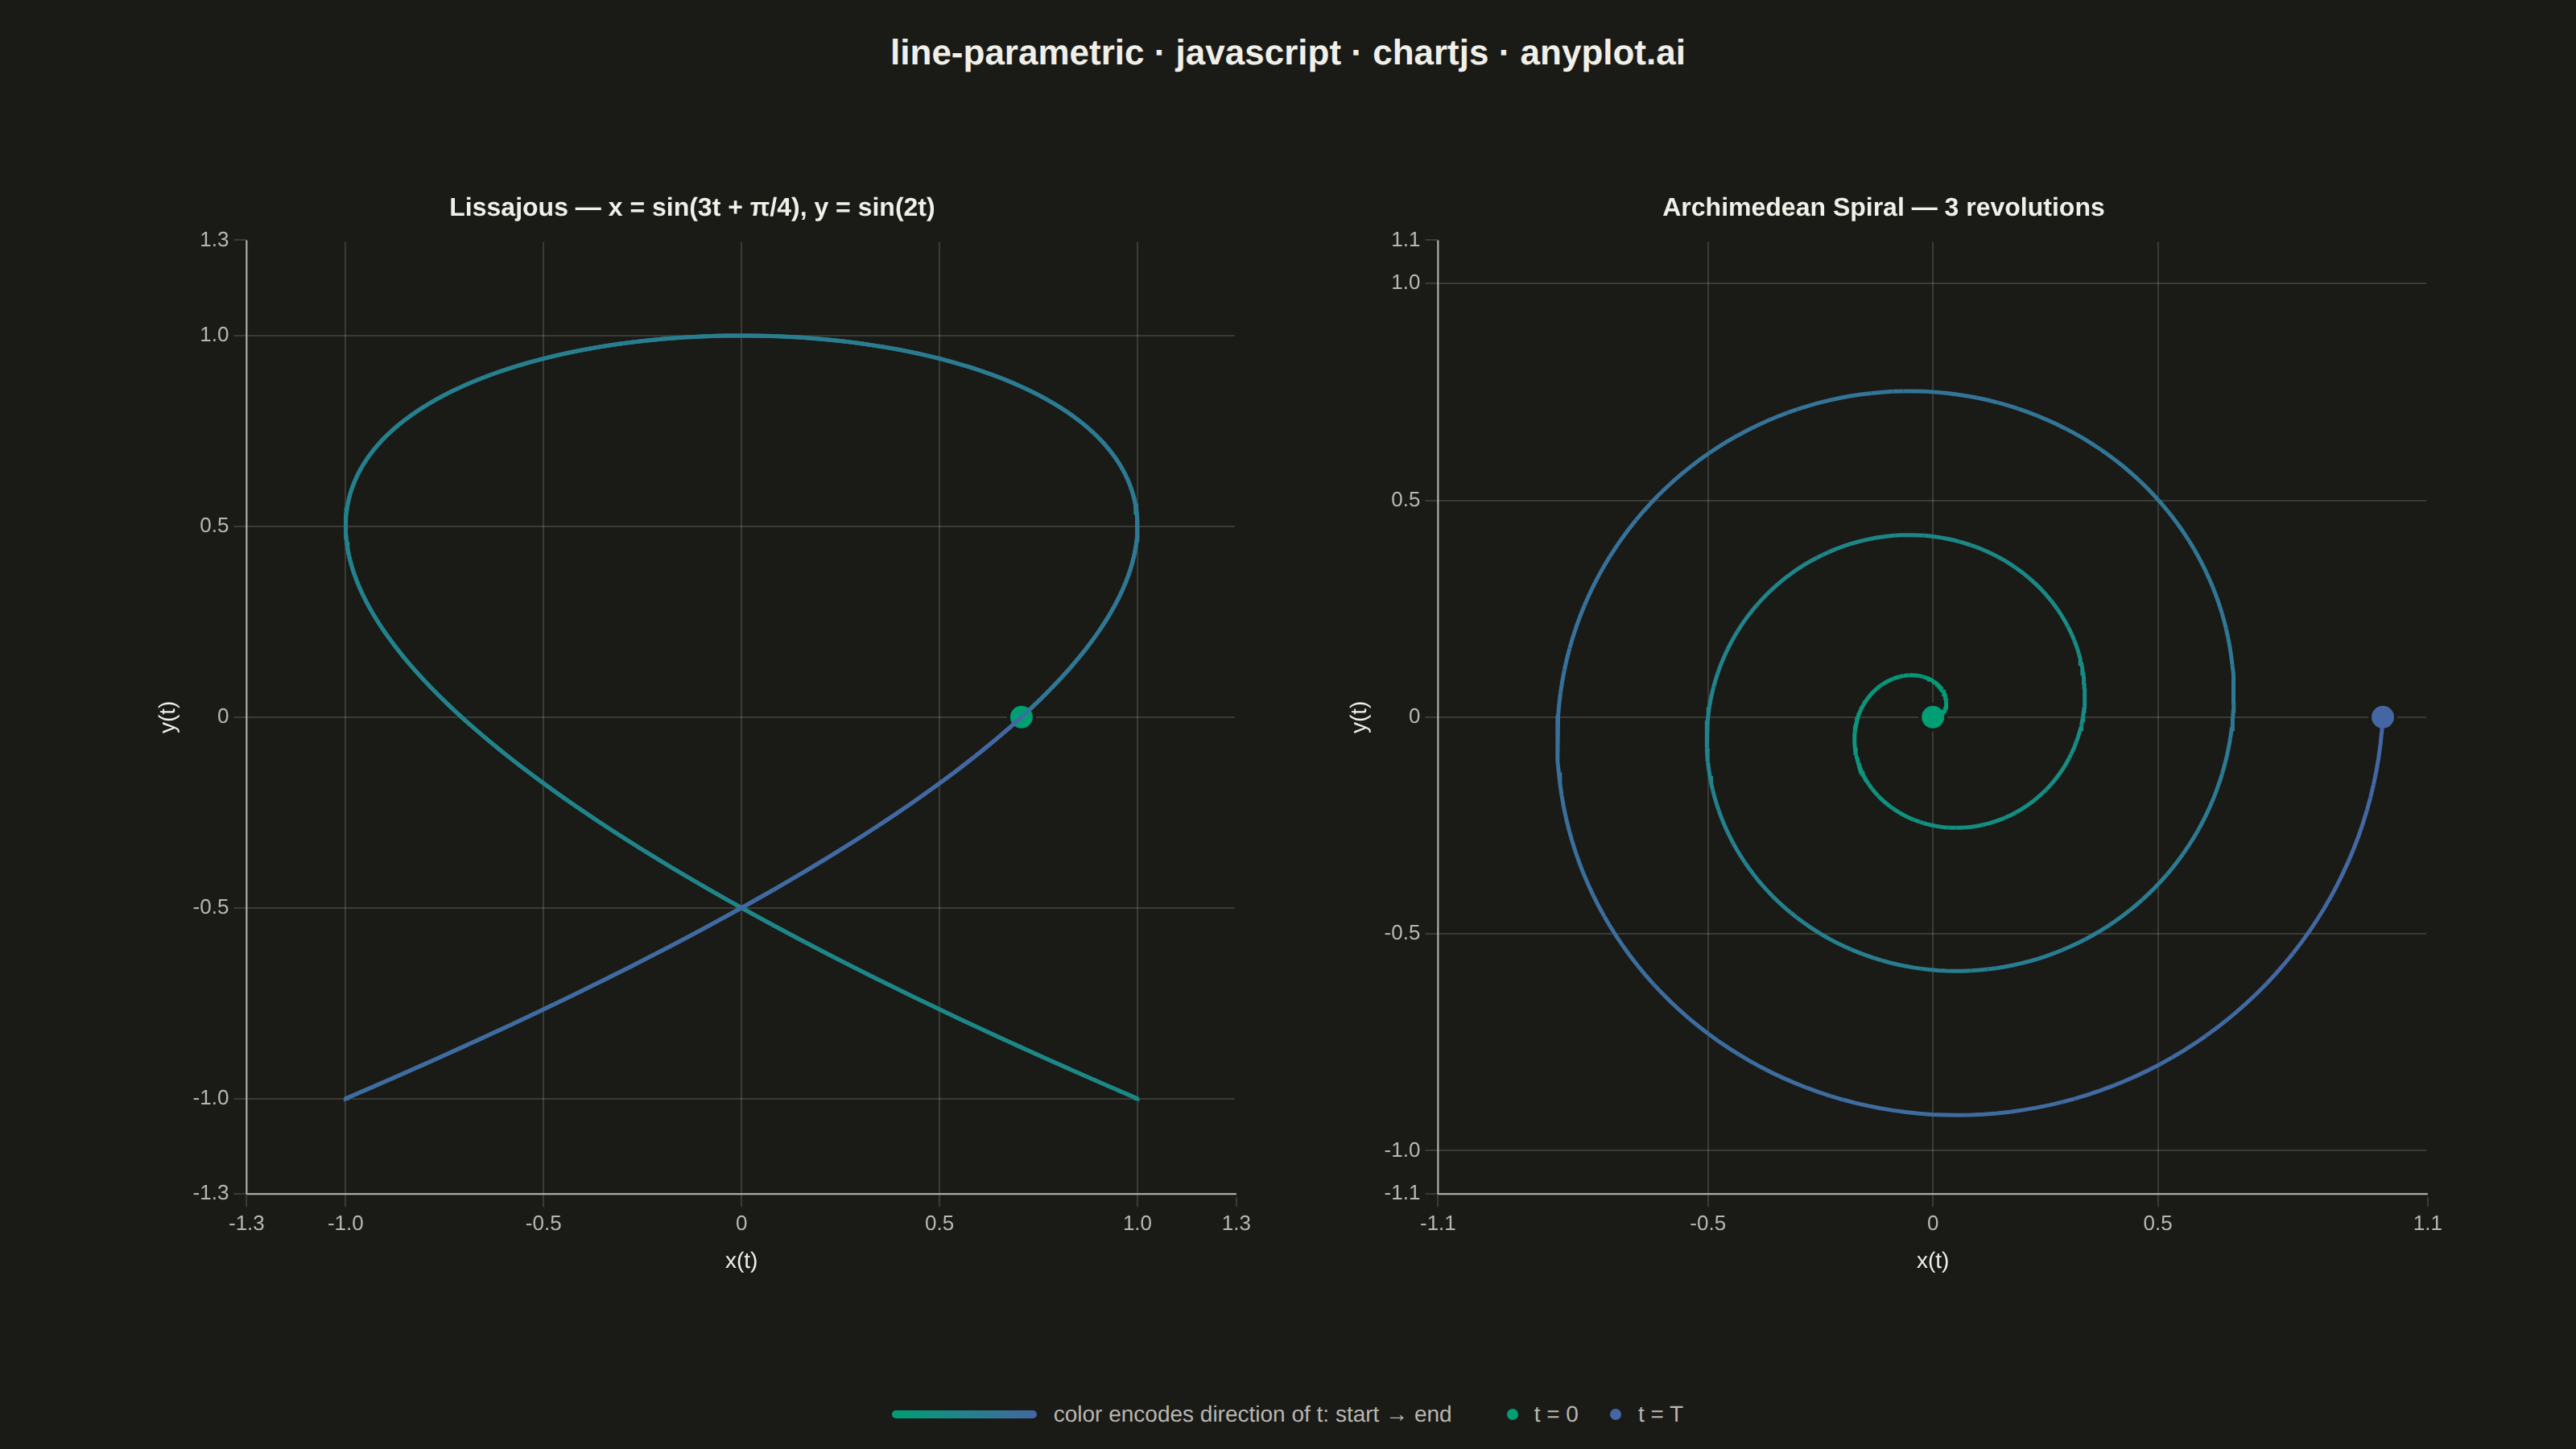
A parametric curve plot visualizes x(t) and y(t) as functions of a parameter t, tracing smooth curves in 2D space. Unlike standard function plots where y = f(x), parametric curves can loop, self-intersect, and form closed shapes such as Lissajous figures, spirals, and cardioids. This makes them essential for representing trajectories, oscillations, and classical mathematical curves that cannot be expressed as single-valued functions.
// anyplot.ai
// line-parametric: Parametric Curve Plot
// Library: chartjs 4.4.7 | JavaScript 22.22.3
// Quality: 93/100 | Created: 2026-06-20
const t = window.ANYPLOT_TOKENS;
const N = 600;
const TWO_PI = 2 * Math.PI;
const cs = t.seq[0];
const ce = t.seq[1];
// Pre-parse gradient endpoints for inline lerp in segment callback
const sr = parseInt(cs.slice(1, 3), 16);
const sg = parseInt(cs.slice(3, 5), 16);
const sb = parseInt(cs.slice(5, 7), 16);
const er = parseInt(ce.slice(1, 3), 16);
const eg = parseInt(ce.slice(3, 5), 16);
const eb = parseInt(ce.slice(5, 7), 16);
// Lissajous figure: 3:2 frequency ratio, phase shift π/4
const lissData = [];
for (let i = 0; i < N; i++) {
const ti = TWO_PI * i / (N - 1);
lissData.push({ x: Math.sin(3 * ti + Math.PI / 4), y: Math.sin(2 * ti) });
}
// Archimedean spiral: 3 revolutions, radius normalized to [0, 1]
const spiralData = [];
for (let i = 0; i < N; i++) {
const ti = 3 * TWO_PI * i / (N - 1);
spiralData.push({ x: (ti / (3 * TWO_PI)) * Math.cos(ti), y: (ti / (3 * TWO_PI)) * Math.sin(ti) });
}
const container = document.getElementById("container");
container.style.cssText = `
display: flex;
flex-direction: column;
background: ${t.pageBg};
padding: 0 40px;
box-sizing: border-box;
`;
const titleDiv = document.createElement("div");
titleDiv.style.cssText = `
text-align: center;
color: ${t.ink};
font: 600 22px/1.4 sans-serif;
padding: 18px 0 6px;
flex-shrink: 0;
`;
titleDiv.textContent = "line-parametric · javascript · chartjs · anyplot.ai";
container.appendChild(titleDiv);
const row = document.createElement("div");
row.style.cssText = `
display: flex;
flex: 1;
justify-content: space-evenly;
align-items: center;
`;
container.appendChild(row);
const legendDiv = document.createElement("div");
legendDiv.style.cssText = `
display: flex;
justify-content: center;
align-items: center;
gap: 32px;
padding: 8px 0 14px;
flex-shrink: 0;
`;
legendDiv.innerHTML = `
<div style="display:flex;align-items:center;gap:10px;font:14px sans-serif;color:${t.inkSoft};">
<span style="display:inline-block;width:90px;height:5px;background:linear-gradient(to right,${cs},${ce});border-radius:3px;"></span>
<span>color encodes direction of t: start → end</span>
</div>
<div style="display:flex;align-items:center;gap:8px;font:14px sans-serif;color:${t.inkSoft};">
<span style="display:inline-block;width:11px;height:11px;border-radius:50%;background:${cs};border:2px solid ${t.pageBg};"></span>
<span>t = 0</span>
<span style="display:inline-block;width:11px;height:11px;border-radius:50%;background:${ce};border:2px solid ${t.pageBg};margin-left:10px;"></span>
<span>t = T</span>
</div>
`;
container.appendChild(legendDiv);
// Plugin: remove top/right chart borders, draw only bottom + left (L-shaped frame)
const lShapePlugin = {
id: "lShape",
afterDraw(chart) {
const { ctx, chartArea: { left, right, top, bottom } } = chart;
ctx.save();
// Erase top and right axis borders with background color
ctx.fillStyle = t.pageBg;
ctx.fillRect(left, top - 2, right - left + 2, 3);
ctx.fillRect(right - 1, top, 3, bottom - top + 2);
// Draw explicit bottom and left spines
ctx.strokeStyle = t.inkSoft;
ctx.lineWidth = 1;
ctx.beginPath();
ctx.moveTo(left, bottom);
ctx.lineTo(right, bottom);
ctx.moveTo(left, top);
ctx.lineTo(left, bottom);
ctx.stroke();
ctx.restore();
},
};
const panels = [
{ data: lissData, subtitle: "Lissajous — x = sin(3t + π/4), y = sin(2t)", range: [-1.25, 1.25] },
{ data: spiralData, subtitle: "Archimedean Spiral — 3 revolutions", range: [-1.1, 1.1] },
];
for (const { data, subtitle, range } of panels) {
const div = document.createElement("div");
div.style.cssText = "width: 700px; height: 700px;";
const canvas = document.createElement("canvas");
div.appendChild(canvas);
row.appendChild(div);
new Chart(canvas, {
type: "scatter",
plugins: [lShapePlugin],
data: {
datasets: [
{
label: subtitle,
data,
showLine: true,
pointRadius: 0,
borderWidth: 2.5,
segment: {
borderColor: ctx => {
const ratio = Math.max(0, Math.min(1, ctx.p0DataIndex / (N - 2)));
return `rgb(${Math.round(sr + (er - sr) * ratio)},${Math.round(sg + (eg - sg) * ratio)},${Math.round(sb + (eb - sb) * ratio)})`;
},
},
},
{
data: [data[0]],
pointRadius: 8,
pointHoverRadius: 8,
pointBackgroundColor: cs,
pointBorderColor: t.pageBg,
pointBorderWidth: 2,
showLine: false,
label: "t = 0",
},
{
data: [data[data.length - 1]],
pointRadius: 8,
pointHoverRadius: 8,
pointBackgroundColor: ce,
pointBorderColor: t.pageBg,
pointBorderWidth: 2,
showLine: false,
label: "t = T",
},
],
},
options: {
responsive: true,
maintainAspectRatio: false,
animation: false,
plugins: {
title: {
display: true,
text: subtitle,
color: t.ink,
font: { size: 16, weight: "600" },
padding: { bottom: 10 },
},
legend: { display: false },
},
scales: {
x: {
min: range[0],
max: range[1],
ticks: { color: t.inkSoft, font: { size: 13 }, maxTicksLimit: 7 },
grid: { color: t.grid },
title: { display: true, text: "x(t)", color: t.ink, font: { size: 14 } },
border: { display: false },
},
y: {
min: range[0],
max: range[1],
ticks: { color: t.inkSoft, font: { size: 13 }, maxTicksLimit: 7 },
grid: { color: t.grid },
title: { display: true, text: "y(t)", color: t.ink, font: { size: 14 } },
border: { display: false },
},
},
layout: { padding: 12 },
},
});
}
Runnable source as JSON, for any HTTP client: https://api.anyplot.ai/specs/line-parametric/chartjs/code. Any spec id and library id listed in llms-full.txt fit the same URL shape; every URL below is complete and callable.
{
  "spec_id": "line-parametric",
  "language": "javascript",
  "library": "chartjs",
  "page": "https://anyplot.ai/line-parametric/javascript/chartjs",
  "hub": "https://anyplot.ai/line-parametric",
  "code_json": "https://api.anyplot.ai/specs/line-parametric/chartjs/code",
  "spec_json": "https://api.anyplot.ai/specs/line-parametric",
  "render_light_png": "https://storage.googleapis.com/anyplot-images/plots/line-parametric/javascript/chartjs/plot-light.png",
  "render_dark_png": "https://storage.googleapis.com/anyplot-images/plots/line-parametric/javascript/chartjs/plot-dark.png",
  "interactive_light_html": "https://storage.googleapis.com/anyplot-images/plots/line-parametric/javascript/chartjs/plot-light.html",
  "interactive_dark_html": "https://storage.googleapis.com/anyplot-images/plots/line-parametric/javascript/chartjs/plot-dark.html",
  "quality_score": 93.0,
  "license": "MIT",
  "guide": "https://anyplot.ai/llms.txt"
}
Part of Parametric Curve Plot on anyplot.ai.