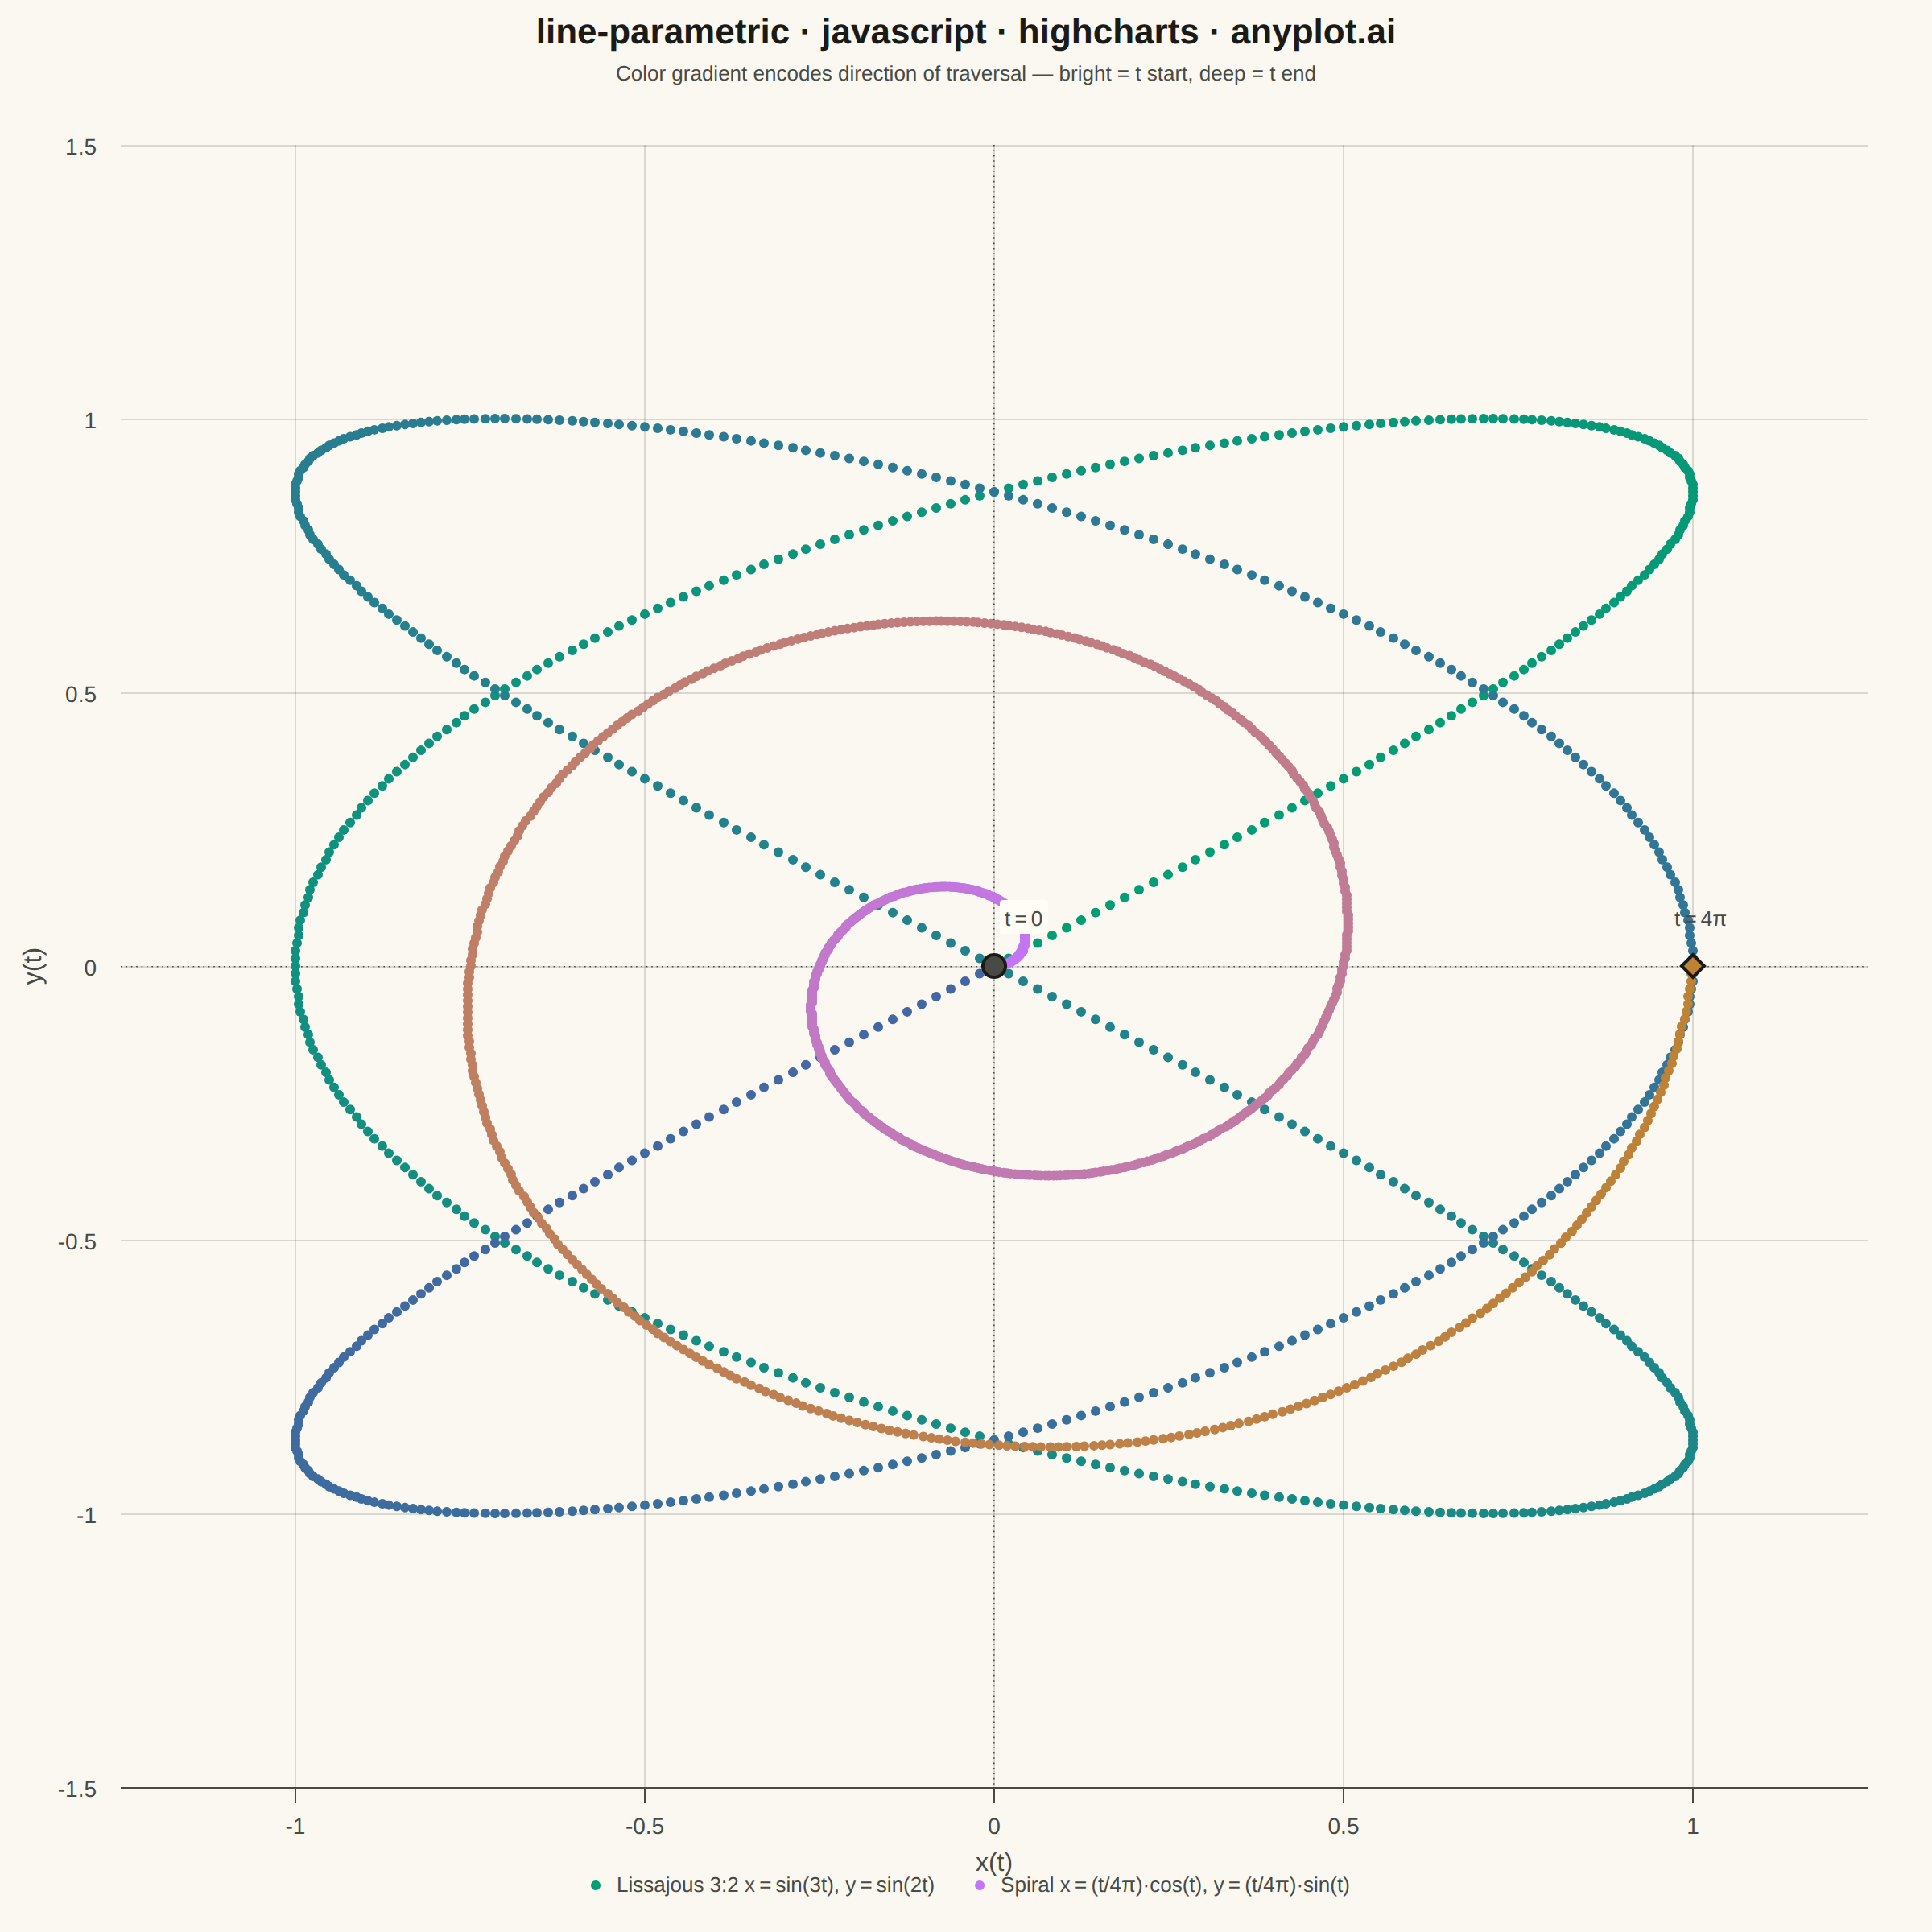
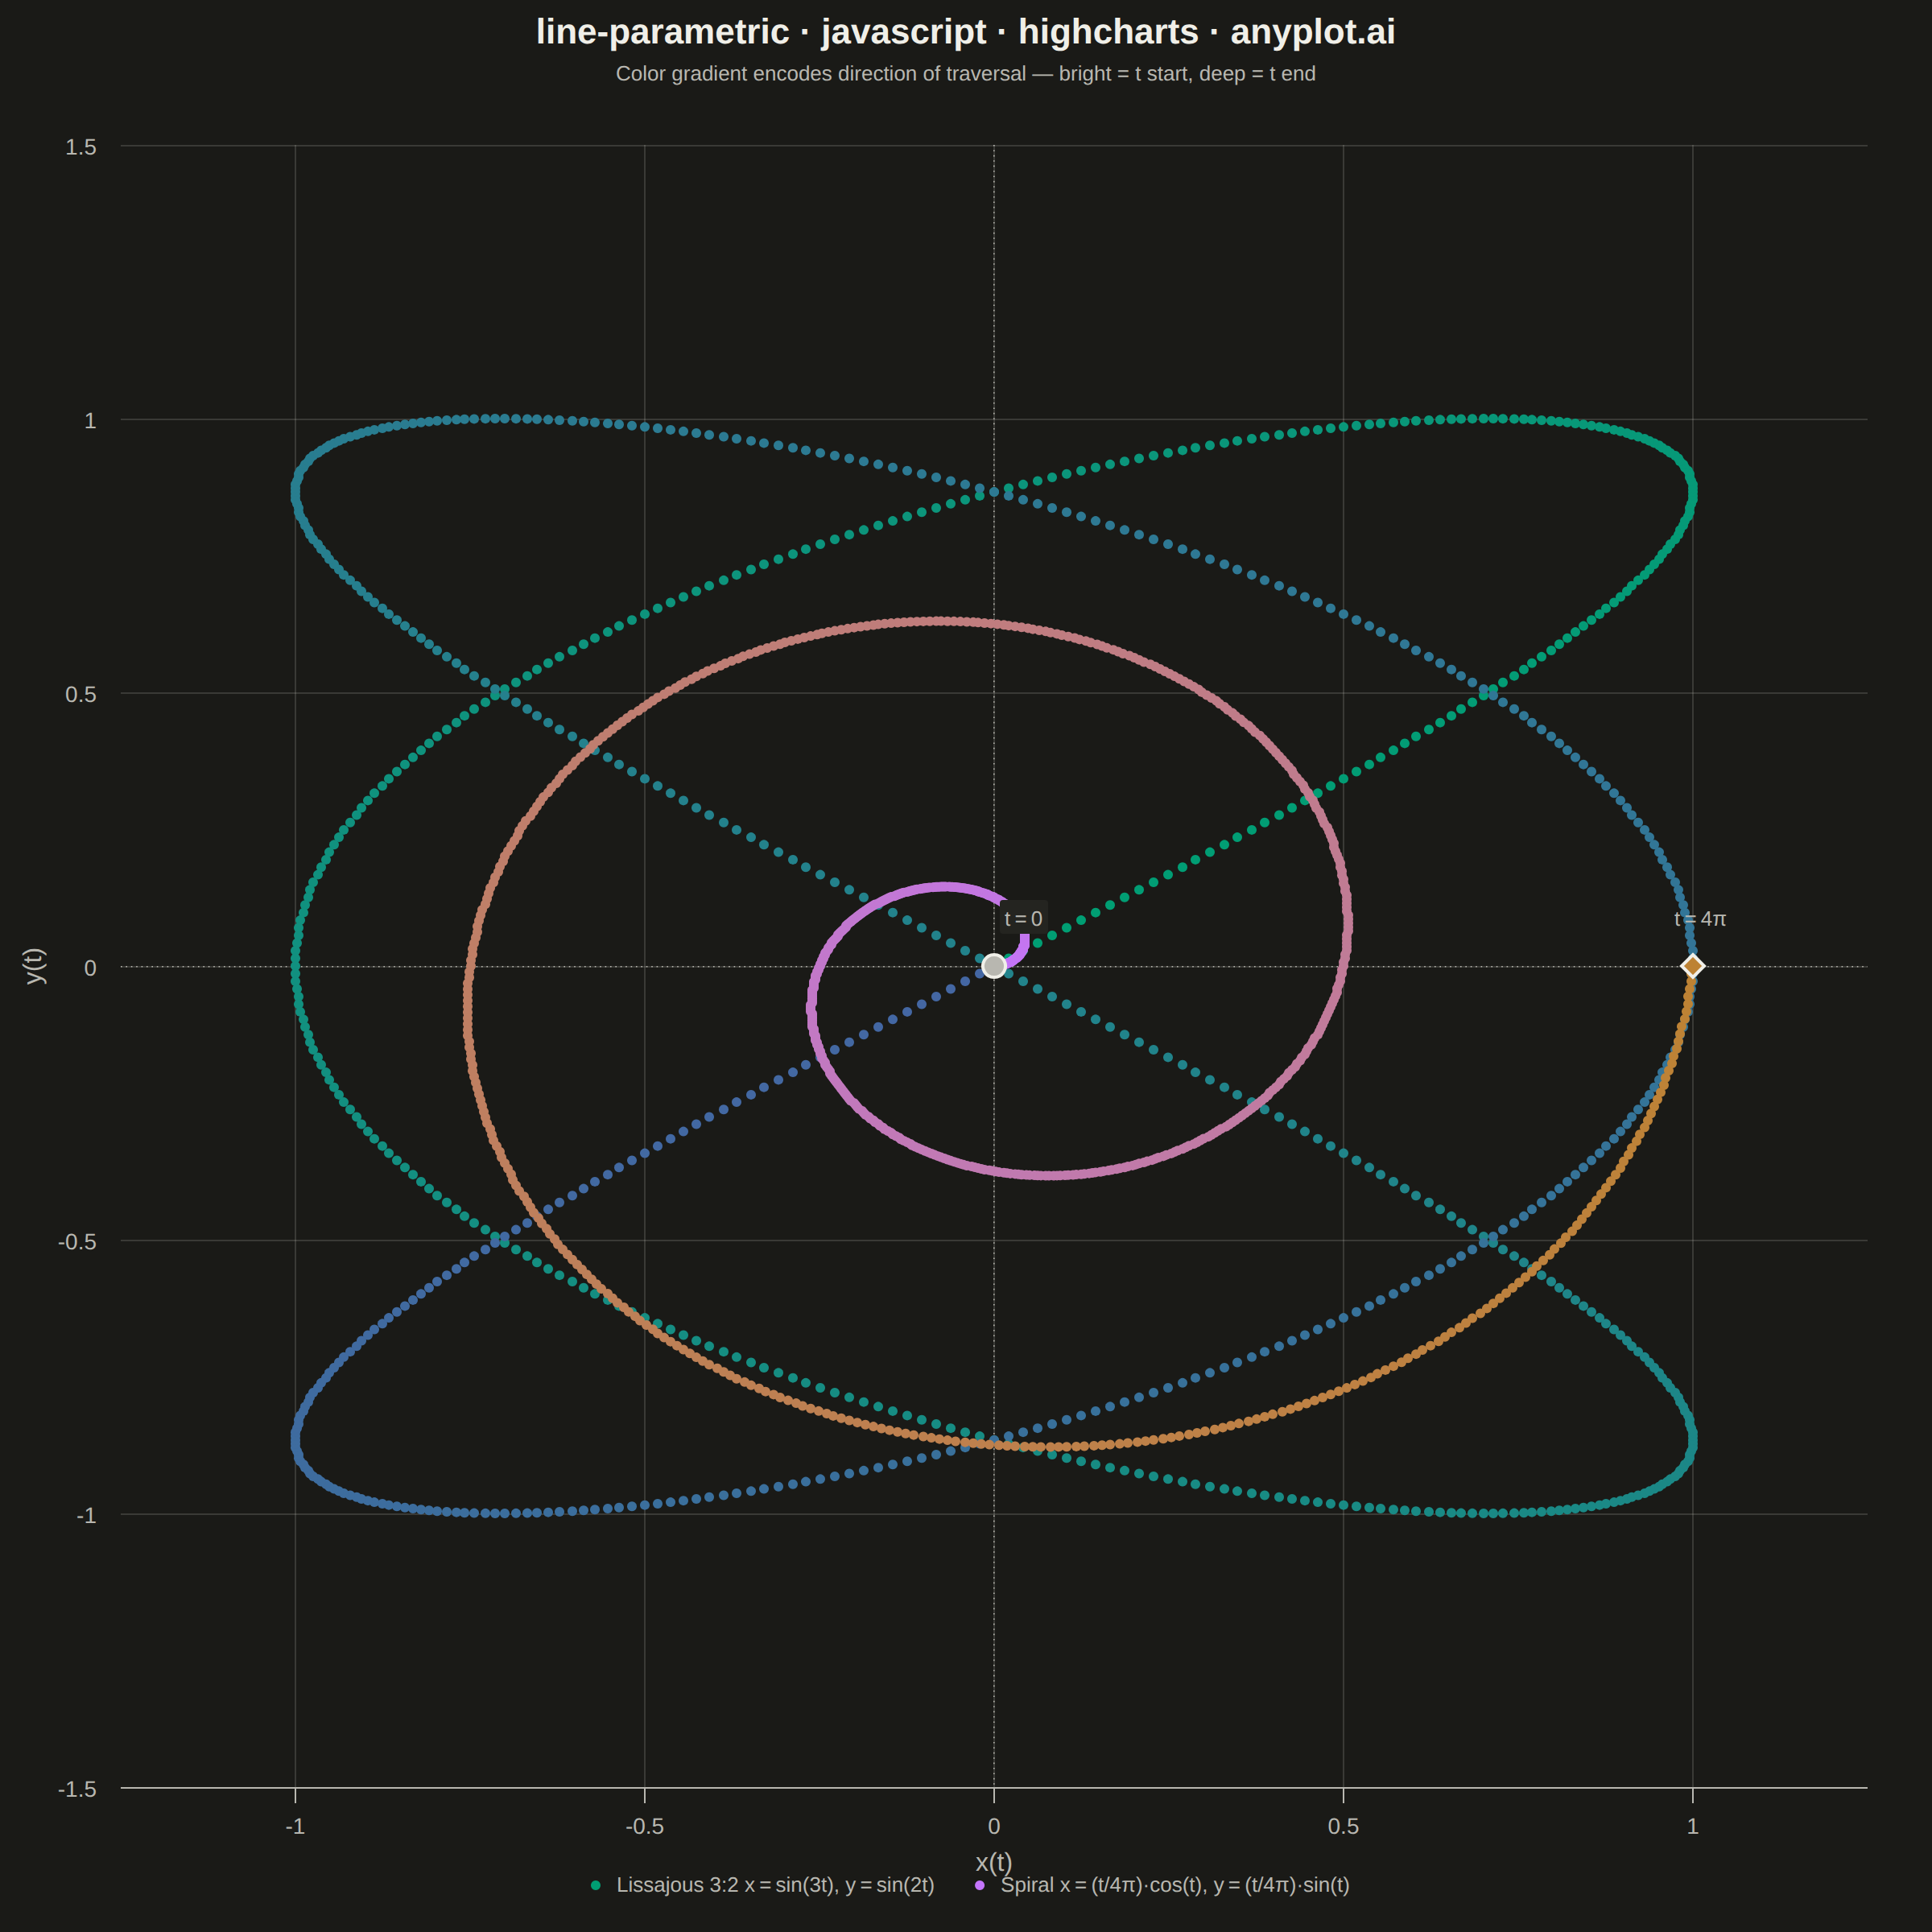
The same plot in 14 other libraries — JavaScript: Chart.js, D3.js, Apache ECharts, MUI X Charts; Python: Altair, Bokeh, lets-plot, Matplotlib, Plotly, plotnine, Pygal, Seaborn; R: ggplot2; Julia: Makie.jl. Compare all 15 side by side: Parametric Curve Plot in Python, R, Julia and JavaScript.
A parametric curve plot visualizes x(t) and y(t) as functions of a parameter t, tracing smooth curves in 2D space. Unlike standard function plots where y = f(x), parametric curves can loop, self-intersect, and form closed shapes such as Lissajous figures, spirals, and cardioids. This makes them essential for representing trajectories, oscillations, and classical mathematical curves that cannot be expressed as single-valued functions.
// anyplot.ai
// line-parametric: Parametric Curve Plot
// Library: highcharts 12.6.0 | JavaScript 22.22.3
// Quality: 85/100 | Created: 2026-06-20

//# anyplot-orientation: square

const tok = window.ANYPLOT_TOKENS;

// --- Color interpolation (Imprint gradient along curve = direction cue) ----
function hexToRgb(hex) {
  return [
    parseInt(hex.slice(1, 3), 16),
    parseInt(hex.slice(3, 5), 16),
    parseInt(hex.slice(5, 7), 16)
  ];
}

function lerpHex(hex1, hex2, f) {
  const [r1, g1, b1] = hexToRgb(hex1);
  const [r2, g2, b2] = hexToRgb(hex2);
  return (
    'rgb(' +
    Math.round(r1 + (r2 - r1) * f) + ',' +
    Math.round(g1 + (g2 - g1) * f) + ',' +
    Math.round(b1 + (b2 - b1) * f) + ')'
  );
}

// --- Parametric curve data -------------------------------------------------
const N = 900;

// Lissajous figure: x = sin(3t), y = sin(2t), t ∈ [0, 2π]
// Direction: Imprint sequential (green → blue)
const lissData = [];
for (let i = 0; i <= N; i++) {
  const p = (i / N) * 2 * Math.PI;
  lissData.push({
    x: Math.sin(3 * p),
    y: Math.sin(2 * p),
    color: lerpHex('#009E73', '#4467A3', i / N)
  });
}

// Archimedean spiral: x = (t/T)·cos(t), y = (t/T)·sin(t), T=4π, radius ∈ [0,1]
// Direction: Imprint lavender → ochre
const spiralData = [];
const T_SPIRAL = 4 * Math.PI;
for (let i = 0; i <= N; i++) {
  const p = (i / N) * T_SPIRAL;
  spiralData.push({
    x: (p / T_SPIRAL) * Math.cos(p),
    y: (p / T_SPIRAL) * Math.sin(p),
    color: lerpHex('#C475FD', '#BD8233', i / N)
  });
}

// --- Chart -----------------------------------------------------------------
Highcharts.chart('container', {
  chart: {
    type: 'scatter',
    backgroundColor: 'transparent',
    animation: false,
    style: { fontFamily: 'inherit' },
    margin: [90, 40, 90, 75],
    plotBorderWidth: 0
  },
  credits: { enabled: false },
  colors: tok.palette,

  title: {
    text: 'line-parametric · javascript · highcharts · anyplot.ai',
    style: { color: tok.ink, fontSize: '22px', fontWeight: '600' }
  },
  subtitle: {
    text: 'Color gradient encodes direction of traversal — bright = t start, deep = t end',
    style: { color: tok.inkSoft, fontSize: '13px' }
  },

  xAxis: {
    title: { text: 'x(t)', style: { color: tok.inkSoft, fontSize: '16px' } },
    min: -1.25, max: 1.25,
    tickInterval: 0.5,
    lineColor: tok.inkSoft,
    tickColor: tok.inkSoft,
    gridLineColor: tok.grid,
    gridLineWidth: 1,
    labels: { style: { color: tok.inkSoft, fontSize: '14px' } },
    plotLines: [{
      value: 0, color: tok.inkSoft, width: 0.8, zIndex: 2,
      dashStyle: 'Dot'
    }]
  },

  yAxis: {
    title: { text: 'y(t)', style: { color: tok.inkSoft, fontSize: '16px' } },
    min: -1.25, max: 1.25,
    tickInterval: 0.5,
    lineColor: tok.inkSoft,
    tickColor: tok.inkSoft,
    gridLineColor: tok.grid,
    gridLineWidth: 1,
    labels: { style: { color: tok.inkSoft, fontSize: '14px' } },
    plotLines: [{
      value: 0, color: tok.inkSoft, width: 0.8, zIndex: 2,
      dashStyle: 'Dot'
    }]
  },

  legend: {
    enabled: true,
    itemStyle: { color: tok.inkSoft, fontSize: '13px' },
    itemHoverStyle: { color: tok.ink },
    symbolRadius: 4
  },

  plotOptions: {
    series: { animation: false, turboThreshold: 0, enableMouseTracking: false },
    scatter: {
      marker: { radius: 3, symbol: 'circle', lineWidth: 0 },
      states: { hover: { enabled: false } }
    }
  },

  series: [
    // --- Lissajous figure (3:2) ---
    {
      name: 'Lissajous 3:2   x = sin(3t),  y = sin(2t)',
      type: 'scatter',
      data: lissData,
      color: '#009E73',
      showInLegend: true
    },
    // --- Archimedean spiral ---
    {
      name: 'Spiral   x = (t/4π)·cos(t),  y = (t/4π)·sin(t)',
      type: 'scatter',
      data: spiralData,
      color: '#C475FD',
      showInLegend: true
    },
    // --- Start marker (both curves begin at origin) ---
    {
      name: 'Start t = 0',
      type: 'scatter',
      data: [{ x: 0.0, y: 0.0 }],
      color: tok.inkSoft,
      marker: { radius: 7, symbol: 'circle', lineWidth: 2, lineColor: tok.ink },
      dataLabels: {
        enabled: true,
        formatter: function () { return 't = 0'; },
        style: { color: tok.inkSoft, fontSize: '13px', fontWeight: '400', textOutline: 'none' },
        backgroundColor: tok.elevatedBg,
        borderRadius: 2,
        padding: 3,
        x: 18, y: -20
      },
      showInLegend: false
    },
    // --- Spiral end marker at (1, 0) ---
    {
      name: 'Spiral end t = 4π',
      type: 'scatter',
      data: [{ x: 1.0, y: 0.0 }],
      color: '#BD8233',
      marker: { radius: 7, symbol: 'diamond', lineWidth: 2, lineColor: tok.ink },
      dataLabels: {
        enabled: true,
        formatter: function () { return 't = 4π'; },
        style: { color: tok.inkSoft, fontSize: '13px', fontWeight: '400', textOutline: 'none' },
        x: 5, y: -18
      },
      showInLegend: false
    }
  ]
});
Runnable source as JSON, for any HTTP client: https://api.anyplot.ai/specs/line-parametric/highcharts/code. Any spec id and library id listed in llms-full.txt fit the same URL shape; every URL below is complete and callable.
{
  "spec_id": "line-parametric",
  "language": "javascript",
  "library": "highcharts",
  "page": "https://anyplot.ai/line-parametric/javascript/highcharts",
  "hub": "https://anyplot.ai/line-parametric",
  "code_json": "https://api.anyplot.ai/specs/line-parametric/highcharts/code",
  "spec_json": "https://api.anyplot.ai/specs/line-parametric",
  "render_light_png": "https://storage.googleapis.com/anyplot-images/plots/line-parametric/javascript/highcharts/plot-light.png",
  "render_dark_png": "https://storage.googleapis.com/anyplot-images/plots/line-parametric/javascript/highcharts/plot-dark.png",
  "interactive_light_html": "https://storage.googleapis.com/anyplot-images/plots/line-parametric/javascript/highcharts/plot-light.html",
  "interactive_dark_html": "https://storage.googleapis.com/anyplot-images/plots/line-parametric/javascript/highcharts/plot-dark.html",
  "quality_score": 85.0,
  "license": "MIT",
  "guide": "https://anyplot.ai/llms.txt"
}
Part of Parametric Curve Plot on anyplot.ai.