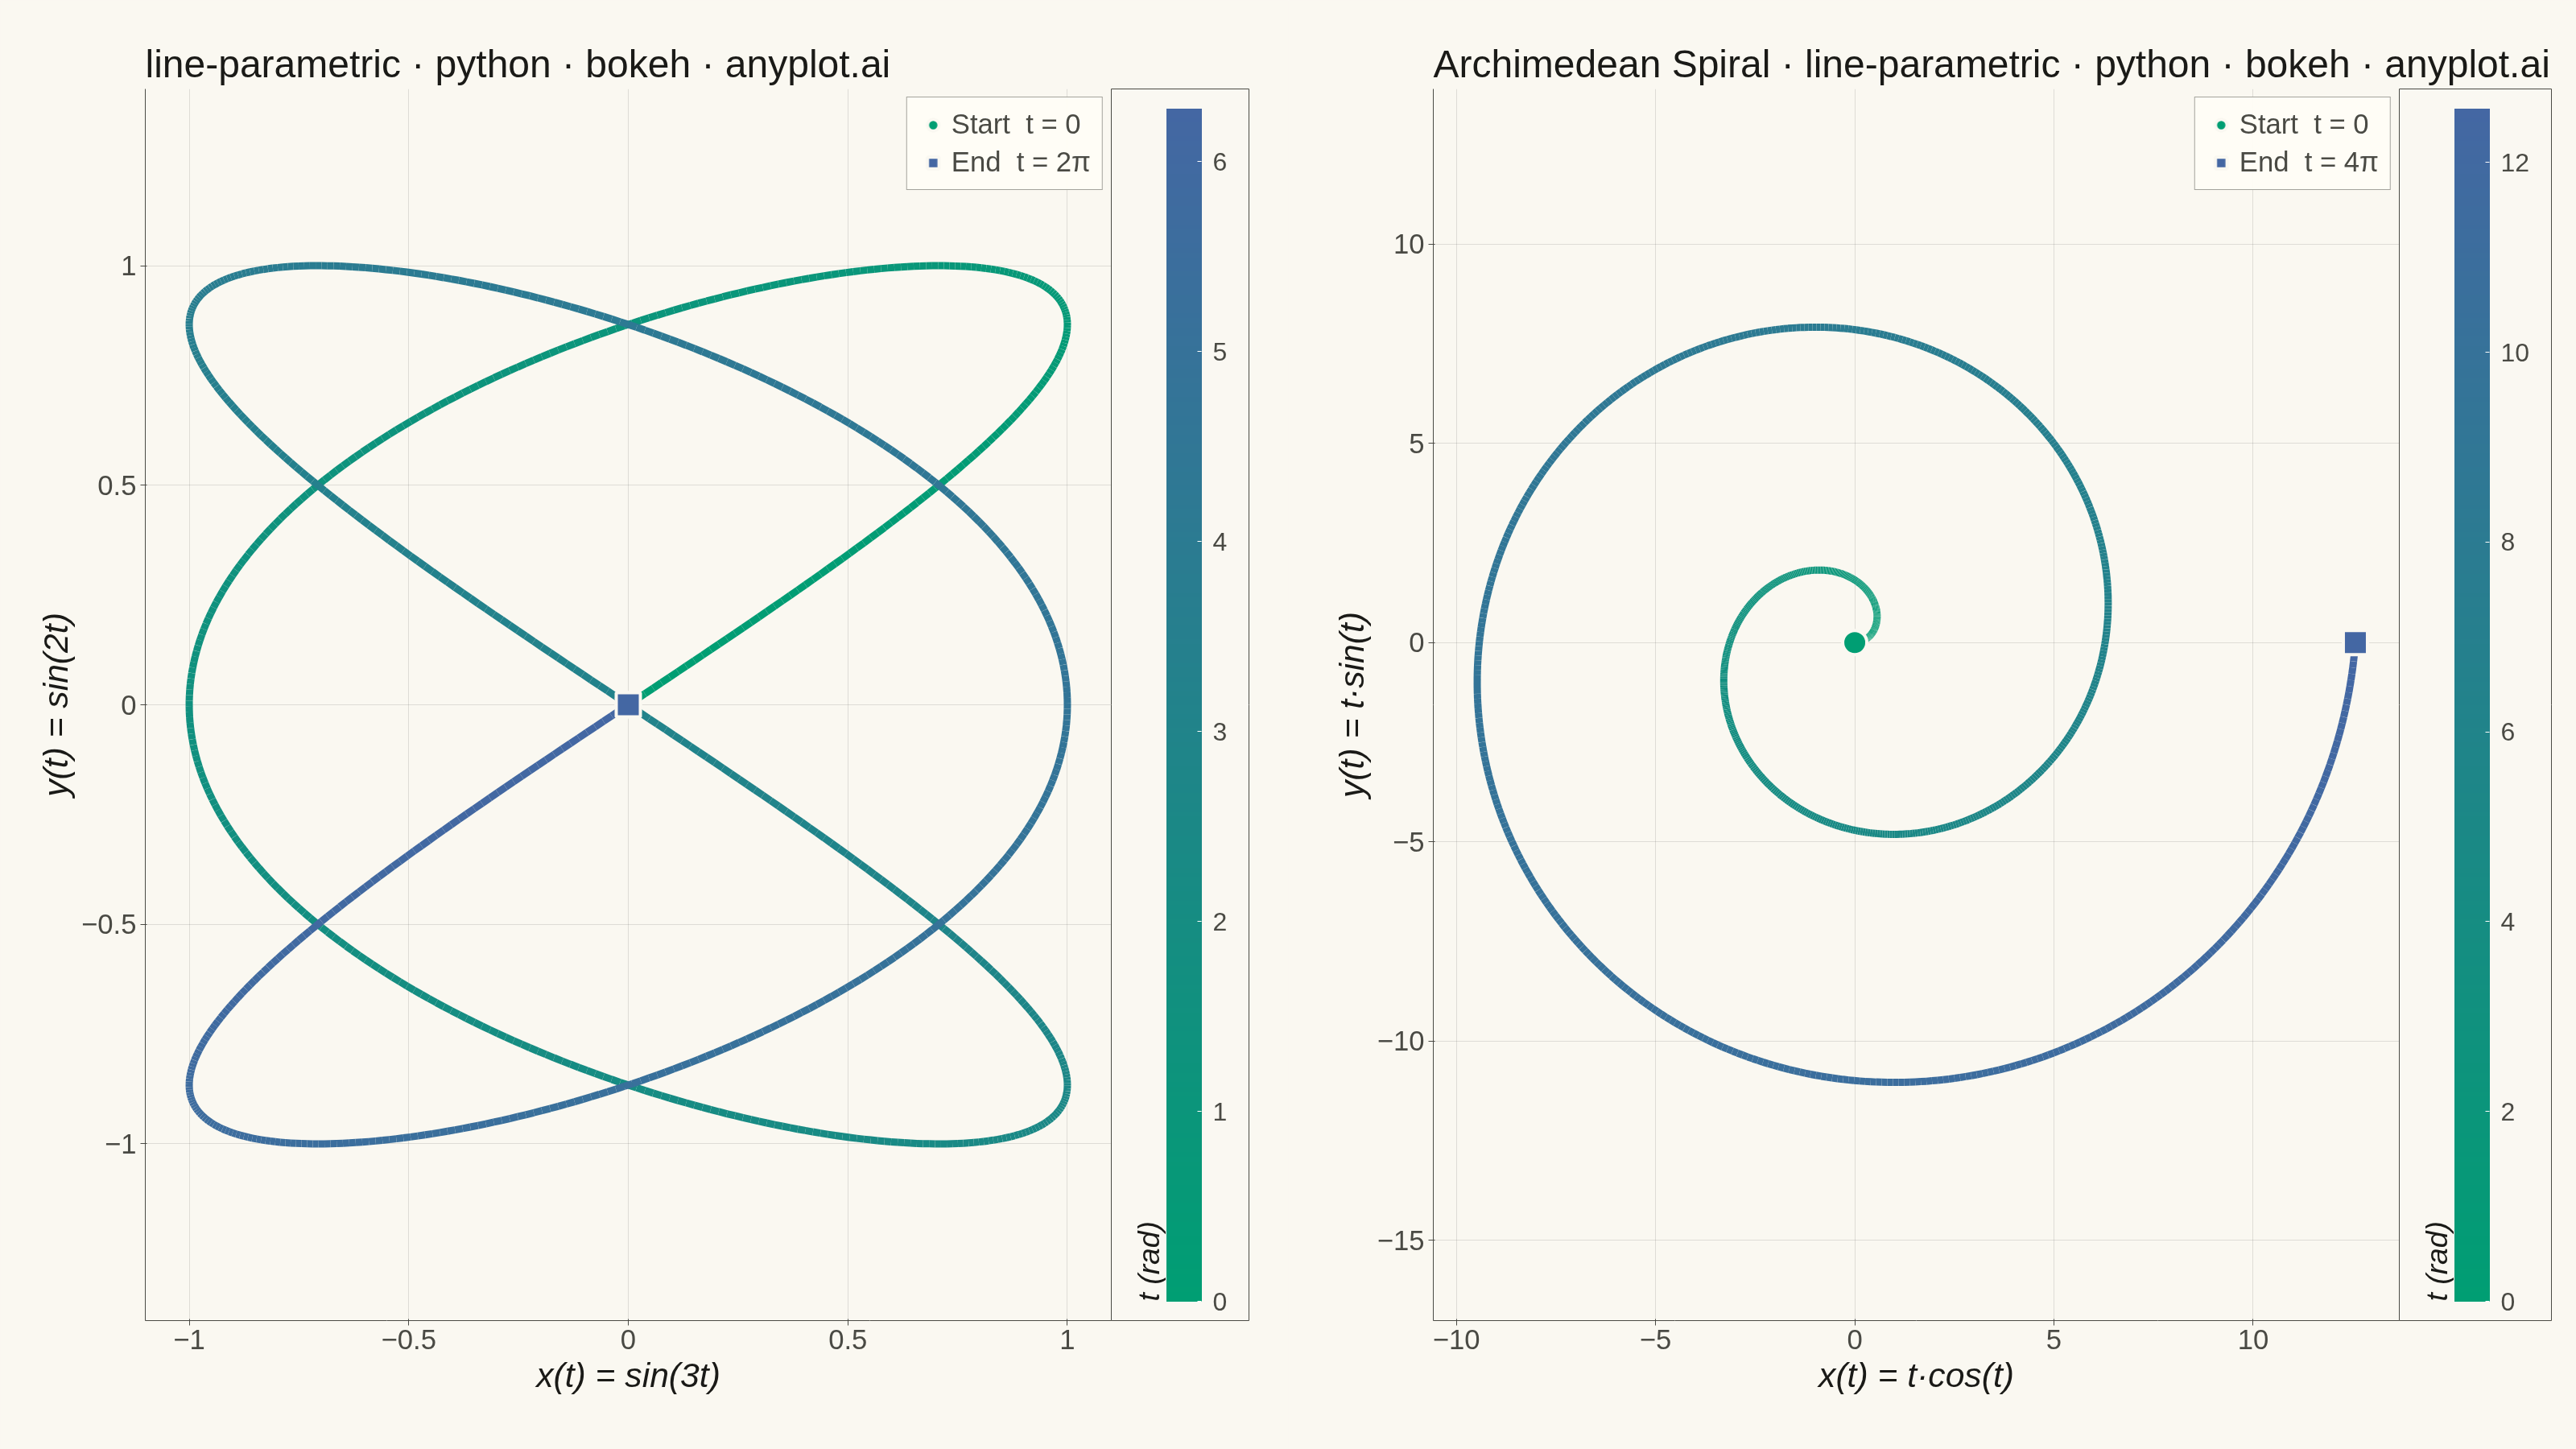
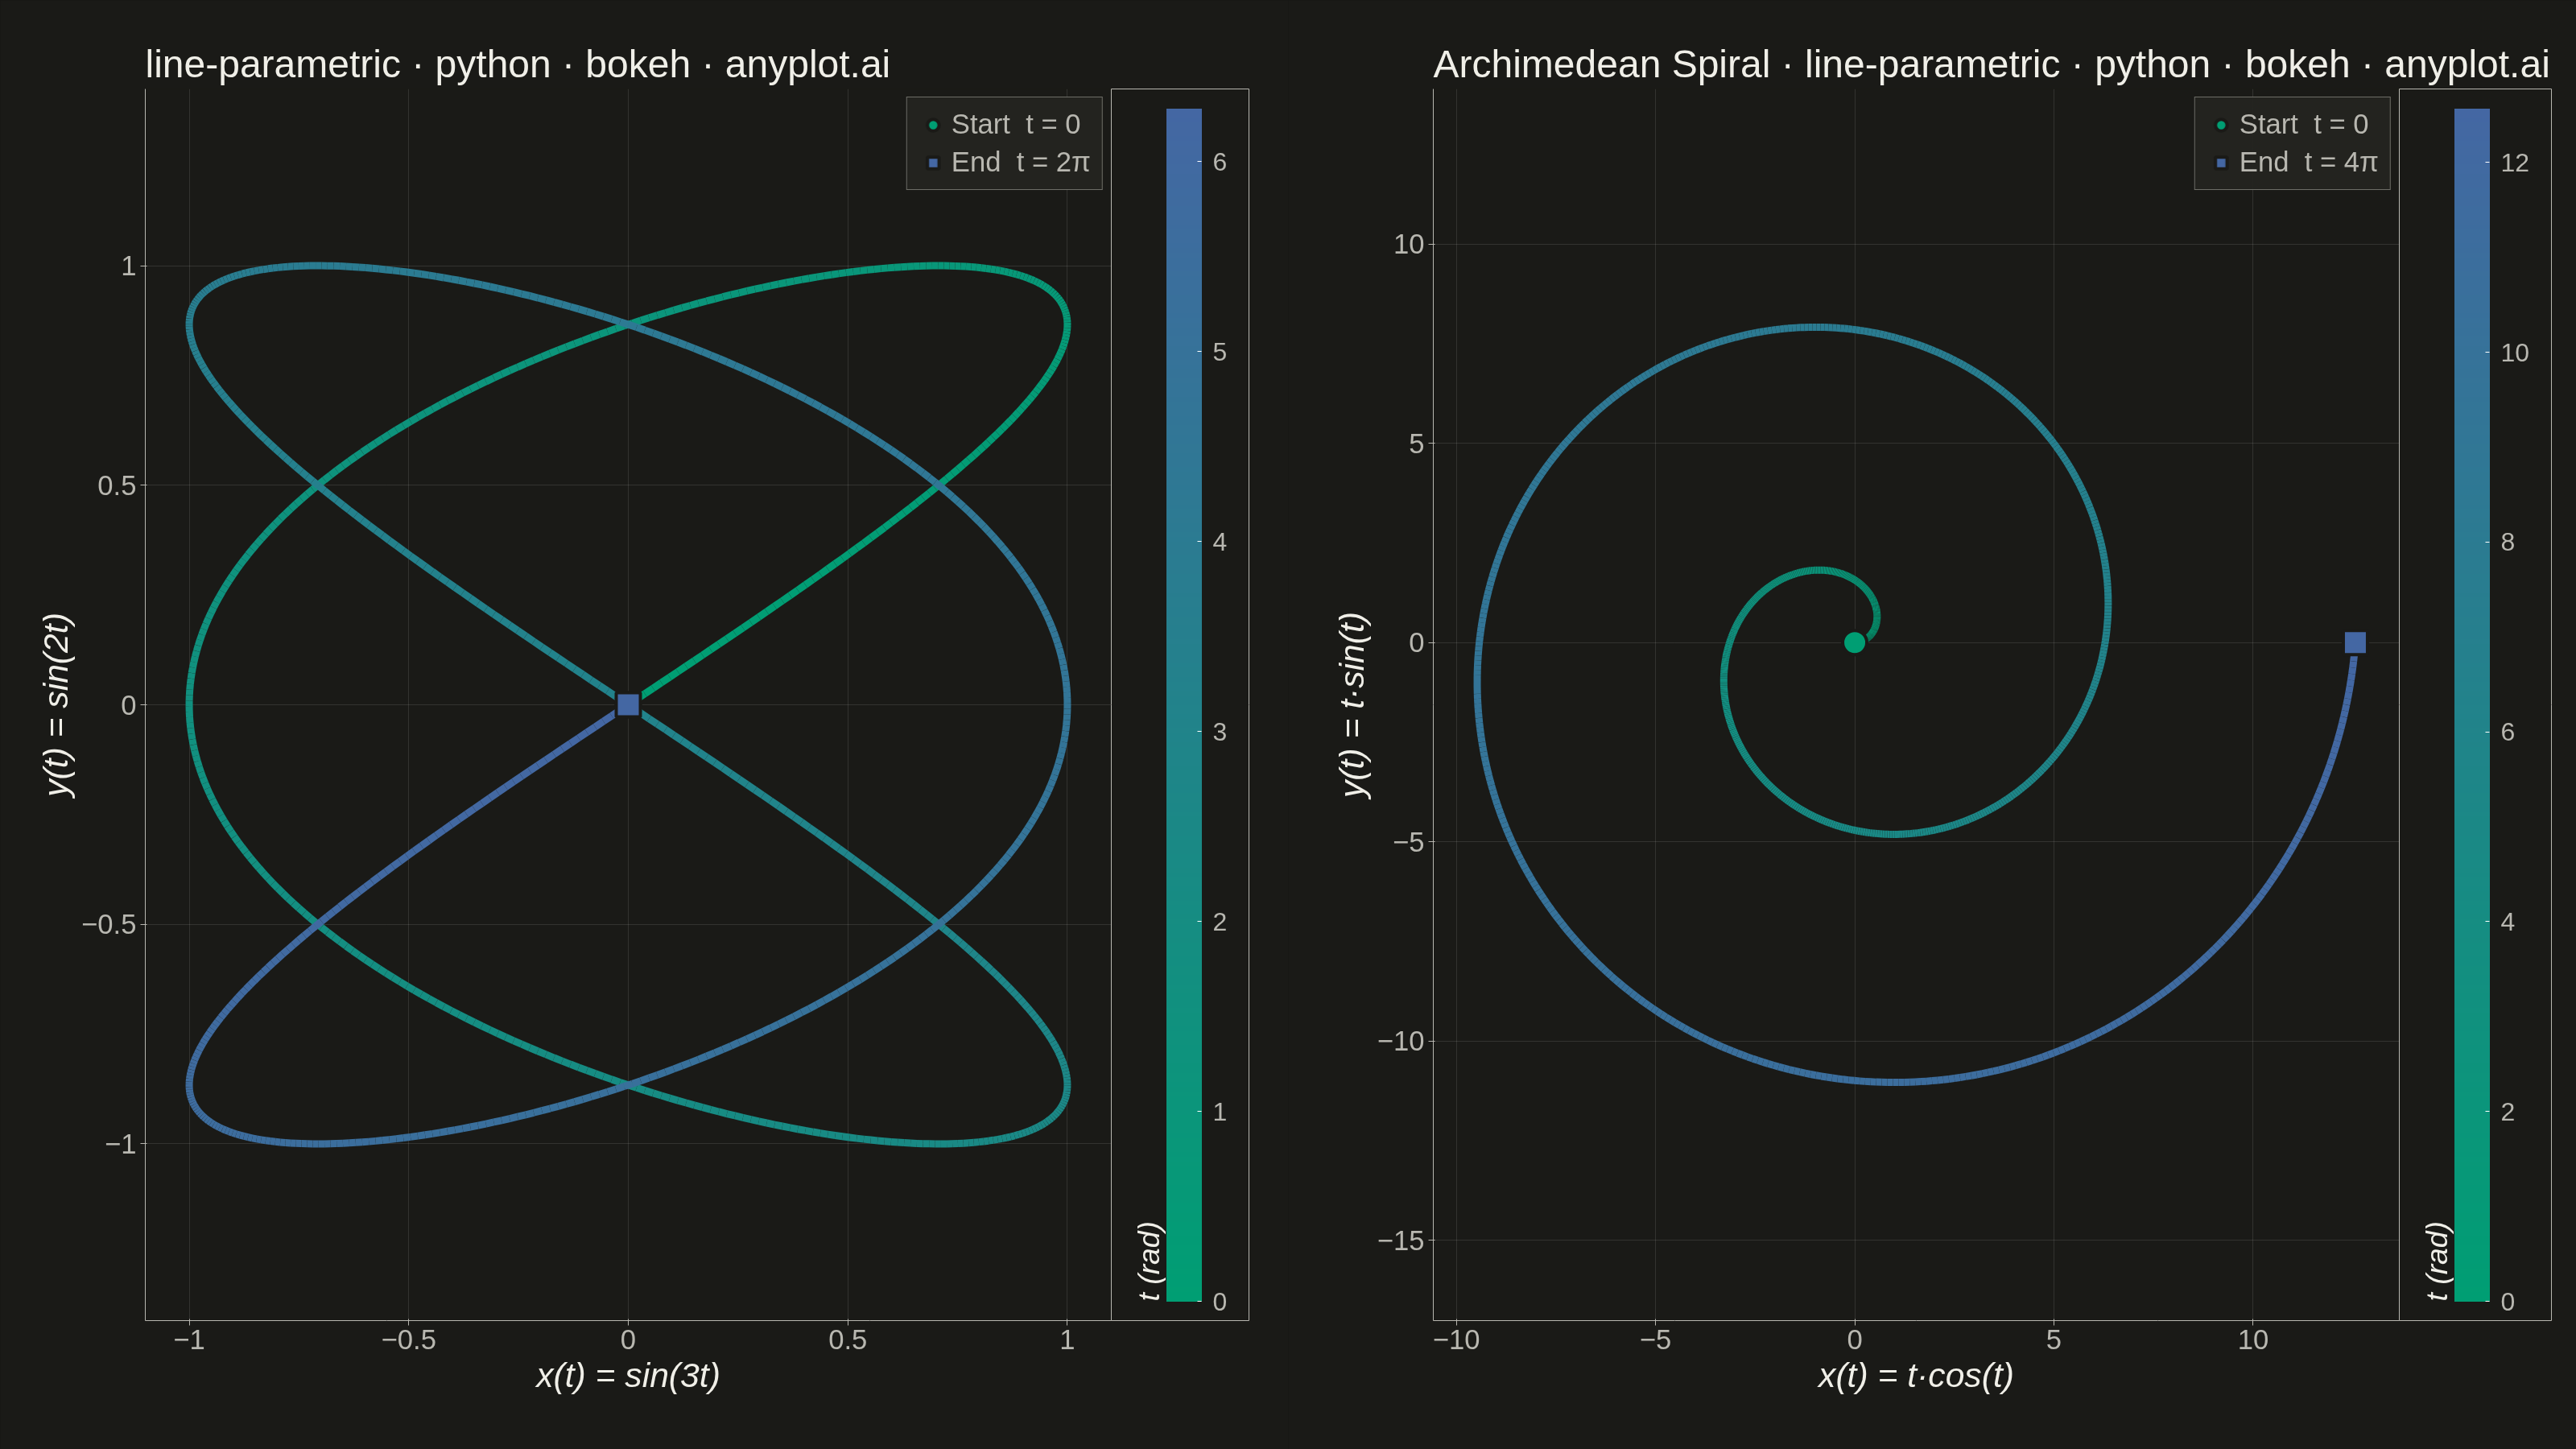
A parametric curve plot visualizes x(t) and y(t) as functions of a parameter t, tracing smooth curves in 2D space. Unlike standard function plots where y = f(x), parametric curves can loop, self-intersect, and form closed shapes such as Lissajous figures, spirals, and cardioids. This makes them essential for representing trajectories, oscillations, and classical mathematical curves that cannot be expressed as single-valued functions.
""" anyplot.ai
line-parametric: Parametric Curve Plot
Library: bokeh 3.9.1 | Python 3.13.14
Quality: 91/100 | Updated: 2026-06-20
"""

import os
import sys


# Prevent bokeh.py from shadowing the bokeh package (script dir added to sys.path[0])
_here = os.path.dirname(os.path.abspath(__file__))
sys.path = [p for p in sys.path if os.path.abspath(p) != _here]
import time
from pathlib import Path

import numpy as np
from bokeh.io import output_file, save
from bokeh.layouts import gridplot
from bokeh.models import BasicTicker, ColorBar, ColumnDataSource, LinearColorMapper
from bokeh.plotting import figure
from selenium import webdriver
from selenium.webdriver.chrome.options import Options


# Theme tokens
THEME = os.getenv("ANYPLOT_THEME", "light")
PAGE_BG = "#FAF8F1" if THEME == "light" else "#1A1A17"
ELEVATED_BG = "#FFFDF6" if THEME == "light" else "#242420"
INK = "#1A1A17" if THEME == "light" else "#F0EFE8"
INK_SOFT = "#4A4A44" if THEME == "light" else "#B8B7B0"


# Imprint sequential colormap — green (#009E73) → blue (#4467A3)
def _lerp_hex(c0, c1, t):
    r0, g0, b0 = (int(c0[i : i + 2], 16) for i in (1, 3, 5))
    r1, g1, b1 = (int(c1[i : i + 2], 16) for i in (1, 3, 5))
    return "#{:02X}{:02X}{:02X}".format(
        int(round(r0 + (r1 - r0) * t)), int(round(g0 + (g1 - g0) * t)), int(round(b0 + (b1 - b0) * t))
    )


IMPRINT_SEQ256 = [_lerp_hex("#009E73", "#4467A3", i / 255.0) for i in range(256)]

# Data — 1000 points for smooth curves
n_points = 1000
n_seg = n_points - 1

# Lissajous figure: x = sin(3t), y = sin(2t), t ∈ [0, 2π]
t_liss = np.linspace(0, 2 * np.pi, n_points)
x_liss = np.sin(3 * t_liss)
y_liss = np.sin(2 * t_liss)

# Archimedean spiral: x = t·cos(t), y = t·sin(t), t ∈ [0, 4π]
t_spiral = np.linspace(0, 4 * np.pi, n_points)
x_spiral = t_spiral * np.cos(t_spiral)
y_spiral = t_spiral * np.sin(t_spiral)


def make_segment_source(x, y):
    n = len(x) - 1
    return ColumnDataSource(
        data={
            "xs": [[x[i], x[i + 1]] for i in range(n)],
            "ys": [[y[i], y[i + 1]] for i in range(n)],
            "color": [IMPRINT_SEQ256[int(i / (n - 1) * 255)] for i in range(n)],
        }
    )


seg_liss = make_segment_source(x_liss, y_liss)
seg_spiral = make_segment_source(x_spiral, y_spiral)

# Two panels side-by-side → 1600 + 1600 = 3200 px wide × 1800 px tall
PANEL_W = 1600
PANEL_H = 1800

p1 = figure(
    width=PANEL_W,
    height=PANEL_H,
    title="line-parametric · python · bokeh · anyplot.ai",
    x_axis_label="x(t) = sin(3t)",
    y_axis_label="y(t) = sin(2t)",
    toolbar_location=None,
    match_aspect=True,
    min_border_bottom=160,
    min_border_left=180,
    min_border_top=110,
    min_border_right=220,
)

p1.multi_line(xs="xs", ys="ys", source=seg_liss, line_color="color", line_width=9)
p1.scatter(
    x=[x_liss[0]],
    y=[y_liss[0]],
    size=30,
    fill_color="#009E73",
    line_color=PAGE_BG,
    line_width=4,
    legend_label="Start  t = 0",
)
p1.scatter(
    x=[x_liss[-1]],
    y=[y_liss[-1]],
    size=30,
    marker="square",
    fill_color="#4467A3",
    line_color=PAGE_BG,
    line_width=4,
    legend_label="End  t = 2π",
)

liss_cbar = ColorBar(
    color_mapper=LinearColorMapper(palette=IMPRINT_SEQ256, low=0, high=round(2 * np.pi, 2)),
    ticker=BasicTicker(desired_num_ticks=5),
    title="t (rad)",
    title_text_font_size="28pt",
    title_text_color=INK,
    major_label_text_font_size="24pt",
    major_label_text_color=INK_SOFT,
    label_standoff=14,
    width=44,
    padding=24,
    background_fill_color=PAGE_BG,
    border_line_color=INK_SOFT,
)
p1.add_layout(liss_cbar, "right")

p2 = figure(
    width=PANEL_W,
    height=PANEL_H,
    title="Archimedean Spiral · line-parametric · python · bokeh · anyplot.ai",
    x_axis_label="x(t) = t·cos(t)",
    y_axis_label="y(t) = t·sin(t)",
    toolbar_location=None,
    match_aspect=True,
    min_border_bottom=160,
    min_border_left=180,
    min_border_top=110,
    min_border_right=220,
)

p2.multi_line(xs="xs", ys="ys", source=seg_spiral, line_color="color", line_width=9)
p2.scatter(
    x=[x_spiral[0]],
    y=[y_spiral[0]],
    size=30,
    fill_color="#009E73",
    line_color=PAGE_BG,
    line_width=4,
    legend_label="Start  t = 0",
)
p2.scatter(
    x=[x_spiral[-1]],
    y=[y_spiral[-1]],
    size=30,
    marker="square",
    fill_color="#4467A3",
    line_color=PAGE_BG,
    line_width=4,
    legend_label="End  t = 4π",
)

spiral_cbar = ColorBar(
    color_mapper=LinearColorMapper(palette=IMPRINT_SEQ256, low=0, high=round(4 * np.pi, 2)),
    ticker=BasicTicker(desired_num_ticks=5),
    title="t (rad)",
    title_text_font_size="28pt",
    title_text_color=INK,
    major_label_text_font_size="24pt",
    major_label_text_color=INK_SOFT,
    label_standoff=14,
    width=44,
    padding=24,
    background_fill_color=PAGE_BG,
    border_line_color=INK_SOFT,
)
p2.add_layout(spiral_cbar, "right")

# Theme-adaptive chrome for both panels
for p in [p1, p2]:
    p.background_fill_color = PAGE_BG
    p.border_fill_color = PAGE_BG
    p.outline_line_color = None  # L-shaped frame: axes provide the bottom+left boundary

    p.title.text_color = INK
    p.title.text_font_size = "36pt"
    p.title.text_font_style = "normal"

    p.xaxis.axis_label_text_color = INK
    p.yaxis.axis_label_text_color = INK
    p.xaxis.axis_label_text_font_size = "32pt"
    p.yaxis.axis_label_text_font_size = "32pt"
    p.xaxis.axis_label_text_font_style = "italic"
    p.yaxis.axis_label_text_font_style = "italic"
    p.xaxis.major_label_text_color = INK_SOFT
    p.yaxis.major_label_text_color = INK_SOFT
    p.xaxis.major_label_text_font_size = "26pt"
    p.yaxis.major_label_text_font_size = "26pt"
    p.xaxis.axis_line_color = INK_SOFT
    p.yaxis.axis_line_color = INK_SOFT
    p.xaxis.major_tick_line_color = INK_SOFT
    p.yaxis.major_tick_line_color = INK_SOFT
    p.axis.minor_tick_line_color = None

    p.xgrid.grid_line_color = INK
    p.ygrid.grid_line_color = INK
    p.xgrid.grid_line_alpha = 0.12
    p.ygrid.grid_line_alpha = 0.12

    p.legend.background_fill_color = ELEVATED_BG
    p.legend.border_line_color = INK_SOFT
    p.legend.label_text_color = INK_SOFT
    p.legend.label_text_font_size = "26pt"
    p.legend.glyph_width = 36
    p.legend.glyph_height = 36
    p.legend.location = "top_right"
    p.legend.padding = 14
    p.legend.spacing = 8

# Layout
grid = gridplot([[p1, p2]], merge_tools=False, toolbar_location=None)

# Save interactive HTML
html_path = Path(f"plot-{THEME}.html")
output_file(str(html_path))
save(grid)

# Strip default body margin so the plot fills the Selenium viewport exactly
html = html_path.read_text()
html = html.replace("<body>", f'<body style="margin:0;padding:0;overflow:hidden;background:{PAGE_BG};">', 1)
html_path.write_text(html)

# Screenshot with headless Chrome (Selenium) at canvas dimensions
W, H = 3200, 1800
opts = Options()
for arg in (
    "--headless=new",
    "--no-sandbox",
    "--disable-dev-shm-usage",
    "--disable-gpu",
    f"--window-size={W},{H}",
    "--hide-scrollbars",
):
    opts.add_argument(arg)
driver = webdriver.Chrome(options=opts)
driver.set_window_size(W, H)
# Compensate for any browser chrome that reduces the actual viewport
actual_h = driver.execute_script("return window.innerHeight")
if actual_h < H:
    driver.set_window_size(W, H + (H - actual_h))
driver.get(f"file://{html_path.resolve()}")
time.sleep(3)
driver.save_screenshot(f"plot-{THEME}.png")
driver.quit()
Runnable source as JSON, for any HTTP client: https://api.anyplot.ai/specs/line-parametric/bokeh/code. Any spec id and library id listed in llms-full.txt fit the same URL shape; every URL below is complete and callable.
{
  "spec_id": "line-parametric",
  "language": "python",
  "library": "bokeh",
  "page": "https://anyplot.ai/line-parametric/python/bokeh",
  "hub": "https://anyplot.ai/line-parametric",
  "code_json": "https://api.anyplot.ai/specs/line-parametric/bokeh/code",
  "spec_json": "https://api.anyplot.ai/specs/line-parametric",
  "render_light_png": "https://storage.googleapis.com/anyplot-images/plots/line-parametric/python/bokeh/plot-light.png",
  "render_dark_png": "https://storage.googleapis.com/anyplot-images/plots/line-parametric/python/bokeh/plot-dark.png",
  "interactive_light_html": "https://storage.googleapis.com/anyplot-images/plots/line-parametric/python/bokeh/plot-light.html",
  "interactive_dark_html": "https://storage.googleapis.com/anyplot-images/plots/line-parametric/python/bokeh/plot-dark.html",
  "quality_score": 91.0,
  "license": "MIT",
  "guide": "https://anyplot.ai/llms.txt"
}
Part of Parametric Curve Plot on anyplot.ai.