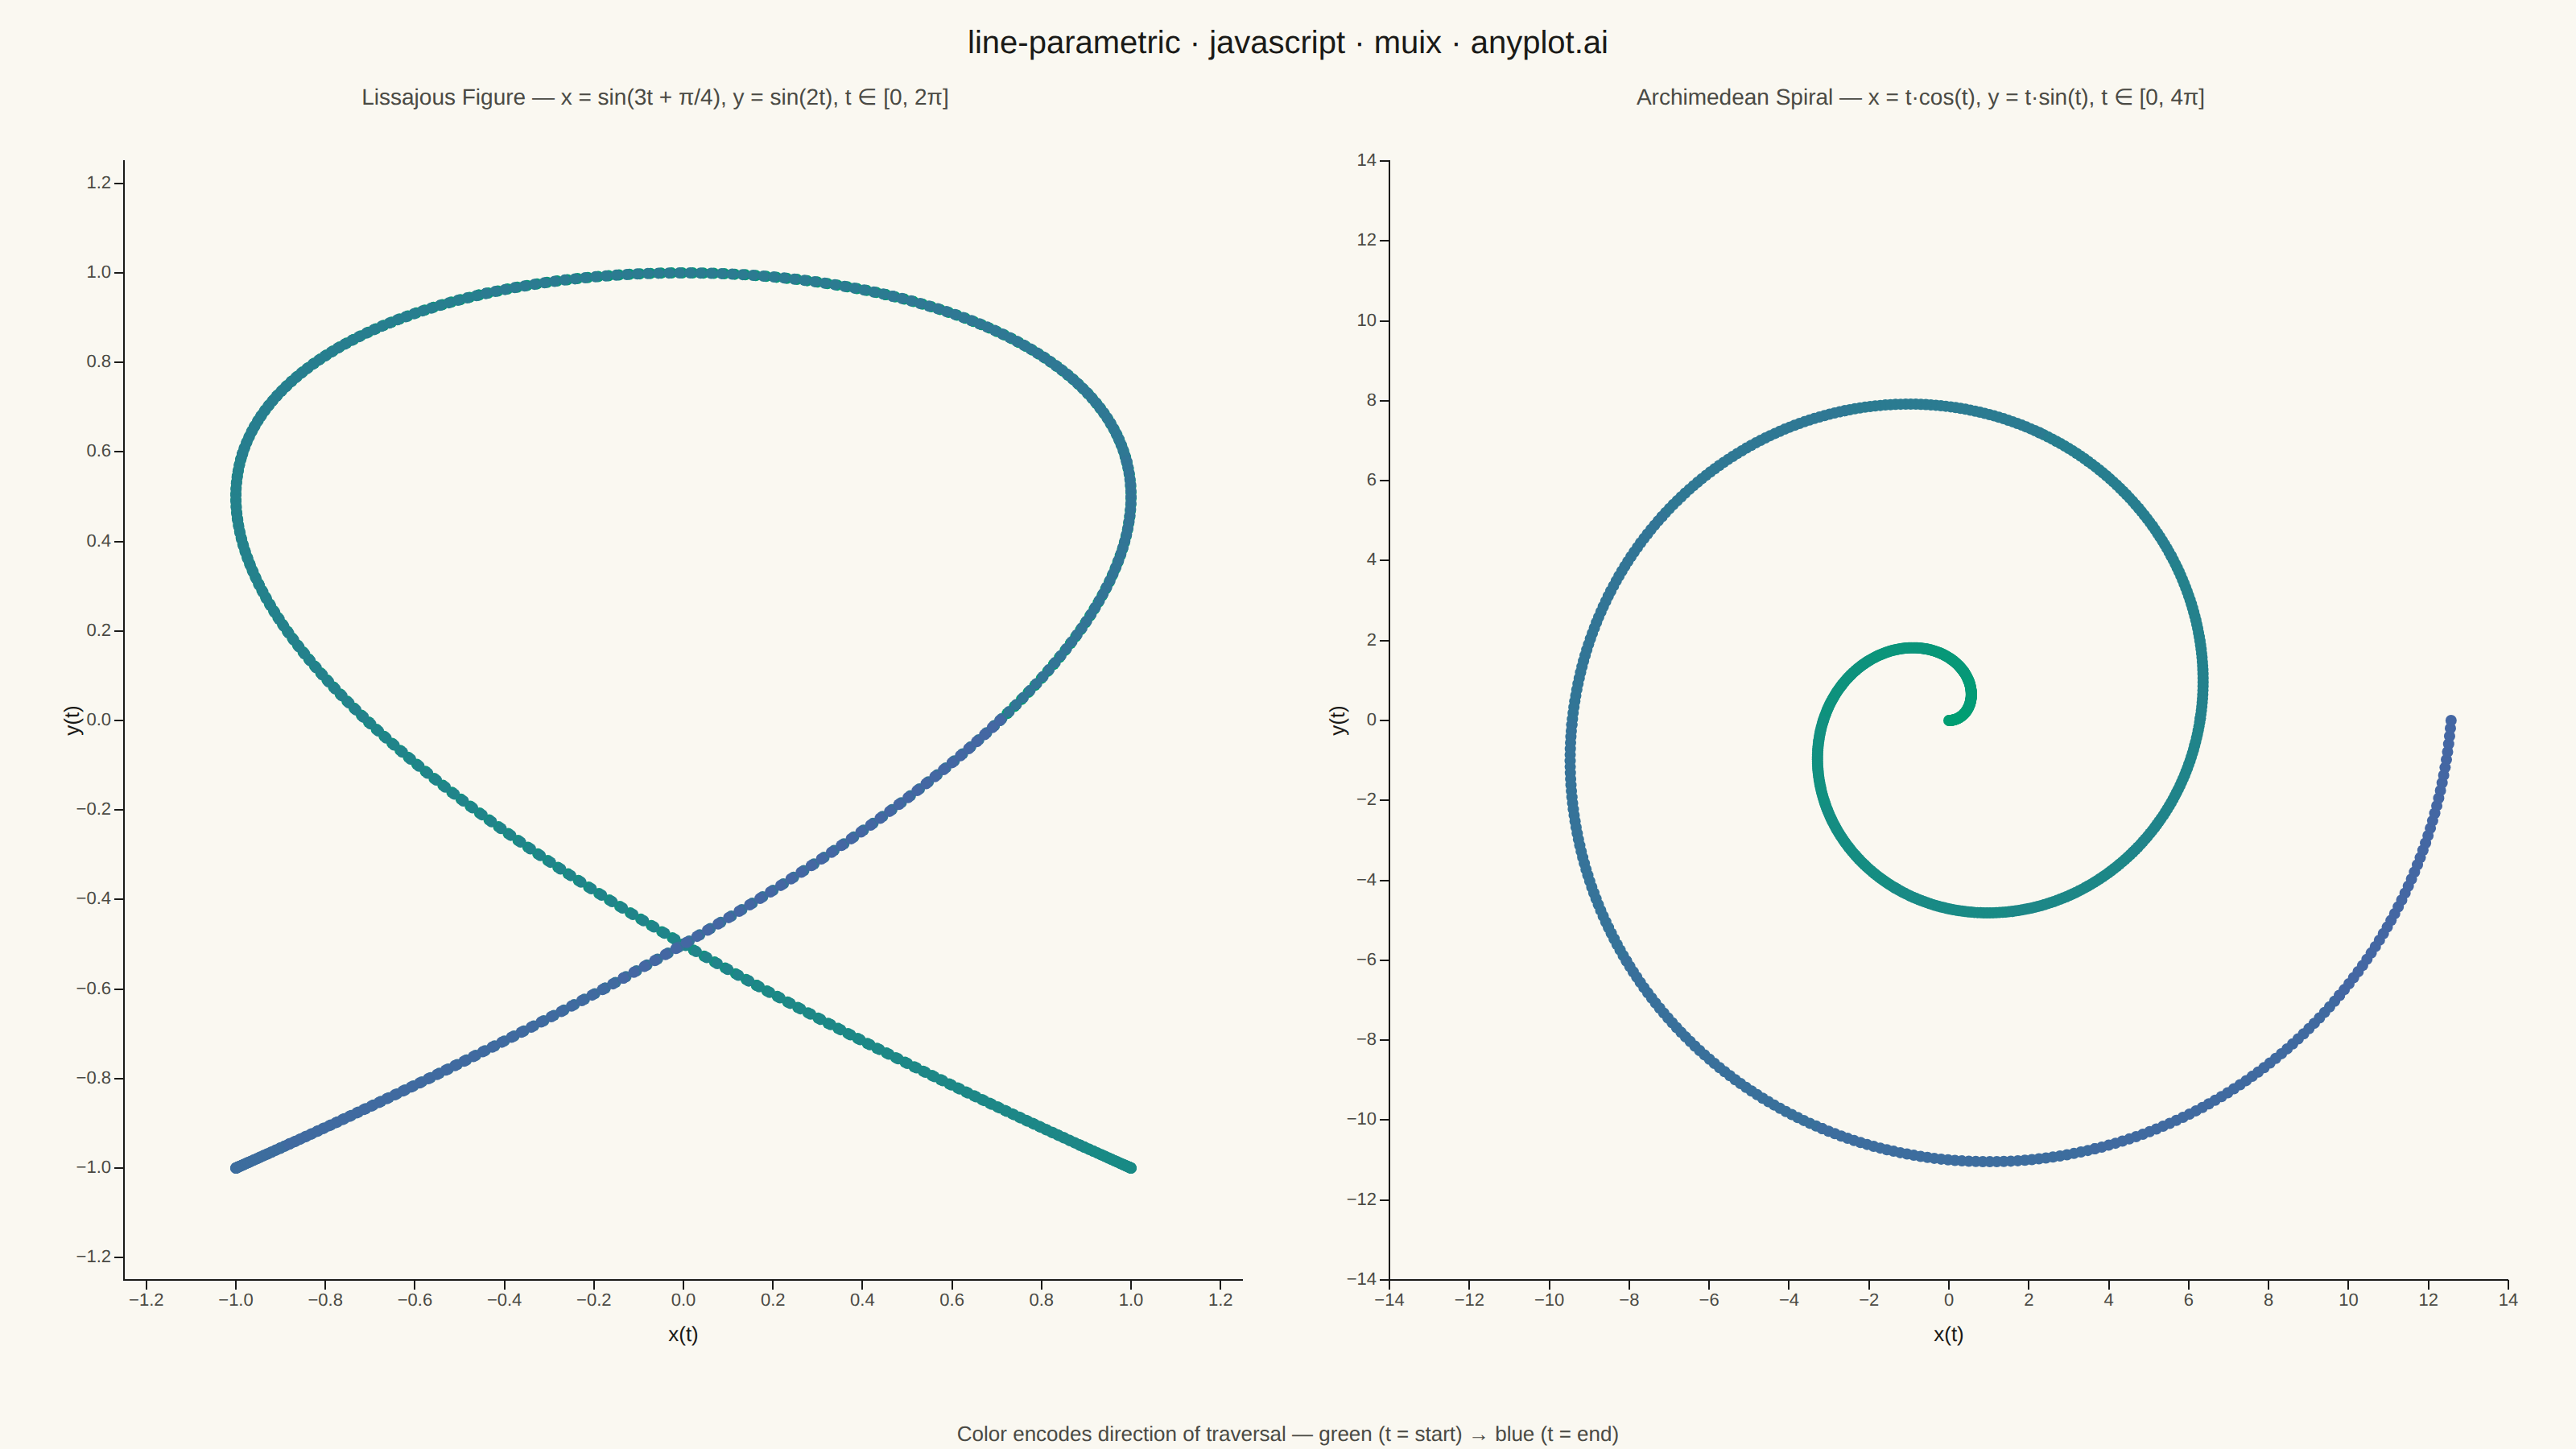
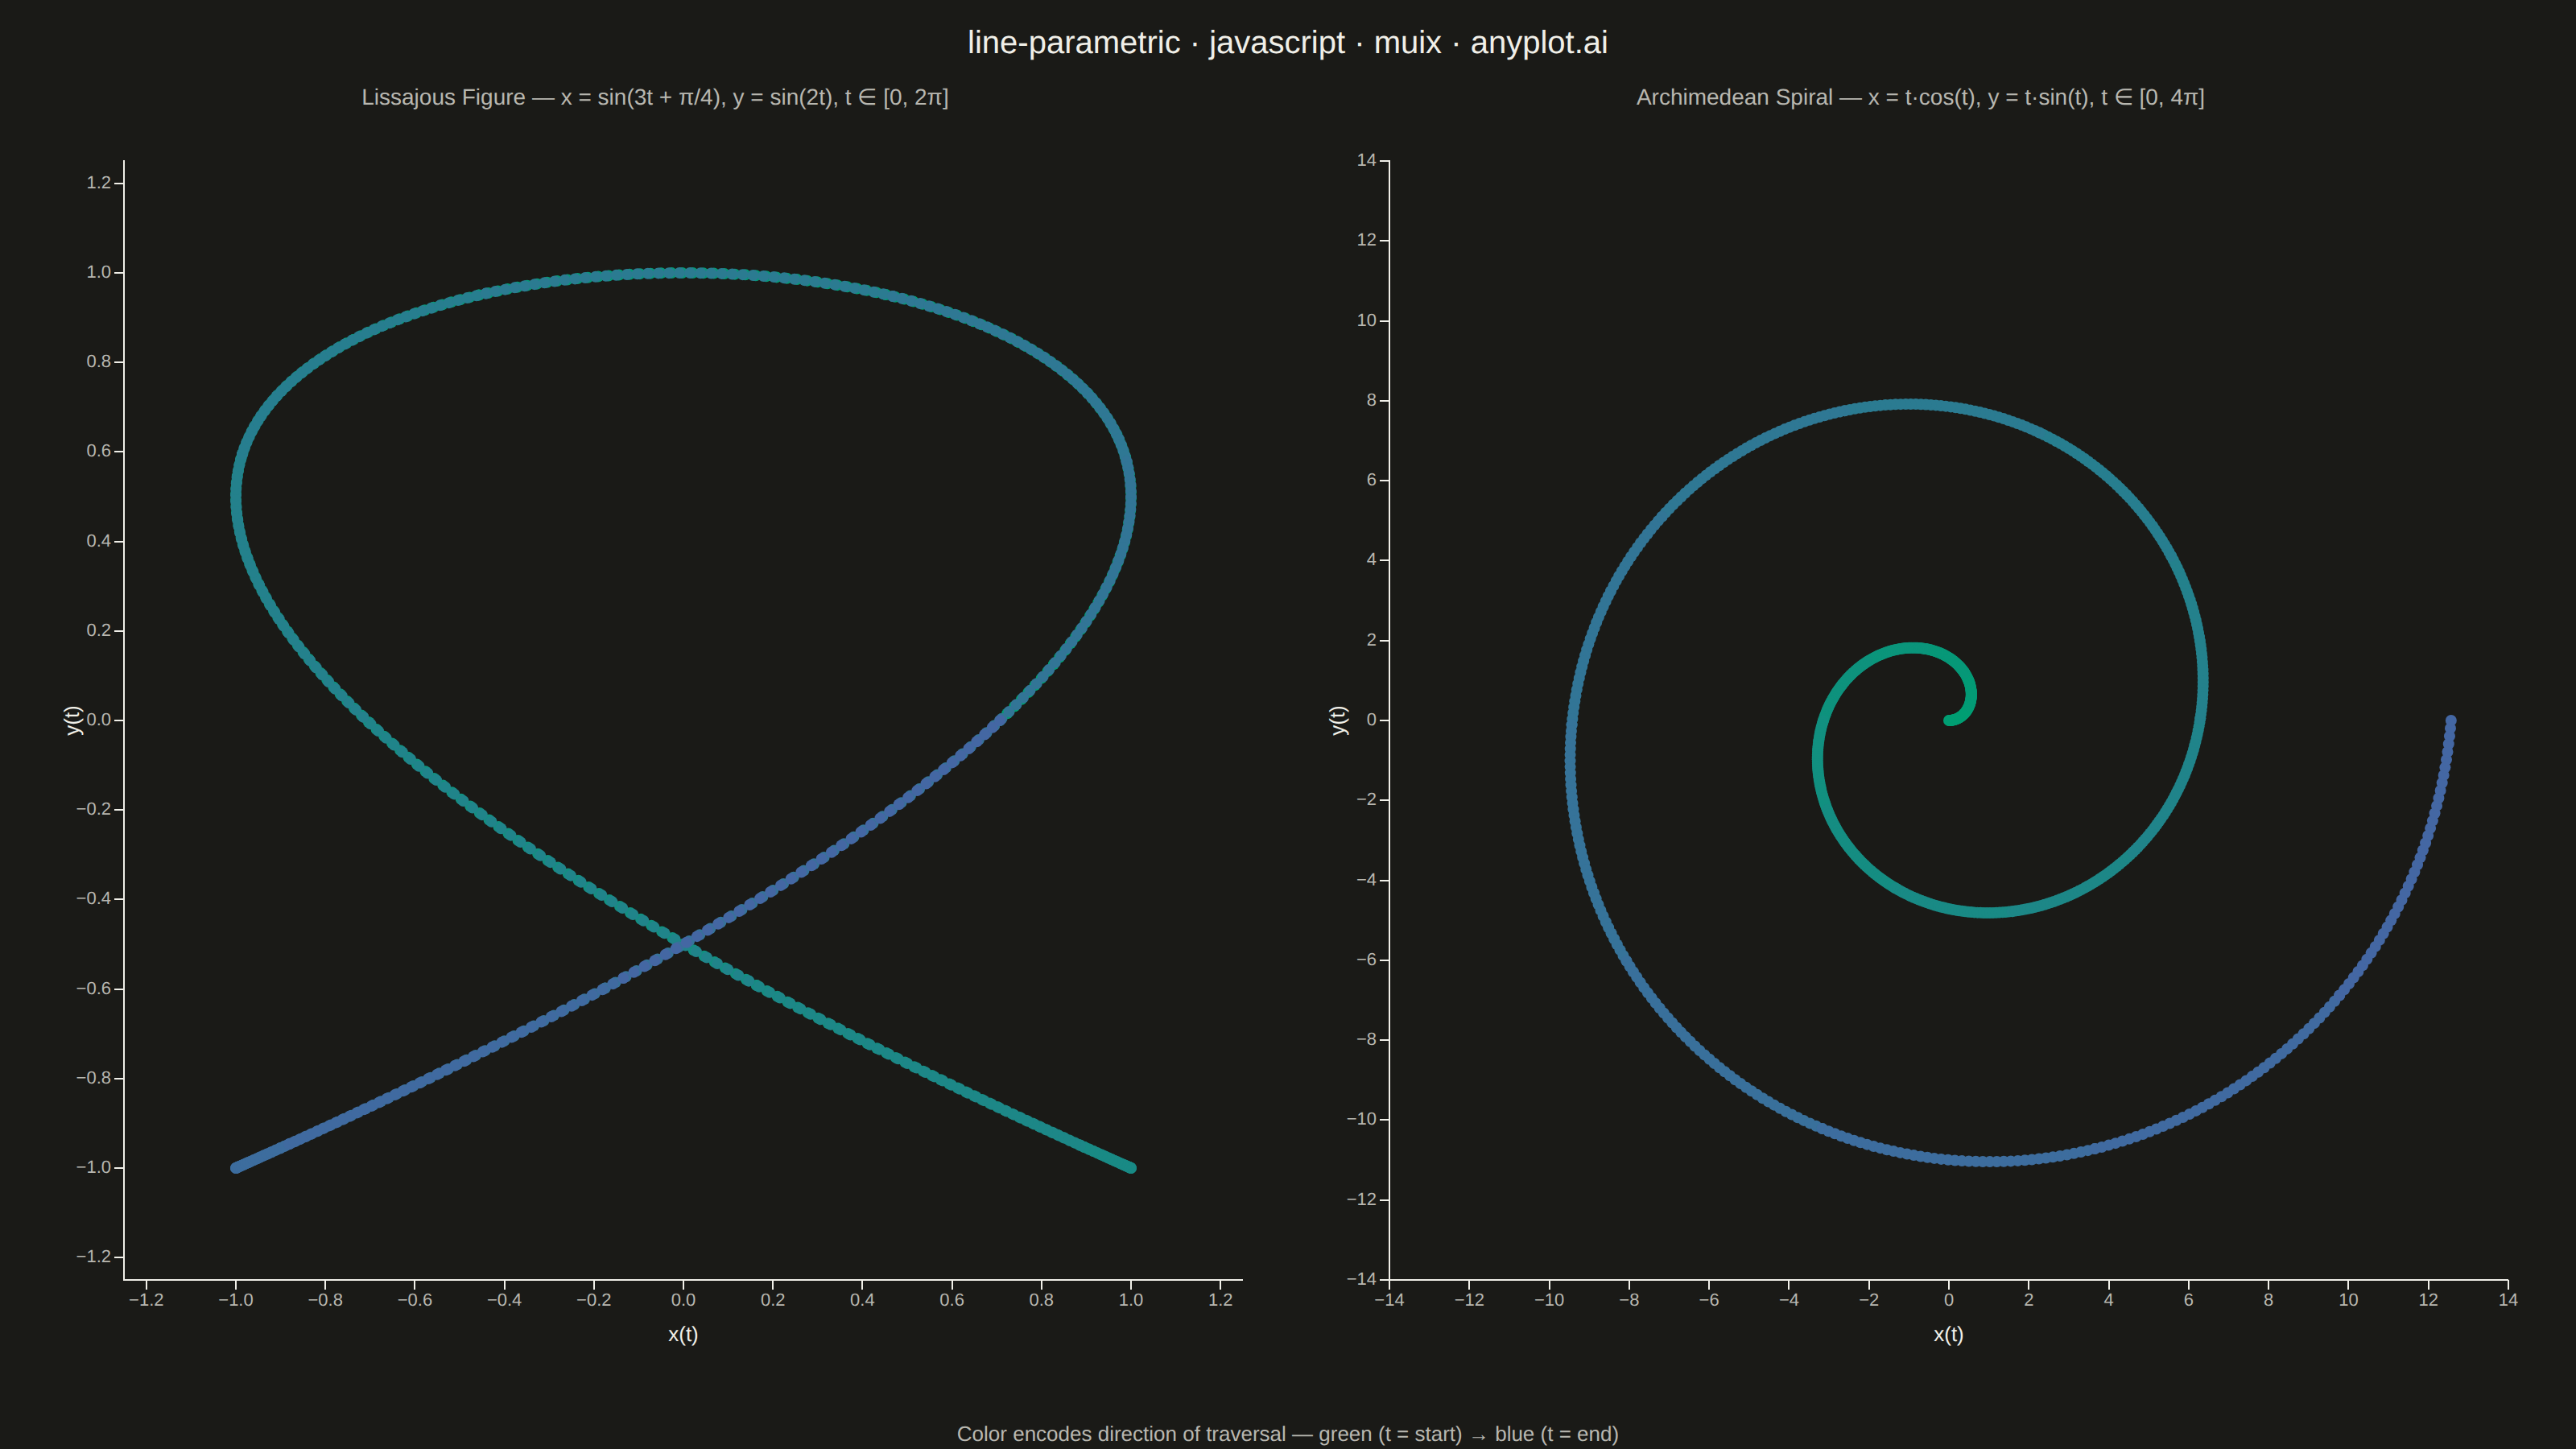
The same plot in 14 other libraries — JavaScript: Chart.js, D3.js, Apache ECharts, Highcharts; Python: Altair, Bokeh, lets-plot, Matplotlib, Plotly, plotnine, Pygal, Seaborn; R: ggplot2; Julia: Makie.jl. Compare all 15 side by side: Parametric Curve Plot in Python, R, Julia and JavaScript.
A parametric curve plot visualizes x(t) and y(t) as functions of a parameter t, tracing smooth curves in 2D space. Unlike standard function plots where y = f(x), parametric curves can loop, self-intersect, and form closed shapes such as Lissajous figures, spirals, and cardioids. This makes them essential for representing trajectories, oscillations, and classical mathematical curves that cannot be expressed as single-valued functions.
// anyplot.ai
// line-parametric: Parametric Curve Plot
// Library: muix 7.29.1 | JavaScript 22.22.3
// Quality: 86/100 | Created: 2026-06-20
import { ScatterChart } from "@mui/x-charts/ScatterChart";
import Box from "@mui/material/Box";
import Typography from "@mui/material/Typography";
const t = window.ANYPLOT_TOKENS;
// Linear interpolation between two hex colors (Imprint sequential gradient)
function lerpColor(hex1: string, hex2: string, alpha: number): string {
const p = (h: string, o: number) => parseInt(h.slice(o, o + 2), 16);
const r = Math.round(p(hex1, 1) + (p(hex2, 1) - p(hex1, 1)) * alpha);
const g = Math.round(p(hex1, 3) + (p(hex2, 3) - p(hex1, 3)) * alpha);
const b = Math.round(p(hex1, 5) + (p(hex2, 5) - p(hex1, 5)) * alpha);
return `#${r.toString(16).padStart(2, "0")}${g.toString(16).padStart(2, "0")}${b.toString(16).padStart(2, "0")}`;
}
// --- Data (deterministic, in-memory) ----------------------------------------
const N = 800;
const SEGS = 20;
const PI2 = 2 * Math.PI;
// Lissajous figure: x = sin(3t + π/4), y = sin(2t), t ∈ [0, 2π]
const lissajousPoints = Array.from({ length: N }, (_, i) => {
const ti = (i / (N - 1)) * PI2;
return { x: Math.sin(3 * ti + Math.PI / 4), y: Math.sin(2 * ti), id: i };
});
// Archimedean spiral: x = t·cos(t), y = t·sin(t), t ∈ [0, 4π]
const spiralPoints = Array.from({ length: N }, (_, i) => {
const ti = (i / (N - 1)) * 2 * PI2;
return { x: ti * Math.cos(ti), y: ti * Math.sin(ti), id: i };
});
// Segment each curve into SEGS color bands for Imprint seq gradient
// #009E73 (brand green, t=start) → #4467A3 (blue, t=end)
const SEQ_START = "#009E73";
const SEQ_END = "#4467A3";
function buildGradientSeries(points: { x: number; y: number; id: number }[]) {
const segLen = Math.ceil(points.length / SEGS);
return Array.from({ length: SEGS }, (_, s) => ({
data: points.slice(s * segLen, Math.min((s + 1) * segLen + 1, points.length)),
color: lerpColor(SEQ_START, SEQ_END, s / (SEGS - 1)),
label: "",
markerSize: 3.5,
id: `seg-${s}`,
}));
}
const lissajousSeries = buildGradientSeries(lissajousPoints);
const spiralSeries = buildGradientSeries(spiralPoints);
// --- Chart ------------------------------------------------------------------
export default function Chart() {
const { width, height } = window.ANYPLOT_SIZE;
const half = Math.floor((width - 60) / 2);
const chartH = height - 100;
// Square chart enforces equal aspect ratio when both axes cover the same numeric range.
// Margins top=25, bottom=50, left=55, right=20 → plot area = (side-75) × (side-75).
const chartSide = Math.min(half, chartH);
const axisLabel = { fill: t.ink, fontSize: 13 };
const axisTick = { fill: t.inkSoft, fontSize: 11 };
return (
<Box
sx={{
width,
height,
bgcolor: t.pageBg,
display: "flex",
flexDirection: "column",
px: 2,
pt: 1.5,
boxSizing: "border-box",
}}
>
<Typography
sx={{
color: t.ink,
fontSize: 20,
fontWeight: 500,
textAlign: "center",
mb: 1,
letterSpacing: 0,
}}
>
line-parametric · javascript · muix · anyplot.ai
</Typography>
<Box sx={{ display: "flex", gap: 2, flex: 1, justifyContent: "center", alignItems: "flex-start" }}>
{/* Lissajous figure — equal aspect ratio: square chart, same axis range, balanced margins */}
<Box sx={{ display: "flex", flexDirection: "column", alignItems: "center" }}>
<Typography sx={{ color: t.inkSoft, fontSize: 14, mb: 0.5 }}>
Lissajous Figure — x = sin(3t + π/4), y = sin(2t), t ∈ [0, 2π]
</Typography>
<ScatterChart
width={chartSide}
height={chartSide}
skipAnimation
series={lissajousSeries}
grid={{ horizontal: false, vertical: false }}
xAxis={[{
label: "x(t)",
labelStyle: axisLabel,
tickLabelStyle: axisTick,
min: -1.25,
max: 1.25,
}]}
yAxis={[{
label: "y(t)",
labelStyle: axisLabel,
tickLabelStyle: axisTick,
min: -1.25,
max: 1.25,
}]}
margin={{ top: 25, bottom: 50, left: 55, right: 20 }}
slotProps={{ legend: { hidden: true } }}
/>
</Box>
{/* Archimedean spiral — equal aspect ratio: square chart, symmetric axis range */}
<Box sx={{ display: "flex", flexDirection: "column", alignItems: "center" }}>
<Typography sx={{ color: t.inkSoft, fontSize: 14, mb: 0.5 }}>
Archimedean Spiral — x = t·cos(t), y = t·sin(t), t ∈ [0, 4π]
</Typography>
<ScatterChart
width={chartSide}
height={chartSide}
skipAnimation
series={spiralSeries}
grid={{ horizontal: false, vertical: false }}
xAxis={[{
label: "x(t)",
labelStyle: axisLabel,
tickLabelStyle: axisTick,
min: -14,
max: 14,
}]}
yAxis={[{
label: "y(t)",
labelStyle: axisLabel,
tickLabelStyle: axisTick,
min: -14,
max: 14,
}]}
margin={{ top: 25, bottom: 50, left: 55, right: 20 }}
slotProps={{ legend: { hidden: true } }}
/>
</Box>
</Box>
<Typography sx={{ color: t.inkSoft, fontSize: 13, textAlign: "center", mt: 0.5 }}>
Color encodes direction of traversal — green (t = start) → blue (t = end)
</Typography>
</Box>
);
}
Runnable source as JSON, for any HTTP client: https://api.anyplot.ai/specs/line-parametric/muix/code. Any spec id and library id listed in llms-full.txt fit the same URL shape; every URL below is complete and callable.
{
  "spec_id": "line-parametric",
  "language": "javascript",
  "library": "muix",
  "page": "https://anyplot.ai/line-parametric/javascript/muix",
  "hub": "https://anyplot.ai/line-parametric",
  "code_json": "https://api.anyplot.ai/specs/line-parametric/muix/code",
  "spec_json": "https://api.anyplot.ai/specs/line-parametric",
  "render_light_png": "https://storage.googleapis.com/anyplot-images/plots/line-parametric/javascript/muix/plot-light.png",
  "render_dark_png": "https://storage.googleapis.com/anyplot-images/plots/line-parametric/javascript/muix/plot-dark.png",
  "interactive_light_html": "https://storage.googleapis.com/anyplot-images/plots/line-parametric/javascript/muix/plot-light.html",
  "interactive_dark_html": "https://storage.googleapis.com/anyplot-images/plots/line-parametric/javascript/muix/plot-dark.html",
  "quality_score": 86.0,
  "license": "MIT",
  "guide": "https://anyplot.ai/llms.txt"
}
Part of Parametric Curve Plot on anyplot.ai.