The same plot in 14 other libraries — Python: Altair, Bokeh, lets-plot, Matplotlib, Plotly, plotnine, Pygal, Seaborn; R: ggplot2; JavaScript: Chart.js, D3.js, Apache ECharts, Highcharts, MUI X Charts. Compare all 15 side by side: Parametric Curve Plot in Python, R, Julia and JavaScript.
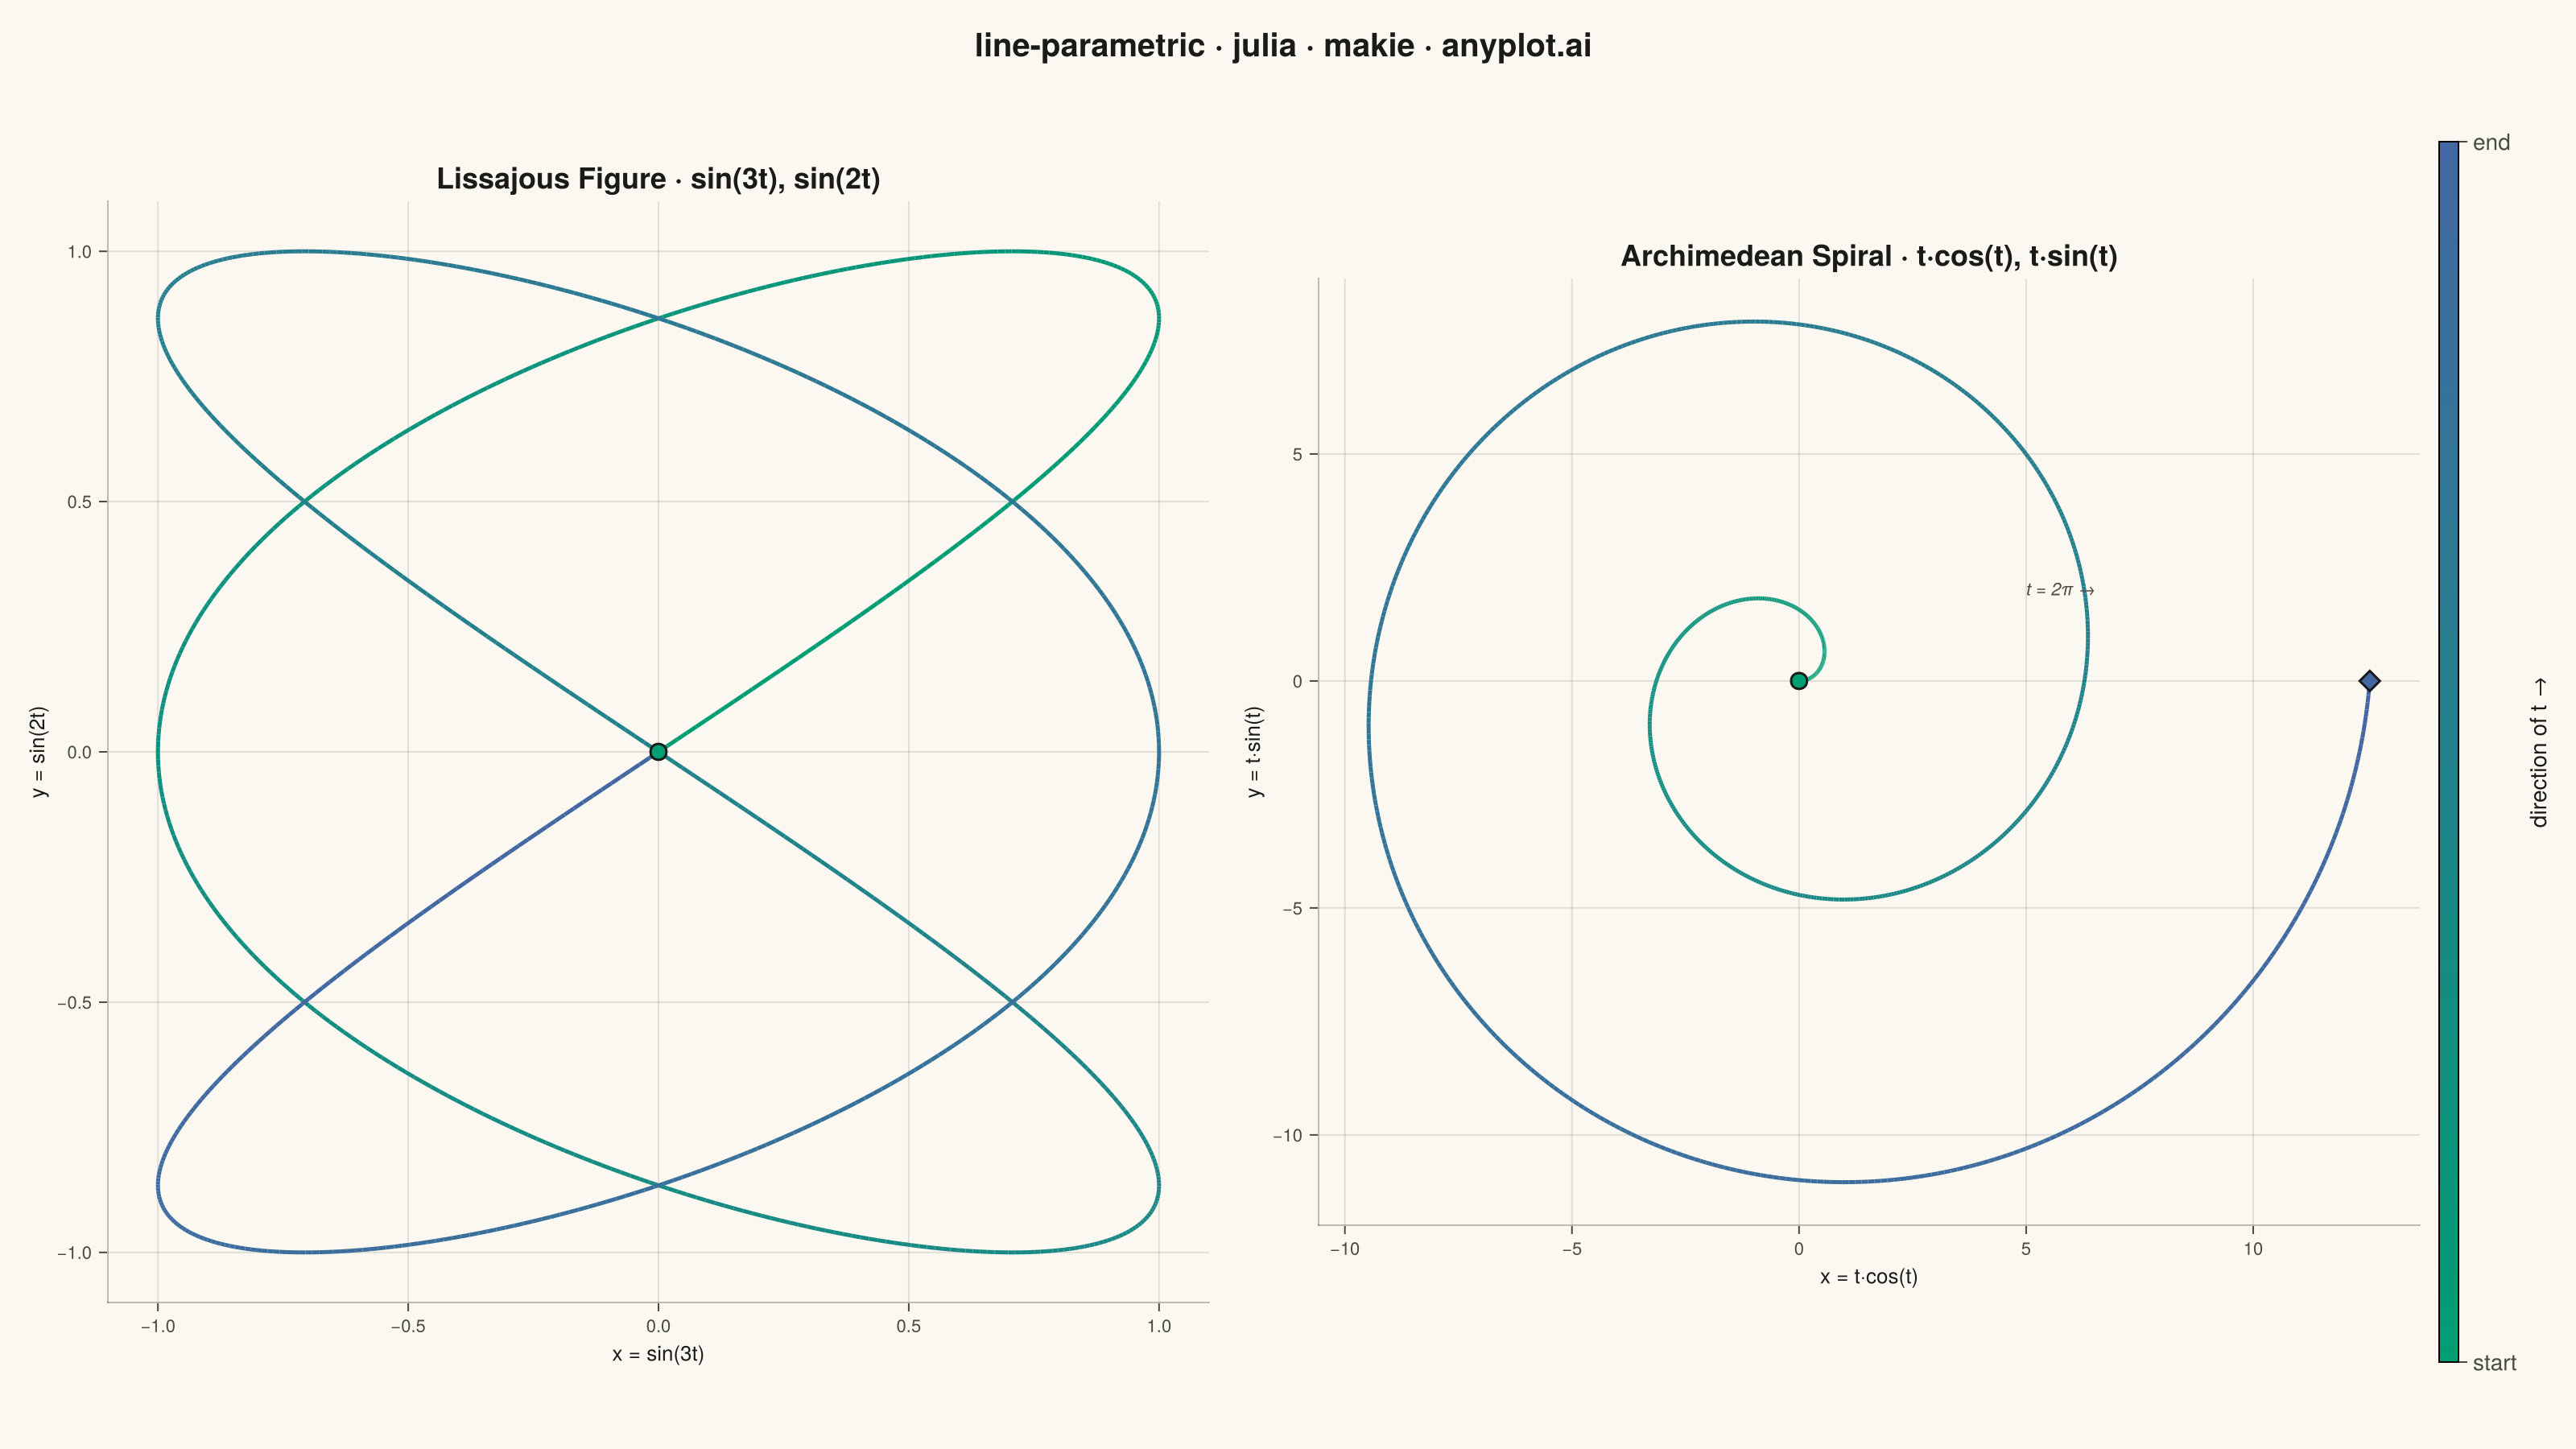
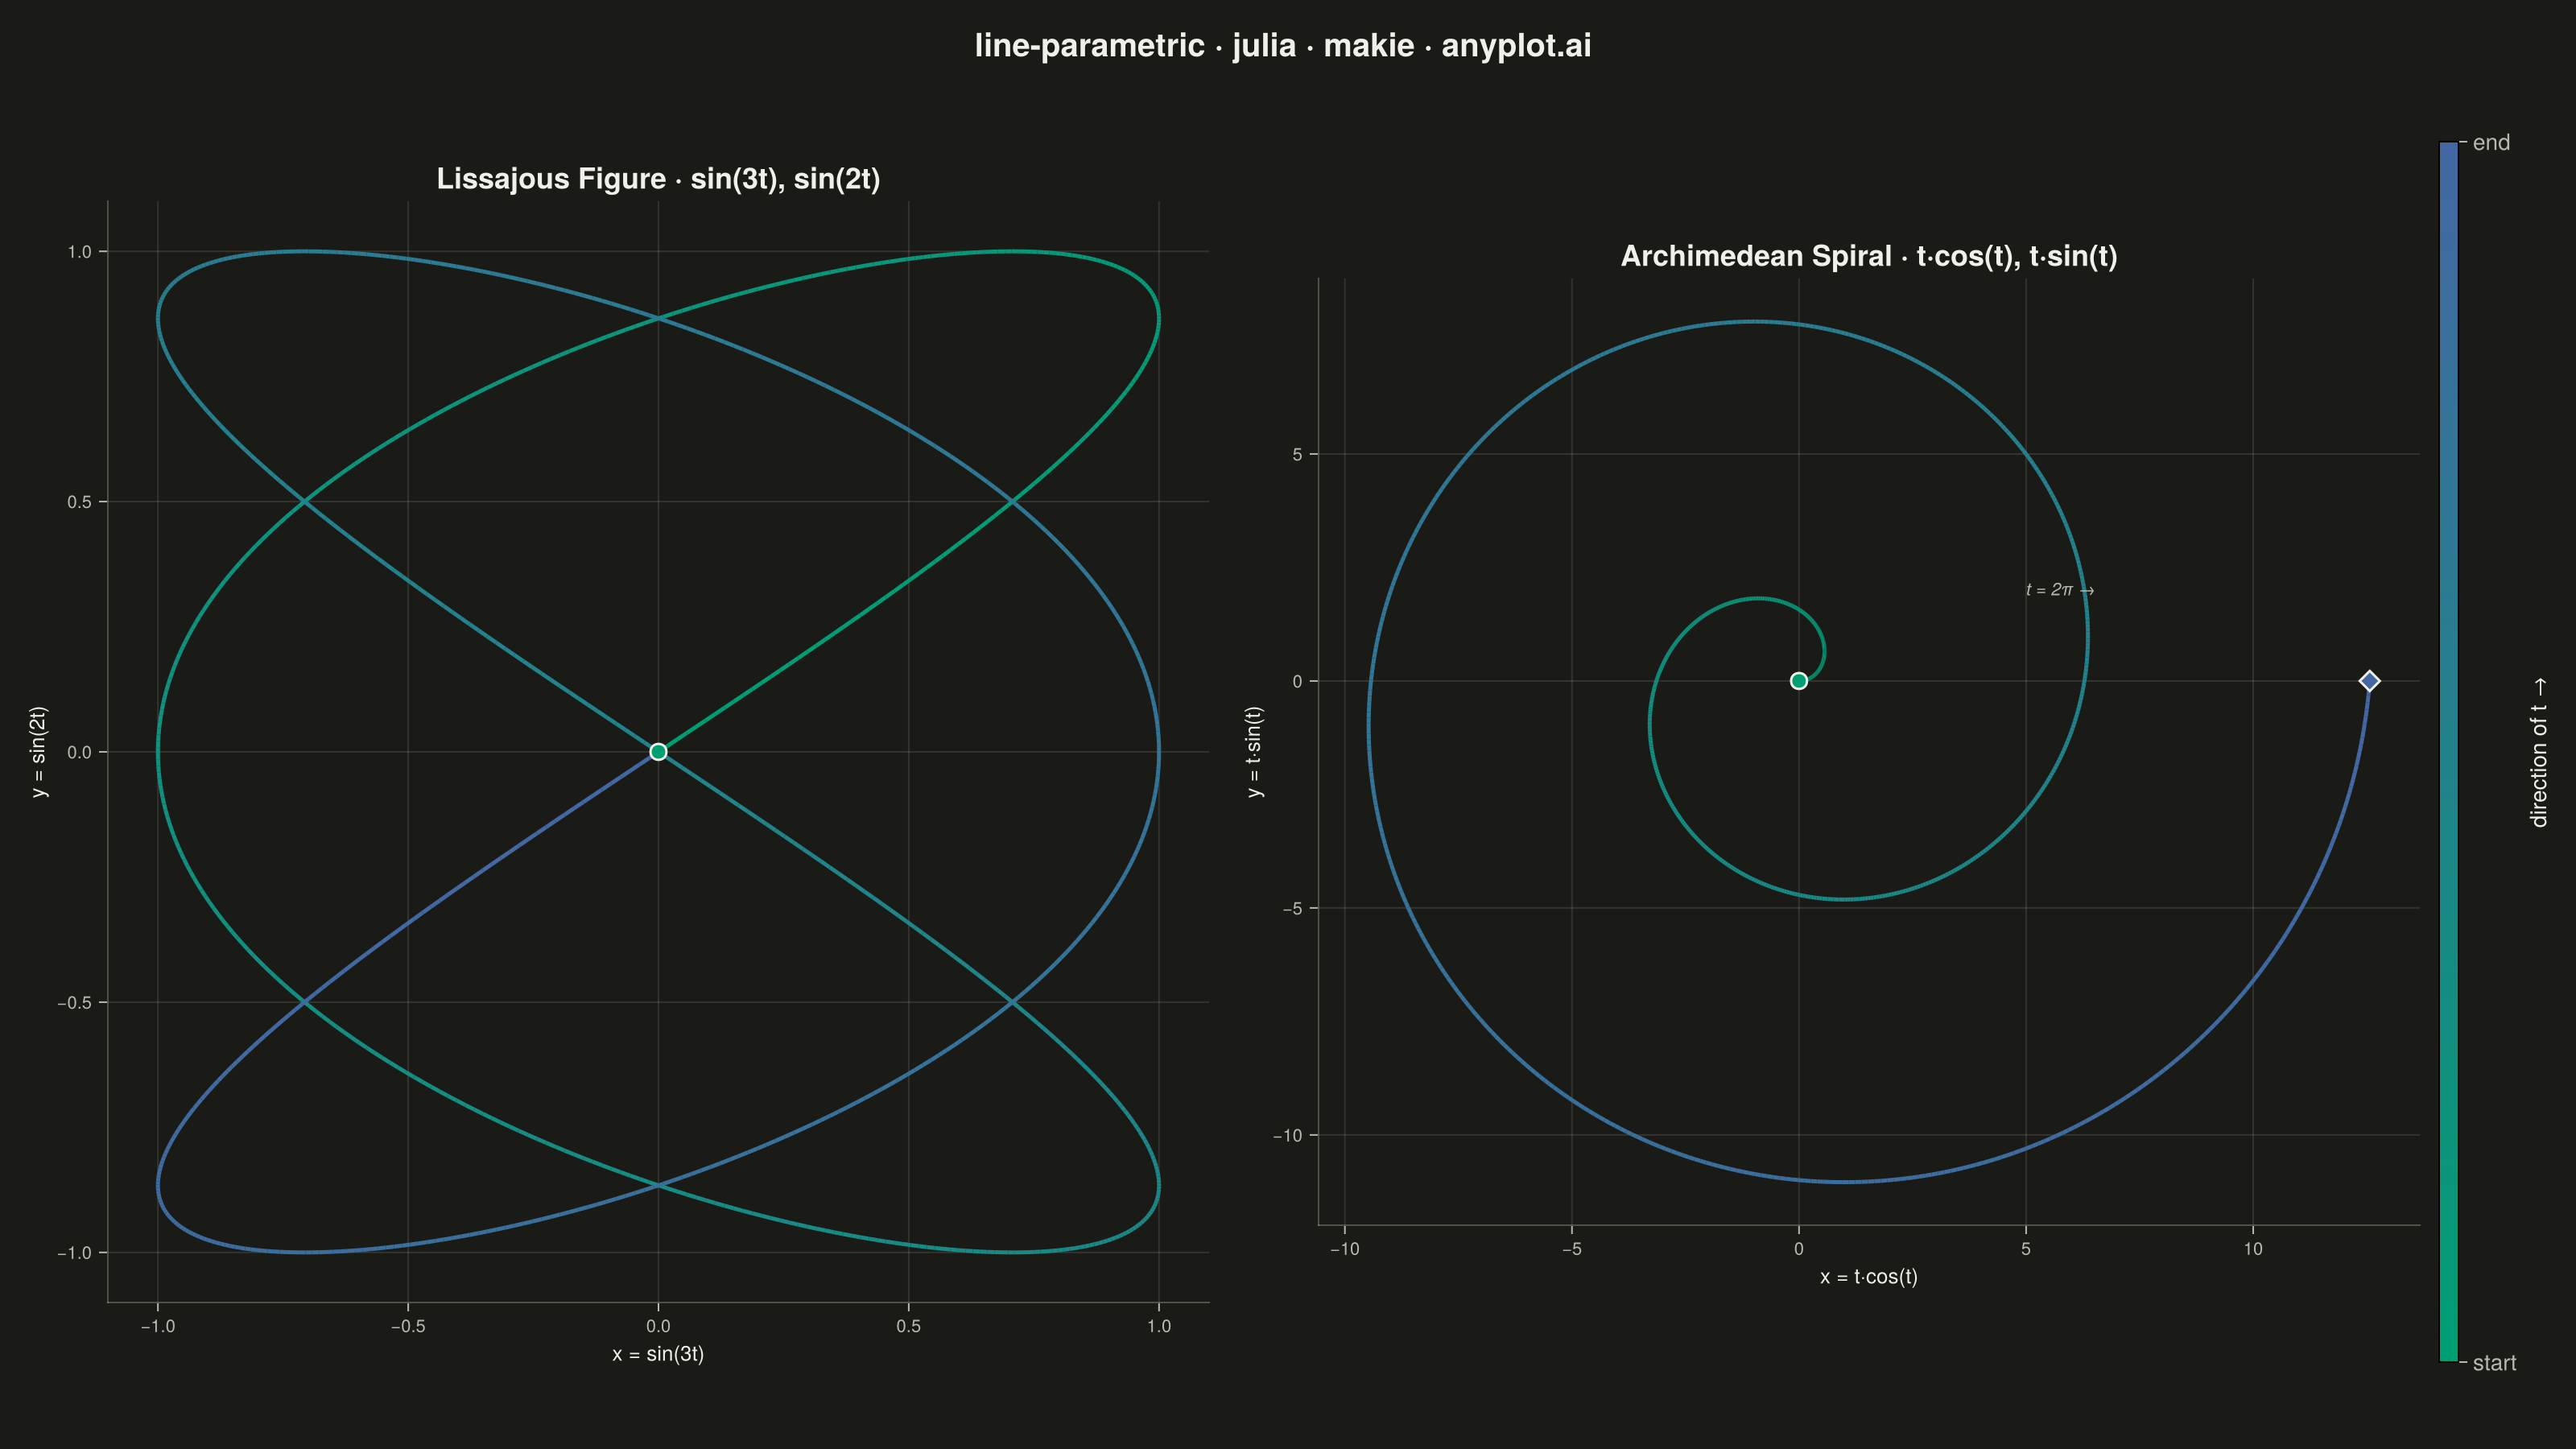
A parametric curve plot visualizes x(t) and y(t) as functions of a parameter t, tracing smooth curves in 2D space. Unlike standard function plots where y = f(x), parametric curves can loop, self-intersect, and form closed shapes such as Lissajous figures, spirals, and cardioids. This makes them essential for representing trajectories, oscillations, and classical mathematical curves that cannot be expressed as single-valued functions.
# anyplot.ai
# line-parametric: Parametric Curve Plot
# Library: makie 0.22.10 | Julia 1.11.9
# Quality: 90/100 | Created: 2026-06-20

using CairoMakie
using Colors

# Theme tokens
const THEME       = get(ENV, "ANYPLOT_THEME", "light")
const PAGE_BG     = THEME == "light" ? colorant"#FAF8F1" : colorant"#1A1A17"
const ELEVATED_BG = THEME == "light" ? colorant"#FFFDF6" : colorant"#242420"
const INK         = THEME == "light" ? colorant"#1A1A17" : colorant"#F0EFE8"
const INK_SOFT    = THEME == "light" ? colorant"#4A4A44" : colorant"#B8B7B0"

# Imprint sequential colormap — brand green → blue, encodes direction of t
const ANYPLOT_SEQ = cgrad([colorant"#009E73", colorant"#4467A3"])

# Parametric data — 1000 pts each for smooth rendering near self-intersections
n = 1000

t_liss = LinRange(0.0, 2π, n)
x_liss = sin.(3 .* t_liss)
y_liss = sin.(2 .* t_liss)

t_spiral = LinRange(0.0, 4π, n)
x_spiral = t_spiral .* cos.(t_spiral)
y_spiral = t_spiral .* sin.(t_spiral)

t_norm = collect(LinRange(0.0f0, 1.0f0, n))

# Figure — landscape 3200 × 1800 via size × px_per_unit
fig = Figure(
    size            = (1600, 900),
    fontsize        = 14,
    backgroundcolor = PAGE_BG,
)

Label(
    fig[0, 1:3],
    "line-parametric · julia · makie · anyplot.ai";
    fontsize = 20,
    color    = INK,
    font     = :bold,
    padding  = (0, 0, 12, 0),
)

grid_color  = RGBAf(INK.r, INK.g, INK.b, 0.12f0)
spine_color = RGBAf(INK_SOFT.r, INK_SOFT.g, INK_SOFT.b, 0.35f0)

# Left panel — Lissajous figure
ax1 = Axis(
    fig[1, 1];
    title              = "Lissajous Figure · sin(3t), sin(2t)",
    titlesize          = 18,
    titlecolor         = INK,
    xlabel             = "x = sin(3t)",
    ylabel             = "y = sin(2t)",
    xlabelsize         = 13,
    ylabelsize         = 13,
    xlabelcolor        = INK,
    ylabelcolor        = INK,
    xticklabelsize     = 11,
    yticklabelsize     = 11,
    xticklabelcolor    = INK_SOFT,
    yticklabelcolor    = INK_SOFT,
    xtickcolor         = INK_SOFT,
    ytickcolor         = INK_SOFT,
    backgroundcolor    = PAGE_BG,
    topspinevisible    = false,
    rightspinevisible  = false,
    leftspinecolor     = spine_color,
    bottomspinecolor   = spine_color,
    xgridcolor         = grid_color,
    ygridcolor         = grid_color,
    aspect             = DataAspect(),
)

lines!(ax1, x_liss, y_liss;
    color     = t_norm,
    colormap  = ANYPLOT_SEQ,
    linewidth = 2.5)

# Closed curve: start = end = (0, 0) — mark with a single origin circle
scatter!(ax1, [x_liss[1]], [y_liss[1]];
    marker      = :circle,
    markersize  = 14,
    color       = ANYPLOT_SEQ[0.0],
    strokecolor = INK,
    strokewidth = 1.5)

# Right panel — Archimedean spiral
ax2 = Axis(
    fig[1, 2];
    title              = "Archimedean Spiral · t·cos(t), t·sin(t)",
    titlesize          = 18,
    titlecolor         = INK,
    xlabel             = "x = t·cos(t)",
    ylabel             = "y = t·sin(t)",
    xlabelsize         = 13,
    ylabelsize         = 13,
    xlabelcolor        = INK,
    ylabelcolor        = INK,
    xticklabelsize     = 11,
    yticklabelsize     = 11,
    xticklabelcolor    = INK_SOFT,
    yticklabelcolor    = INK_SOFT,
    xtickcolor         = INK_SOFT,
    ytickcolor         = INK_SOFT,
    backgroundcolor    = PAGE_BG,
    topspinevisible    = false,
    rightspinevisible  = false,
    leftspinecolor     = spine_color,
    bottomspinecolor   = spine_color,
    xgridcolor         = grid_color,
    ygridcolor         = grid_color,
    aspect             = DataAspect(),
)

lines!(ax2, x_spiral, y_spiral;
    color     = t_norm,
    colormap  = ANYPLOT_SEQ,
    linewidth = 2.5)

# Start at origin, end at outermost point
scatter!(ax2, [x_spiral[1]], [y_spiral[1]];
    marker      = :circle,
    markersize  = 14,
    color       = ANYPLOT_SEQ[0.0],
    strokecolor = INK,
    strokewidth = 1.5)

scatter!(ax2, [x_spiral[end]], [y_spiral[end]];
    marker      = :diamond,
    markersize  = 14,
    color       = ANYPLOT_SEQ[1.0],
    strokecolor = INK,
    strokewidth = 1.5)

# Mid-curve directional label near spiral midpoint (t ≈ 2π: x ≈ 6.28, y ≈ 0)
text!(ax2, 5.0, 1.8; text = "t = 2π →", color = INK_SOFT, fontsize = 11, font = :italic, align = (:left, :bottom))

# Colorbar — shared direction legend for both panels
Colorbar(
    fig[1, 3];
    colormap       = ANYPLOT_SEQ,
    limits         = (0.0, 1.0),
    label          = "direction of t →",
    labelcolor     = INK,
    ticklabelcolor = INK_SOFT,
    tickcolor      = INK_SOFT,
    ticks          = ([0.0, 1.0], ["start", "end"]),
)

colgap!(fig.layout, 1, 20)
colgap!(fig.layout, 2, 12)
rowgap!(fig.layout, 1, 12)

save("plot-$(THEME).png", fig; px_per_unit = 2)
Runnable source as JSON, for any HTTP client: https://api.anyplot.ai/specs/line-parametric/makie/code. Any spec id and library id listed in llms-full.txt fit the same URL shape; every URL below is complete and callable.
{
  "spec_id": "line-parametric",
  "language": "julia",
  "library": "makie",
  "page": "https://anyplot.ai/line-parametric/julia/makie",
  "hub": "https://anyplot.ai/line-parametric",
  "code_json": "https://api.anyplot.ai/specs/line-parametric/makie/code",
  "spec_json": "https://api.anyplot.ai/specs/line-parametric",
  "render_light_png": "https://storage.googleapis.com/anyplot-images/plots/line-parametric/julia/makie/plot-light.png",
  "render_dark_png": "https://storage.googleapis.com/anyplot-images/plots/line-parametric/julia/makie/plot-dark.png",
  "quality_score": 90.0,
  "license": "MIT",
  "guide": "https://anyplot.ai/llms.txt"
}
Part of Parametric Curve Plot on anyplot.ai.