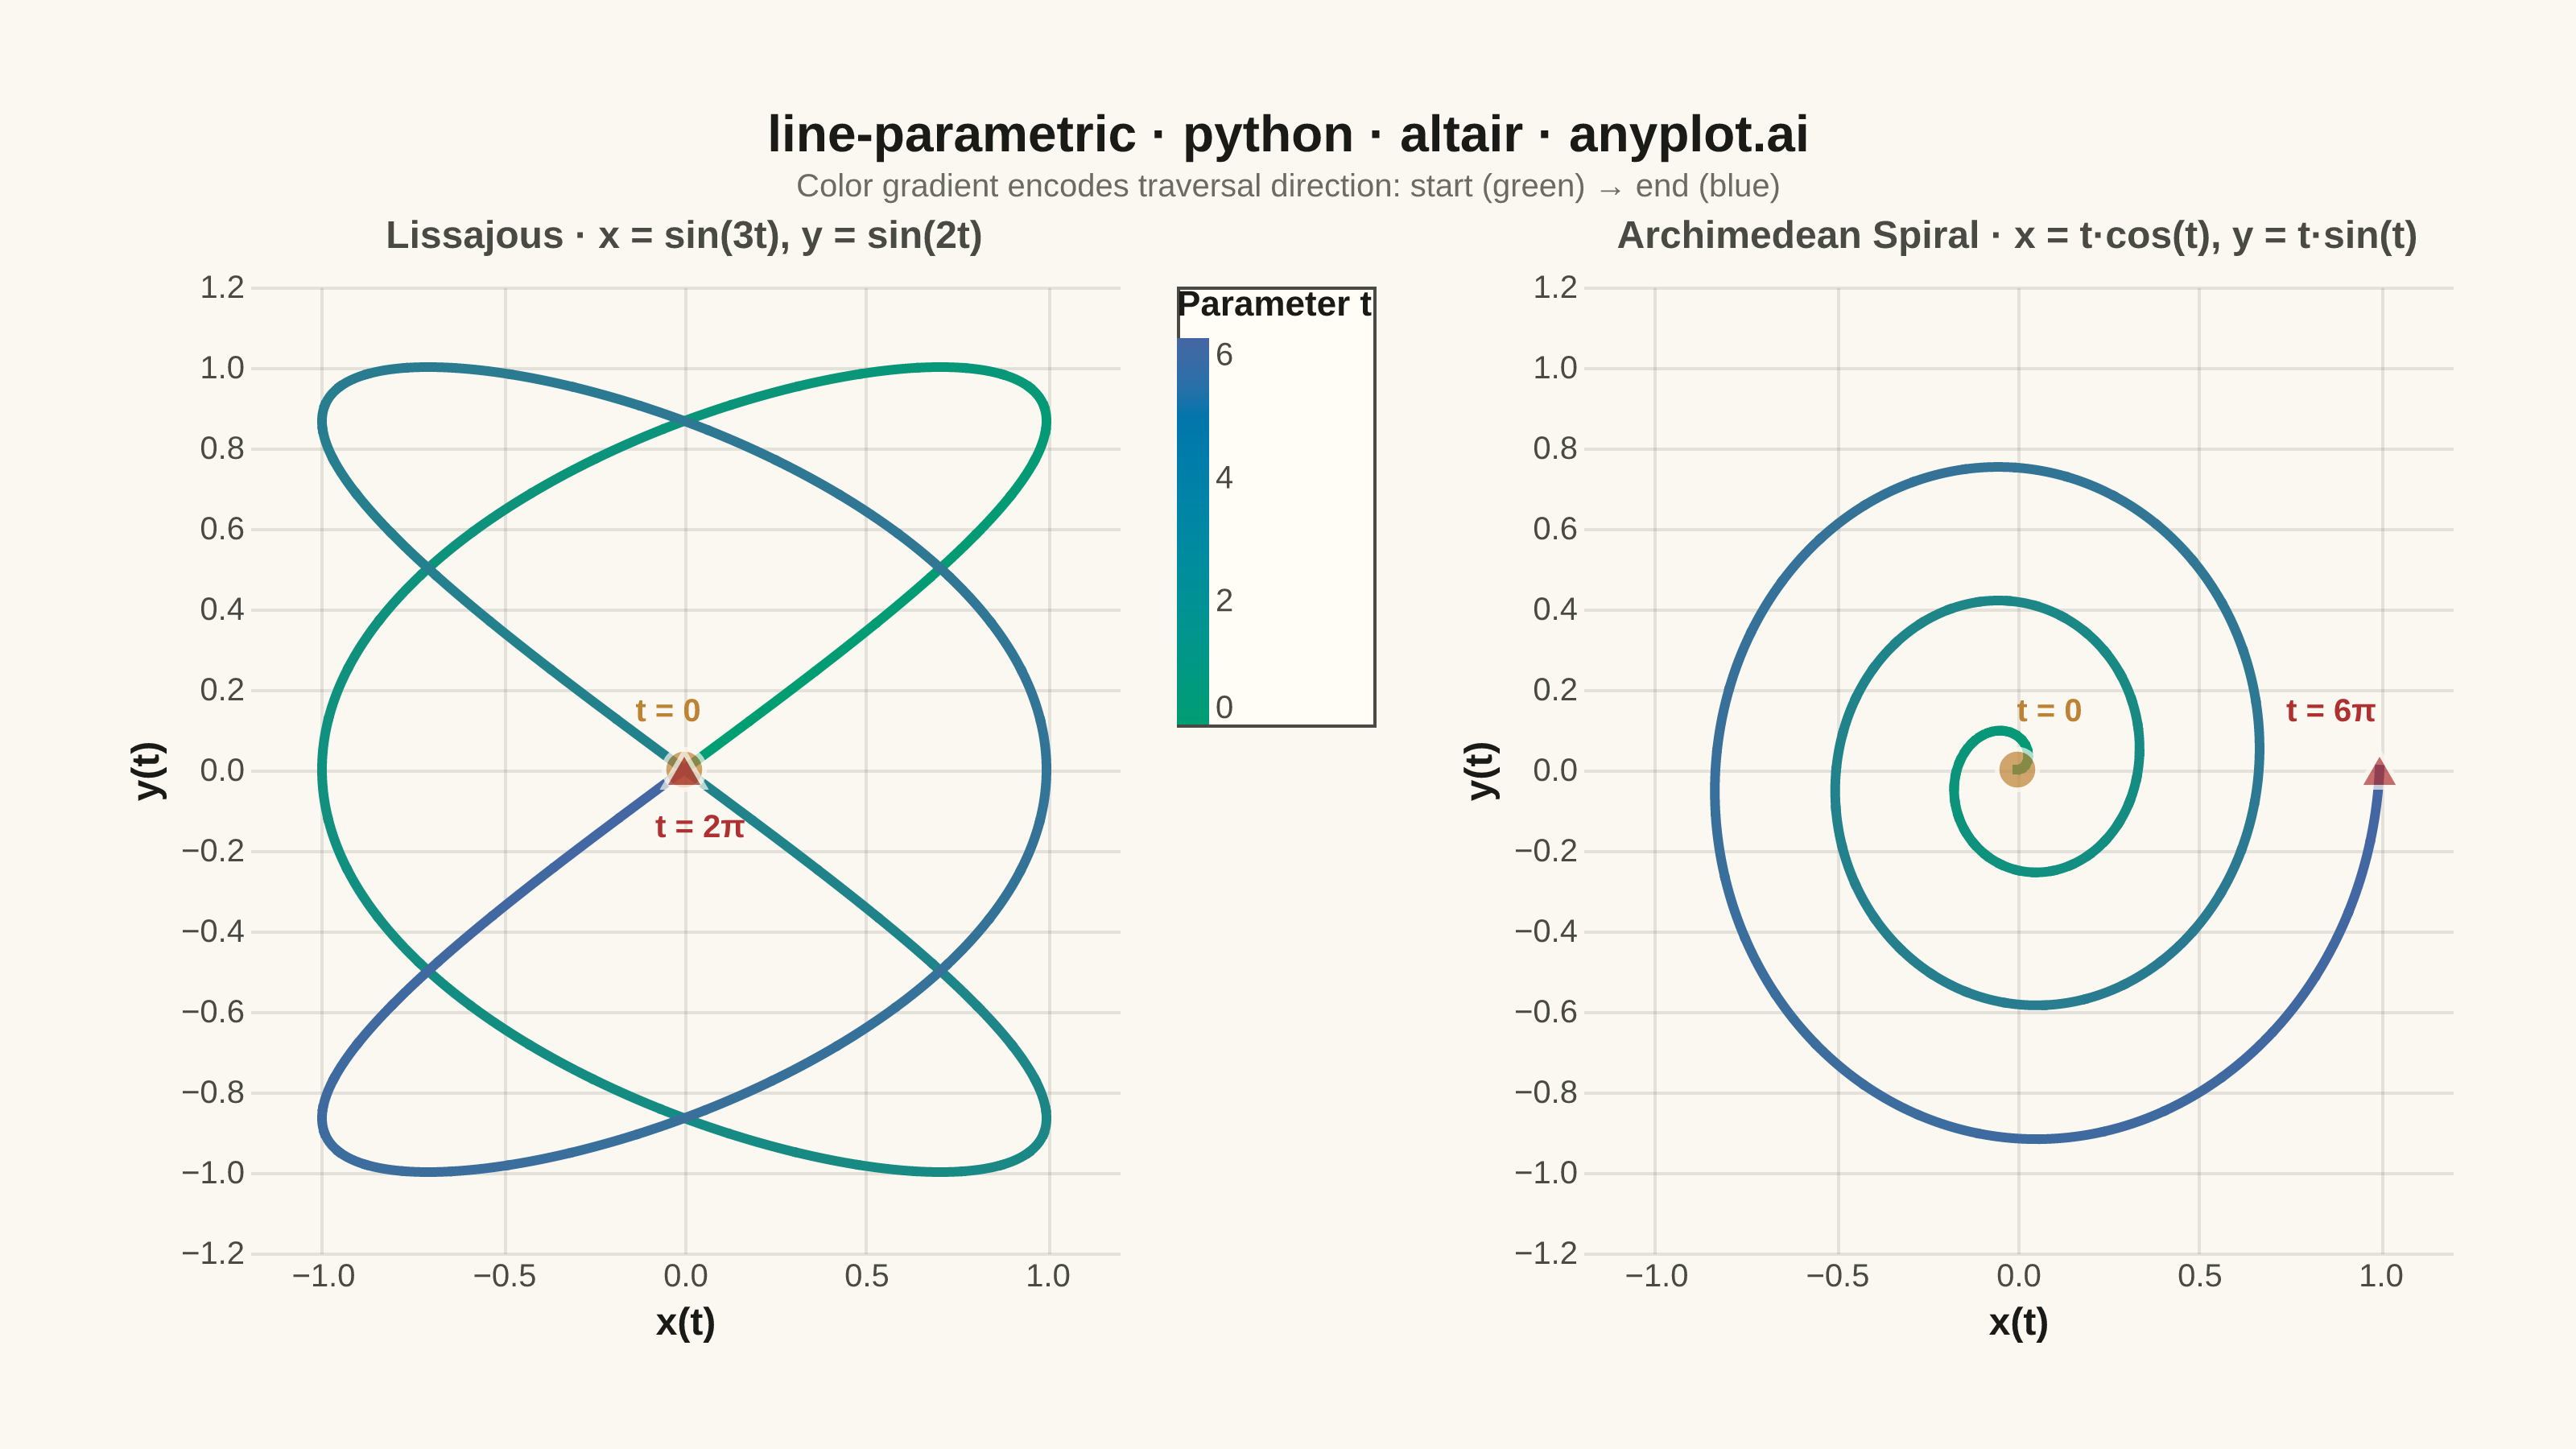
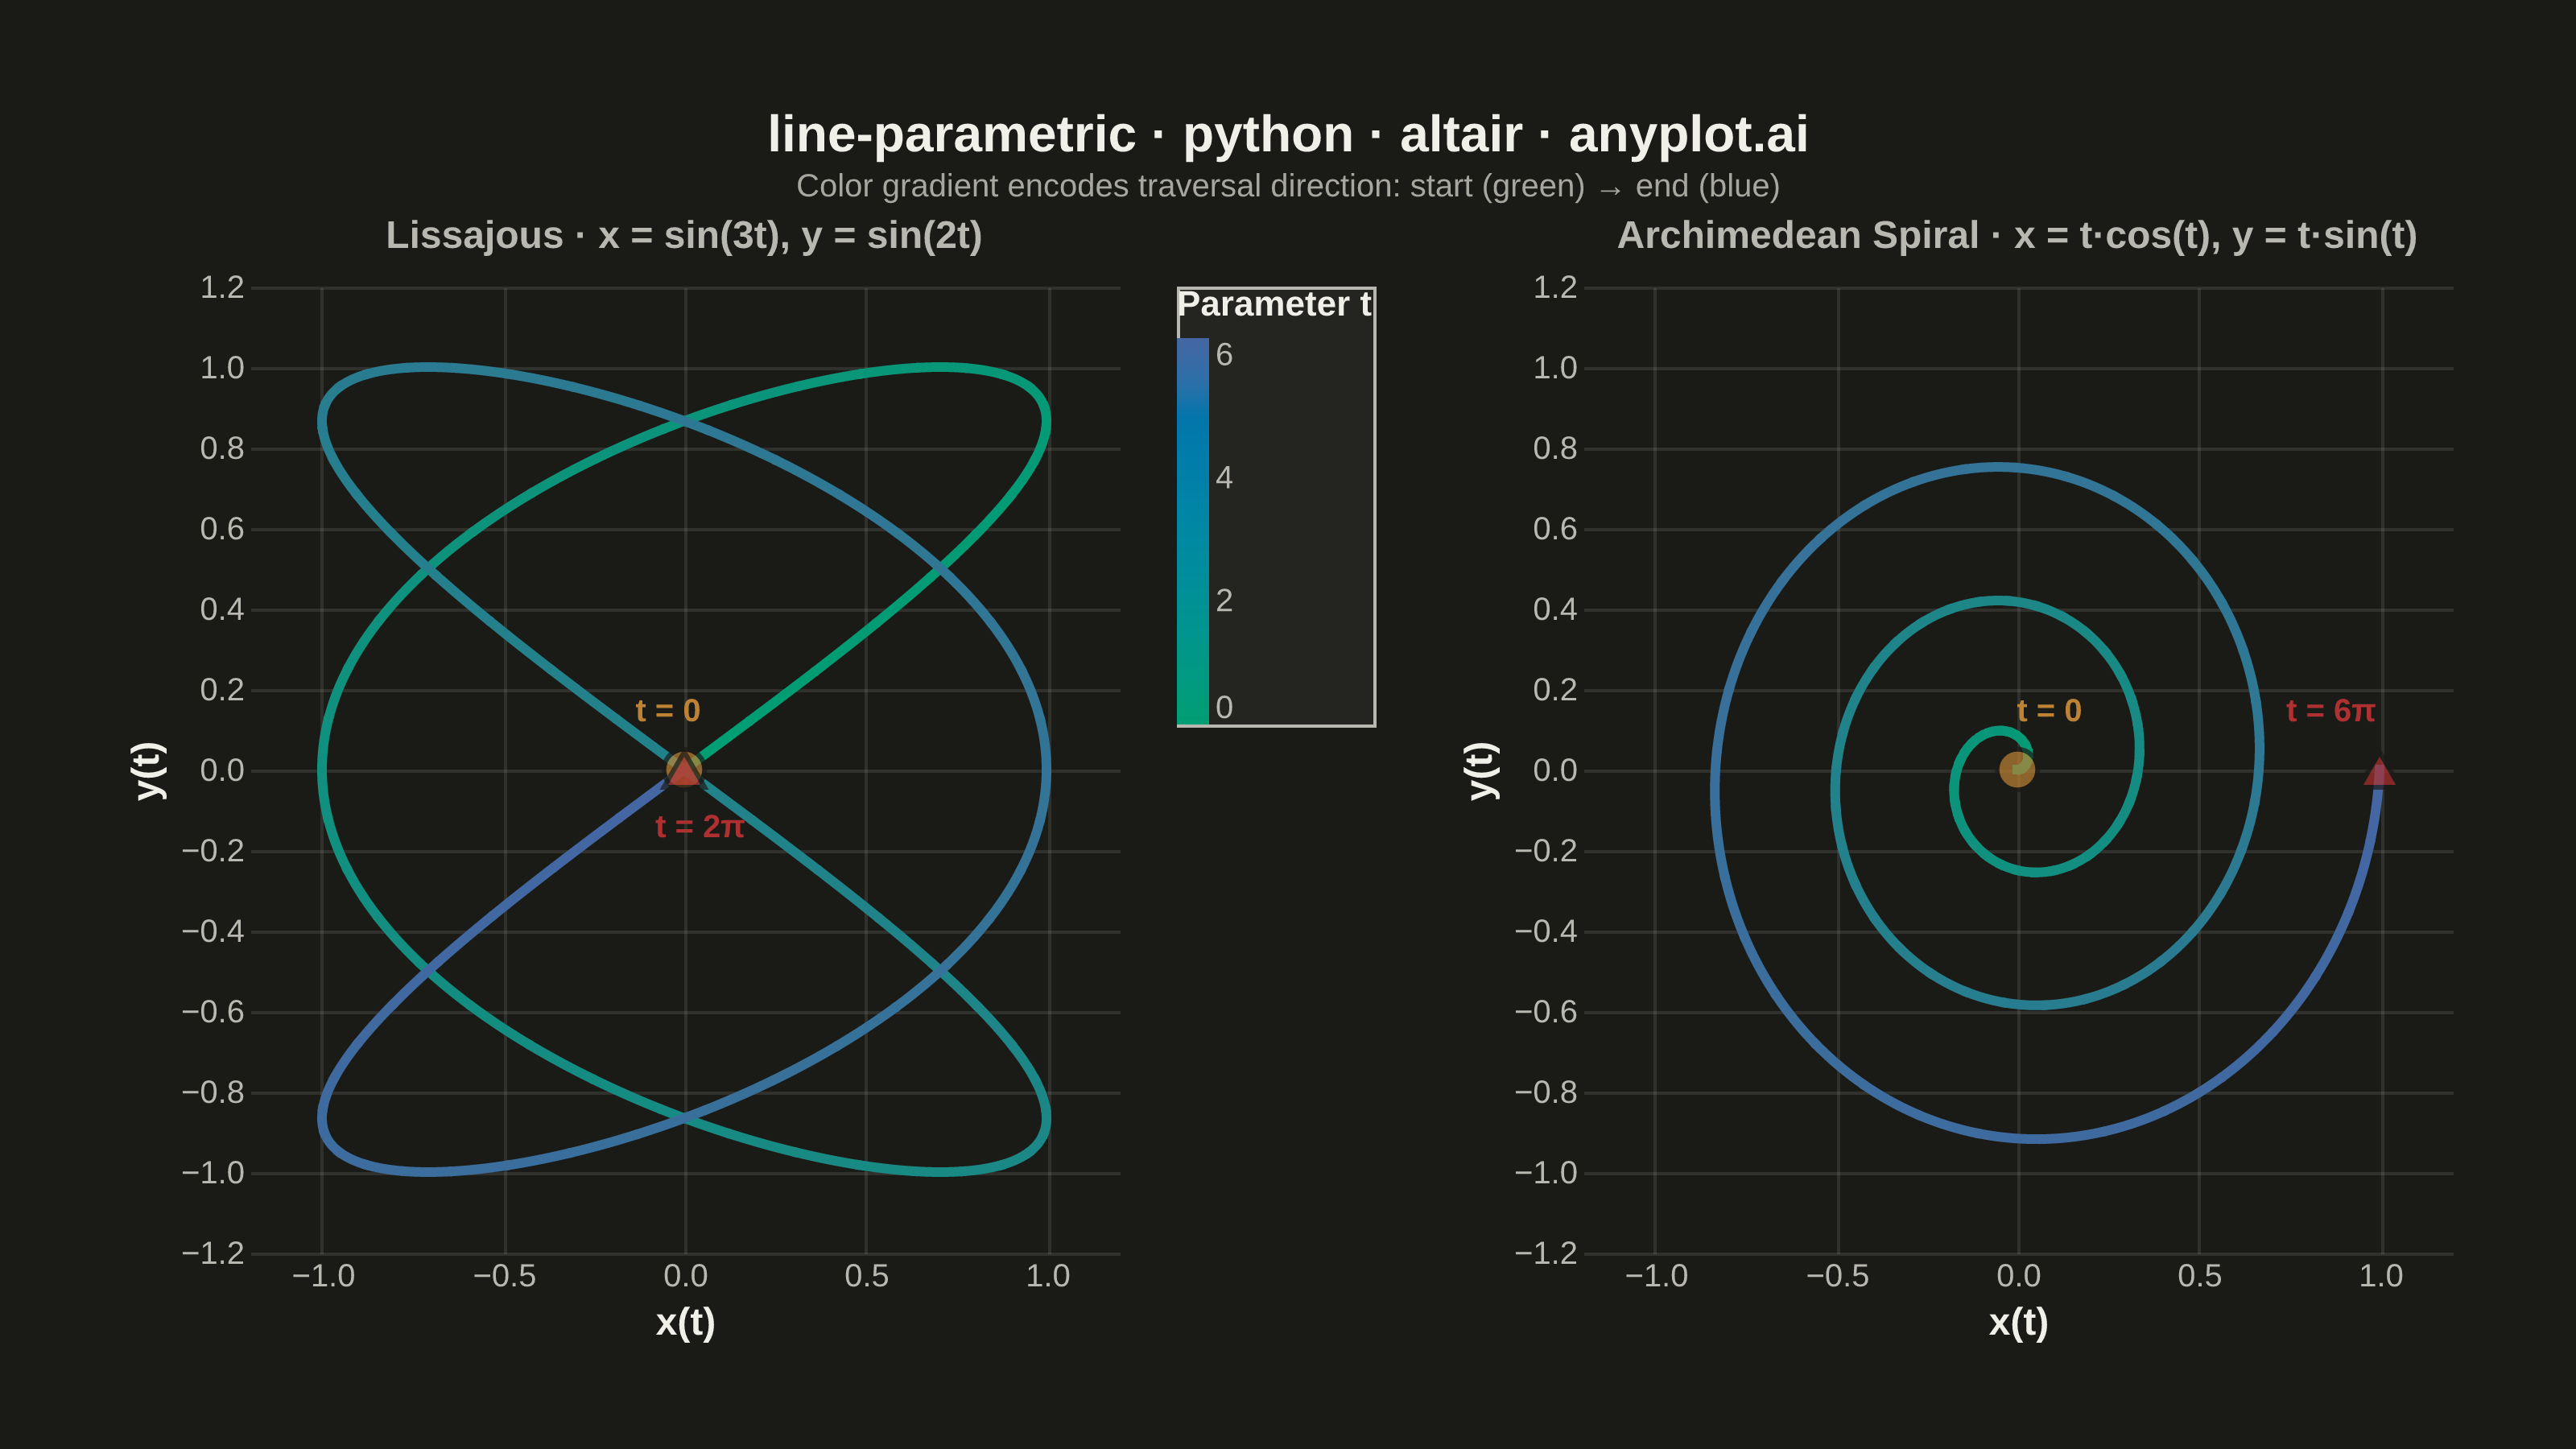
A parametric curve plot visualizes x(t) and y(t) as functions of a parameter t, tracing smooth curves in 2D space. Unlike standard function plots where y = f(x), parametric curves can loop, self-intersect, and form closed shapes such as Lissajous figures, spirals, and cardioids. This makes them essential for representing trajectories, oscillations, and classical mathematical curves that cannot be expressed as single-valued functions.
""" anyplot.ai
line-parametric: Parametric Curve Plot
Library: altair 6.2.1 | Python 3.13.14
Quality: 86/100 | Updated: 2026-06-20
"""

import sys


sys.path = sys.path[1:]  # prevent local altair.py from shadowing the altair package

import os

import altair as alt
import numpy as np
import pandas as pd
from PIL import Image


# Theme tokens (Imprint palette — see prompts/default-style-guide.md)
THEME = os.getenv("ANYPLOT_THEME", "light")
PAGE_BG = "#FAF8F1" if THEME == "light" else "#1A1A17"
ELEVATED_BG = "#FFFDF6" if THEME == "light" else "#242420"
INK = "#1A1A17" if THEME == "light" else "#F0EFE8"
INK_SOFT = "#4A4A44" if THEME == "light" else "#B8B7B0"
INK_MUTED = "#6B6A63" if THEME == "light" else "#A8A79F"
MARKER_START = "#BD8233"  # Imprint ochre — start of traversal
MARKER_END = "#AE3030"  # Imprint matte red — end of traversal

# Data
t_liss = np.linspace(0, 2 * np.pi, 1200)
t_spir = np.linspace(0, 6 * np.pi, 1200)

df_liss = pd.DataFrame({"x": np.sin(3 * t_liss), "y": np.sin(2 * t_liss), "t": t_liss})
df_spir = pd.DataFrame(
    {"x": t_spir * np.cos(t_spir) / (6 * np.pi), "y": t_spir * np.sin(t_spir) / (6 * np.pi), "t": t_spir}
)

# Discrete gradient: 100 colors interpolated from Imprint sequential (#009E73 → #4467A3)
# mark_trail/mark_line with quantitative color encoding don't render path geometry in
# Vega-Lite v6.4 — workaround: N layered mark_line segments with constant colors each.
# 100 segments closes the visible gap artifacts that 30 segments produced.
N_SEG = 100
_c0 = np.array([0, 158, 115])  # #009E73
_c1 = np.array([68, 103, 163])  # #4467A3
seg_colors = ["#{:02x}{:02x}{:02x}".format(*(_c0 + (_c1 - _c0) * i / (N_SEG - 1)).astype(int)) for i in range(N_SEG)]

# Shared axis / scale config
scale_xy = alt.Scale(domain=[-1.15, 1.15])
axis_cfg = alt.Axis(labelFontSize=10, titleFontSize=12, domain=False, ticks=False)
color_scale = alt.Scale(range=["#009E73", "#4467A3"])
grad_legend = alt.Legend(gradientLength=120, gradientThickness=10, orient="right")

# Panel configs
panel_configs = [
    {
        "df": df_liss,
        "title": "Lissajous · x = sin(3t), y = sin(2t)",
        "xs": 0.0,
        "ys": 0.0,  # t=0 and t=2π both map to (0, 0) for this curve
        "xe": 0.0,
        "ye": 0.0,
        "ls": "t = 0",
        "le": "t = 2π",
        "dys": -18,
        "dxs": -5,
        "dye": 18,
        "dxe": 5,
        "legend": grad_legend,
    },
    {
        "df": df_spir,
        "title": "Archimedean Spiral · x = t·cos(t), y = t·sin(t)",
        "xs": float(df_spir["x"].iloc[0]),
        "ys": float(df_spir["y"].iloc[0]),
        "xe": float(df_spir["x"].iloc[-1]),
        "ye": float(df_spir["y"].iloc[-1]),
        "ls": "t = 0",
        "le": "t = 6π",
        "dys": -18,
        "dxs": 10,
        "dye": -18,
        "dxe": -15,
        "legend": None,
    },
]


def build_gradient_segments(df, n_seg, colors, scale_xy, axis_cfg):
    t_vals = df["t"].values
    t_breaks = np.linspace(t_vals[0], t_vals[-1], n_seg + 1)
    layers = []
    for i in range(n_seg):
        mask = (t_vals >= t_breaks[i]) & (t_vals <= t_breaks[i + 1])
        df_seg = df[mask]
        if len(df_seg) < 2:
            continue
        layers.append(
            alt.Chart(df_seg)
            .mark_line(strokeWidth=3, color=colors[i], clip=True, strokeCap="square")
            .encode(
                x=alt.X("x:Q", title="x(t)", scale=scale_xy, axis=axis_cfg),
                y=alt.Y("y:Q", title="y(t)", scale=scale_xy, axis=axis_cfg),
                order=alt.Order("t:Q"),
            )
        )
    return layers


panels = []
for c in panel_configs:
    df = c["df"]
    seg_layers = build_gradient_segments(df, N_SEG, seg_colors, scale_xy, axis_cfg)

    # Invisible dummy to carry the gradient legend and set the color scale domain
    df_ends = df.iloc[[0, -1]][["x", "y", "t"]].copy()
    dummy = (
        alt.Chart(df_ends)
        .mark_point(opacity=0, size=0)
        .encode(
            x=alt.X("x:Q", scale=scale_xy),
            y=alt.Y("y:Q", scale=scale_xy),
            color=alt.Color("t:Q", title="Parameter t", scale=color_scale, legend=c["legend"]),
        )
    )

    curve = alt.layer(*seg_layers, dummy)

    df_s = pd.DataFrame({"x": [c["xs"]], "y": [c["ys"]]})
    df_e = pd.DataFrame({"x": [c["xe"]], "y": [c["ye"]]})

    s_dot = (
        alt.Chart(df_s)
        .mark_point(size=160, filled=True, color=MARKER_START, stroke=PAGE_BG, strokeWidth=1.5)
        .encode(x="x:Q", y="y:Q")
    )
    e_dot = (
        alt.Chart(df_e)
        .mark_point(size=160, shape="triangle-up", filled=True, color=MARKER_END, stroke=PAGE_BG, strokeWidth=1.5)
        .encode(x="x:Q", y="y:Q")
    )
    s_lbl = (
        alt.Chart(df_s)
        .mark_text(fontSize=10, fontWeight="bold", dy=c["dys"], dx=c["dxs"], color=MARKER_START)
        .encode(x="x:Q", y="y:Q", text=alt.value(c["ls"]))
    )
    e_lbl = (
        alt.Chart(df_e)
        .mark_text(fontSize=10, fontWeight="bold", dy=c["dye"], dx=c["dxe"], color=MARKER_END)
        .encode(x="x:Q", y="y:Q", text=alt.value(c["le"]))
    )

    panels.append(
        (curve + s_dot + e_dot + s_lbl + e_lbl).properties(
            width=270, height=300, title=alt.Title(c["title"], fontSize=12, color=INK_SOFT)
        )
    )

# Combine panels
chart = (
    alt.hconcat(*panels, spacing=25)
    .resolve_scale(color="independent")
    .properties(
        background=PAGE_BG,
        title=alt.Title(
            "line-parametric · python · altair · anyplot.ai",
            fontSize=16,
            anchor="middle",
            color=INK,
            subtitle="Color gradient encodes traversal direction: start (green) → end (blue)",
            subtitleFontSize=10,
            subtitleColor=INK_MUTED,
        ),
    )
    .configure_view(strokeWidth=0, fill=PAGE_BG)
    .configure_axis(
        gridColor=INK, gridOpacity=0.10, domainColor=INK_SOFT, tickColor=INK_SOFT, labelColor=INK_SOFT, titleColor=INK
    )
    .configure_title(color=INK)
    .configure_legend(fillColor=ELEVATED_BG, strokeColor=INK_SOFT, labelColor=INK_SOFT, titleColor=INK)
)

# Save — canvas gate: 3200 × 1800 (landscape 16:9)
TW, TH = 3200, 1800
chart.save(f"plot-{THEME}.png", scale_factor=4.0)

_img = Image.open(f"plot-{THEME}.png").convert("RGB")
_w, _h = _img.size
if _w > TW or _h > TH:
    raise SystemExit(
        f"altair vl-convert produced {_w}×{_h}, exceeds target {TW}×{TH}. "
        f"Shrink chart .properties(width=, height=) values and re-render."
    )
if _w < TW or _h < TH:
    _canvas = Image.new("RGB", (TW, TH), PAGE_BG)
    _canvas.paste(_img, ((TW - _w) // 2, (TH - _h) // 2))
    _canvas.save(f"plot-{THEME}.png")

chart.save(f"plot-{THEME}.html")
Runnable source as JSON, for any HTTP client: https://api.anyplot.ai/specs/line-parametric/altair/code. Any spec id and library id listed in llms-full.txt fit the same URL shape; every URL below is complete and callable.
{
  "spec_id": "line-parametric",
  "language": "python",
  "library": "altair",
  "page": "https://anyplot.ai/line-parametric/python/altair",
  "hub": "https://anyplot.ai/line-parametric",
  "code_json": "https://api.anyplot.ai/specs/line-parametric/altair/code",
  "spec_json": "https://api.anyplot.ai/specs/line-parametric",
  "render_light_png": "https://storage.googleapis.com/anyplot-images/plots/line-parametric/python/altair/plot-light.png",
  "render_dark_png": "https://storage.googleapis.com/anyplot-images/plots/line-parametric/python/altair/plot-dark.png",
  "interactive_light_html": "https://storage.googleapis.com/anyplot-images/plots/line-parametric/python/altair/plot-light.html",
  "interactive_dark_html": "https://storage.googleapis.com/anyplot-images/plots/line-parametric/python/altair/plot-dark.html",
  "quality_score": 86.0,
  "license": "MIT",
  "guide": "https://anyplot.ai/llms.txt"
}
Part of Parametric Curve Plot on anyplot.ai.