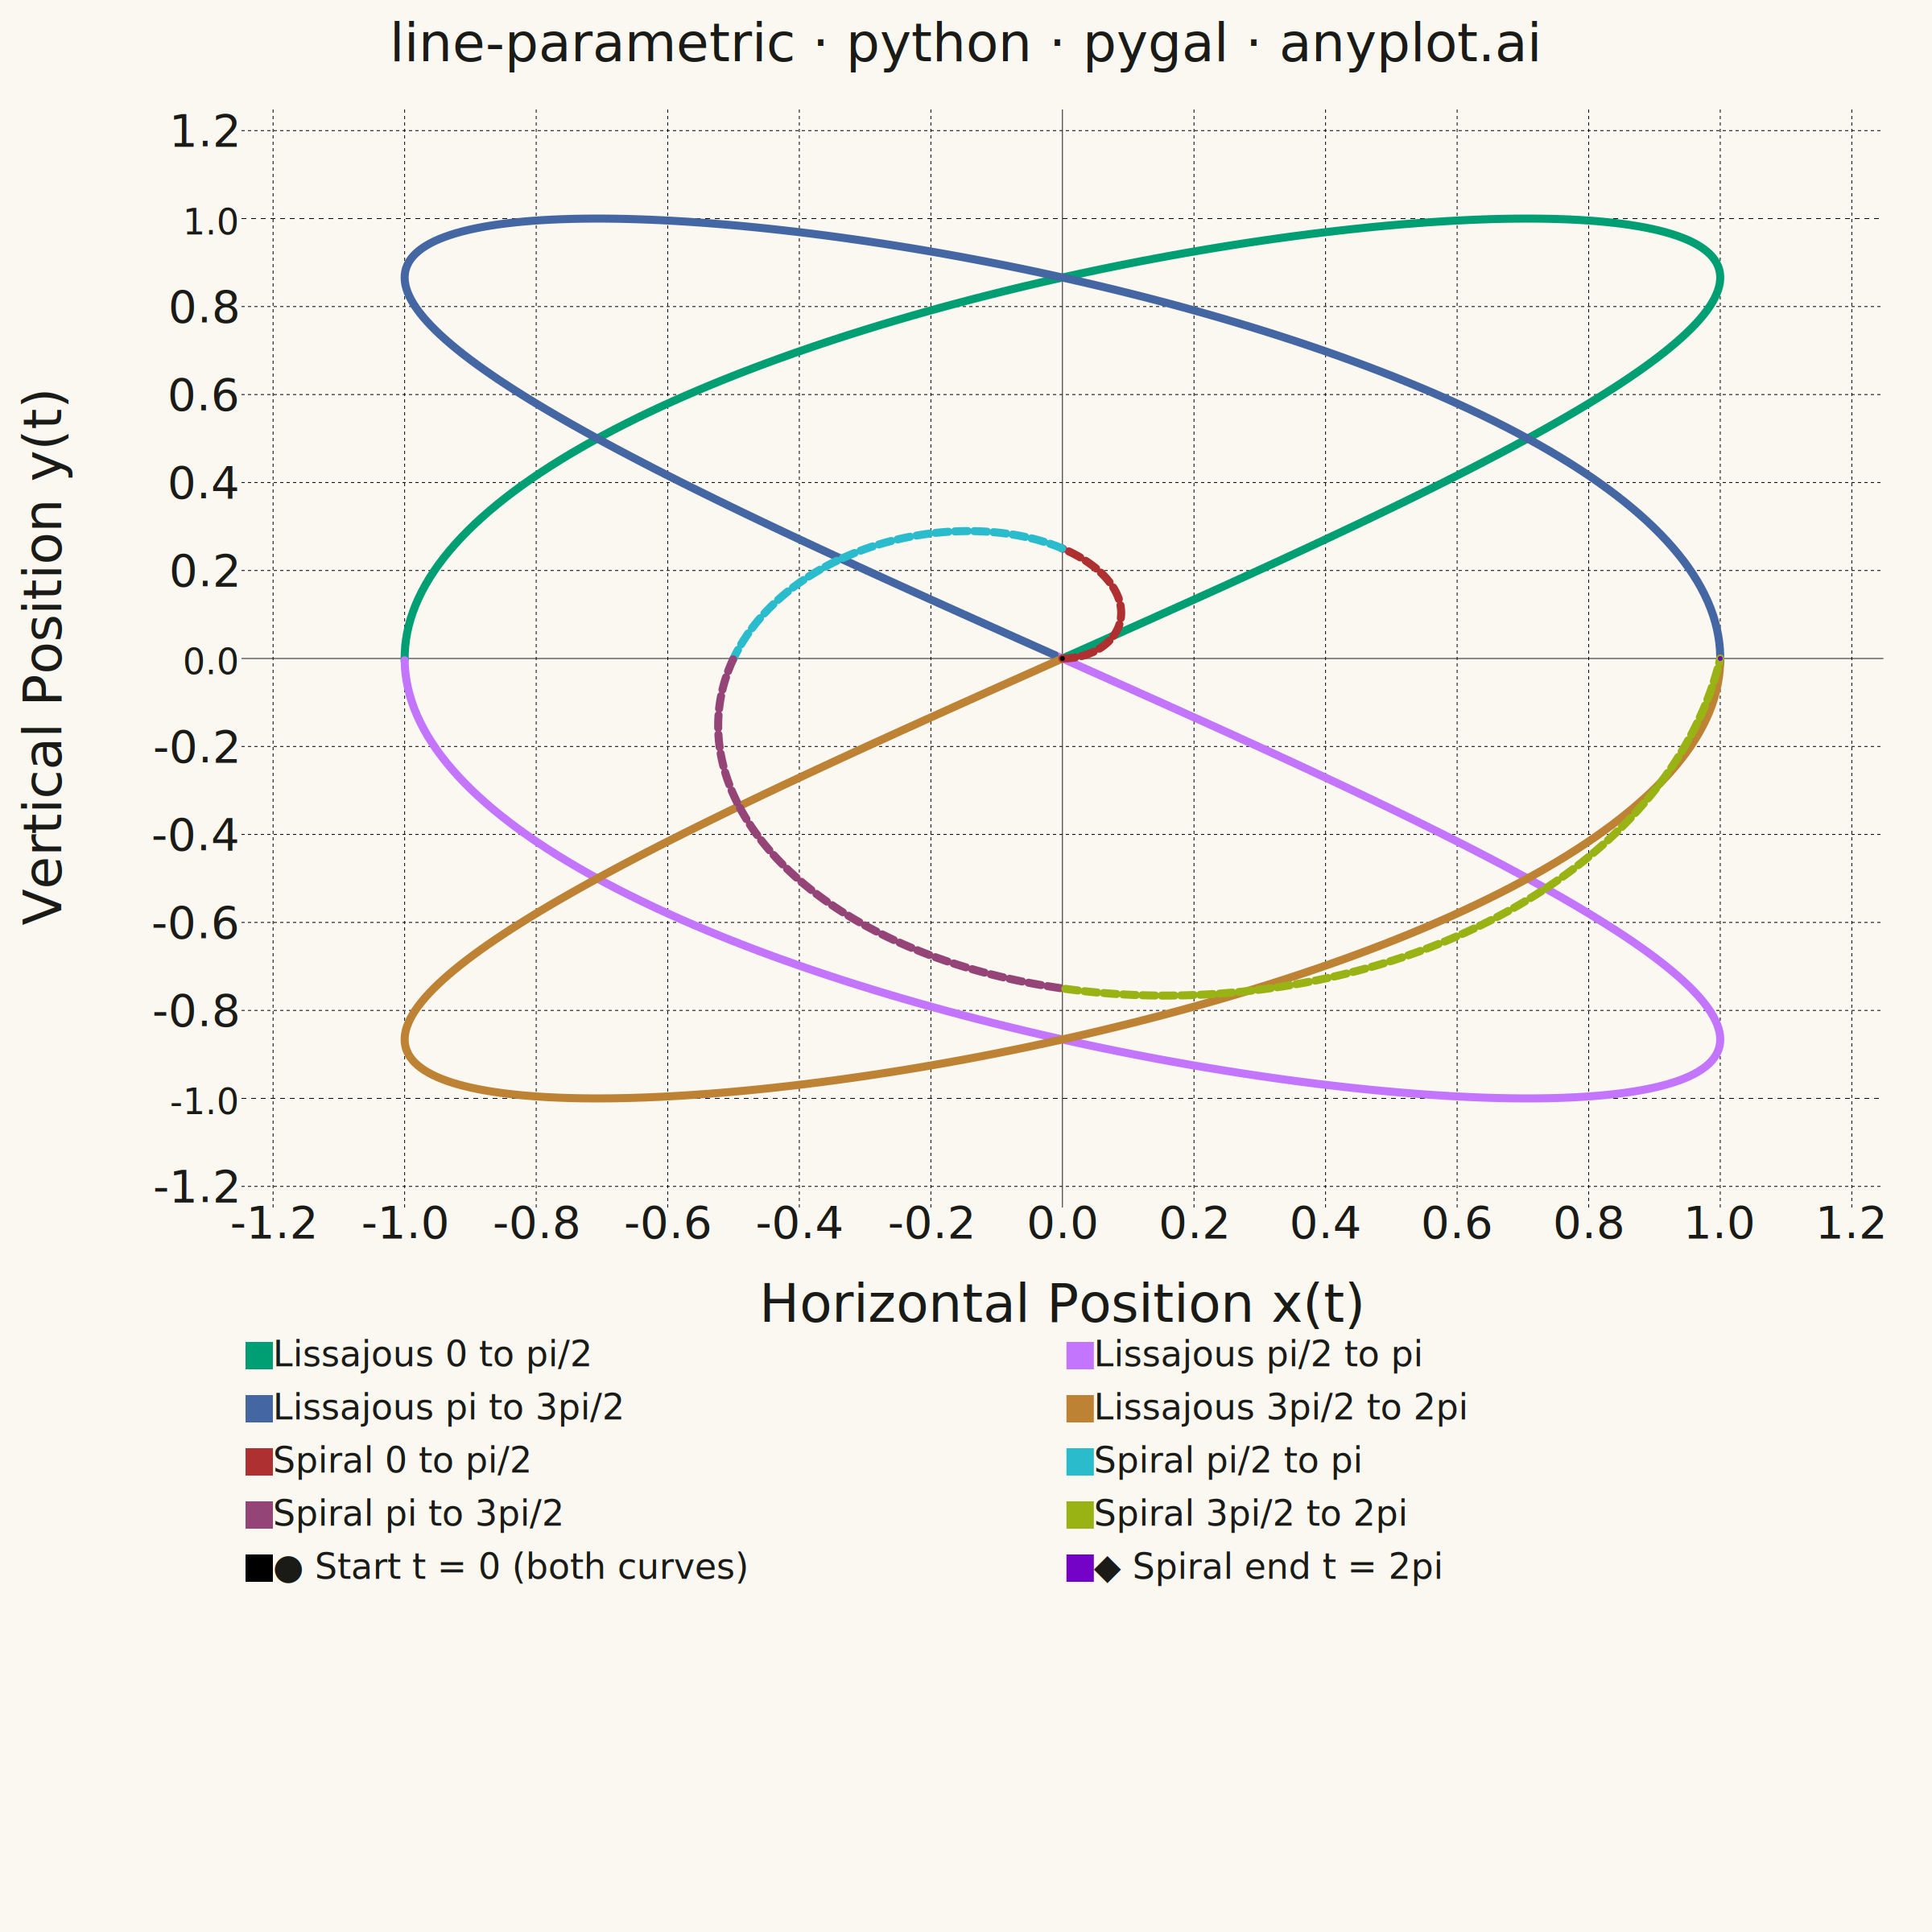
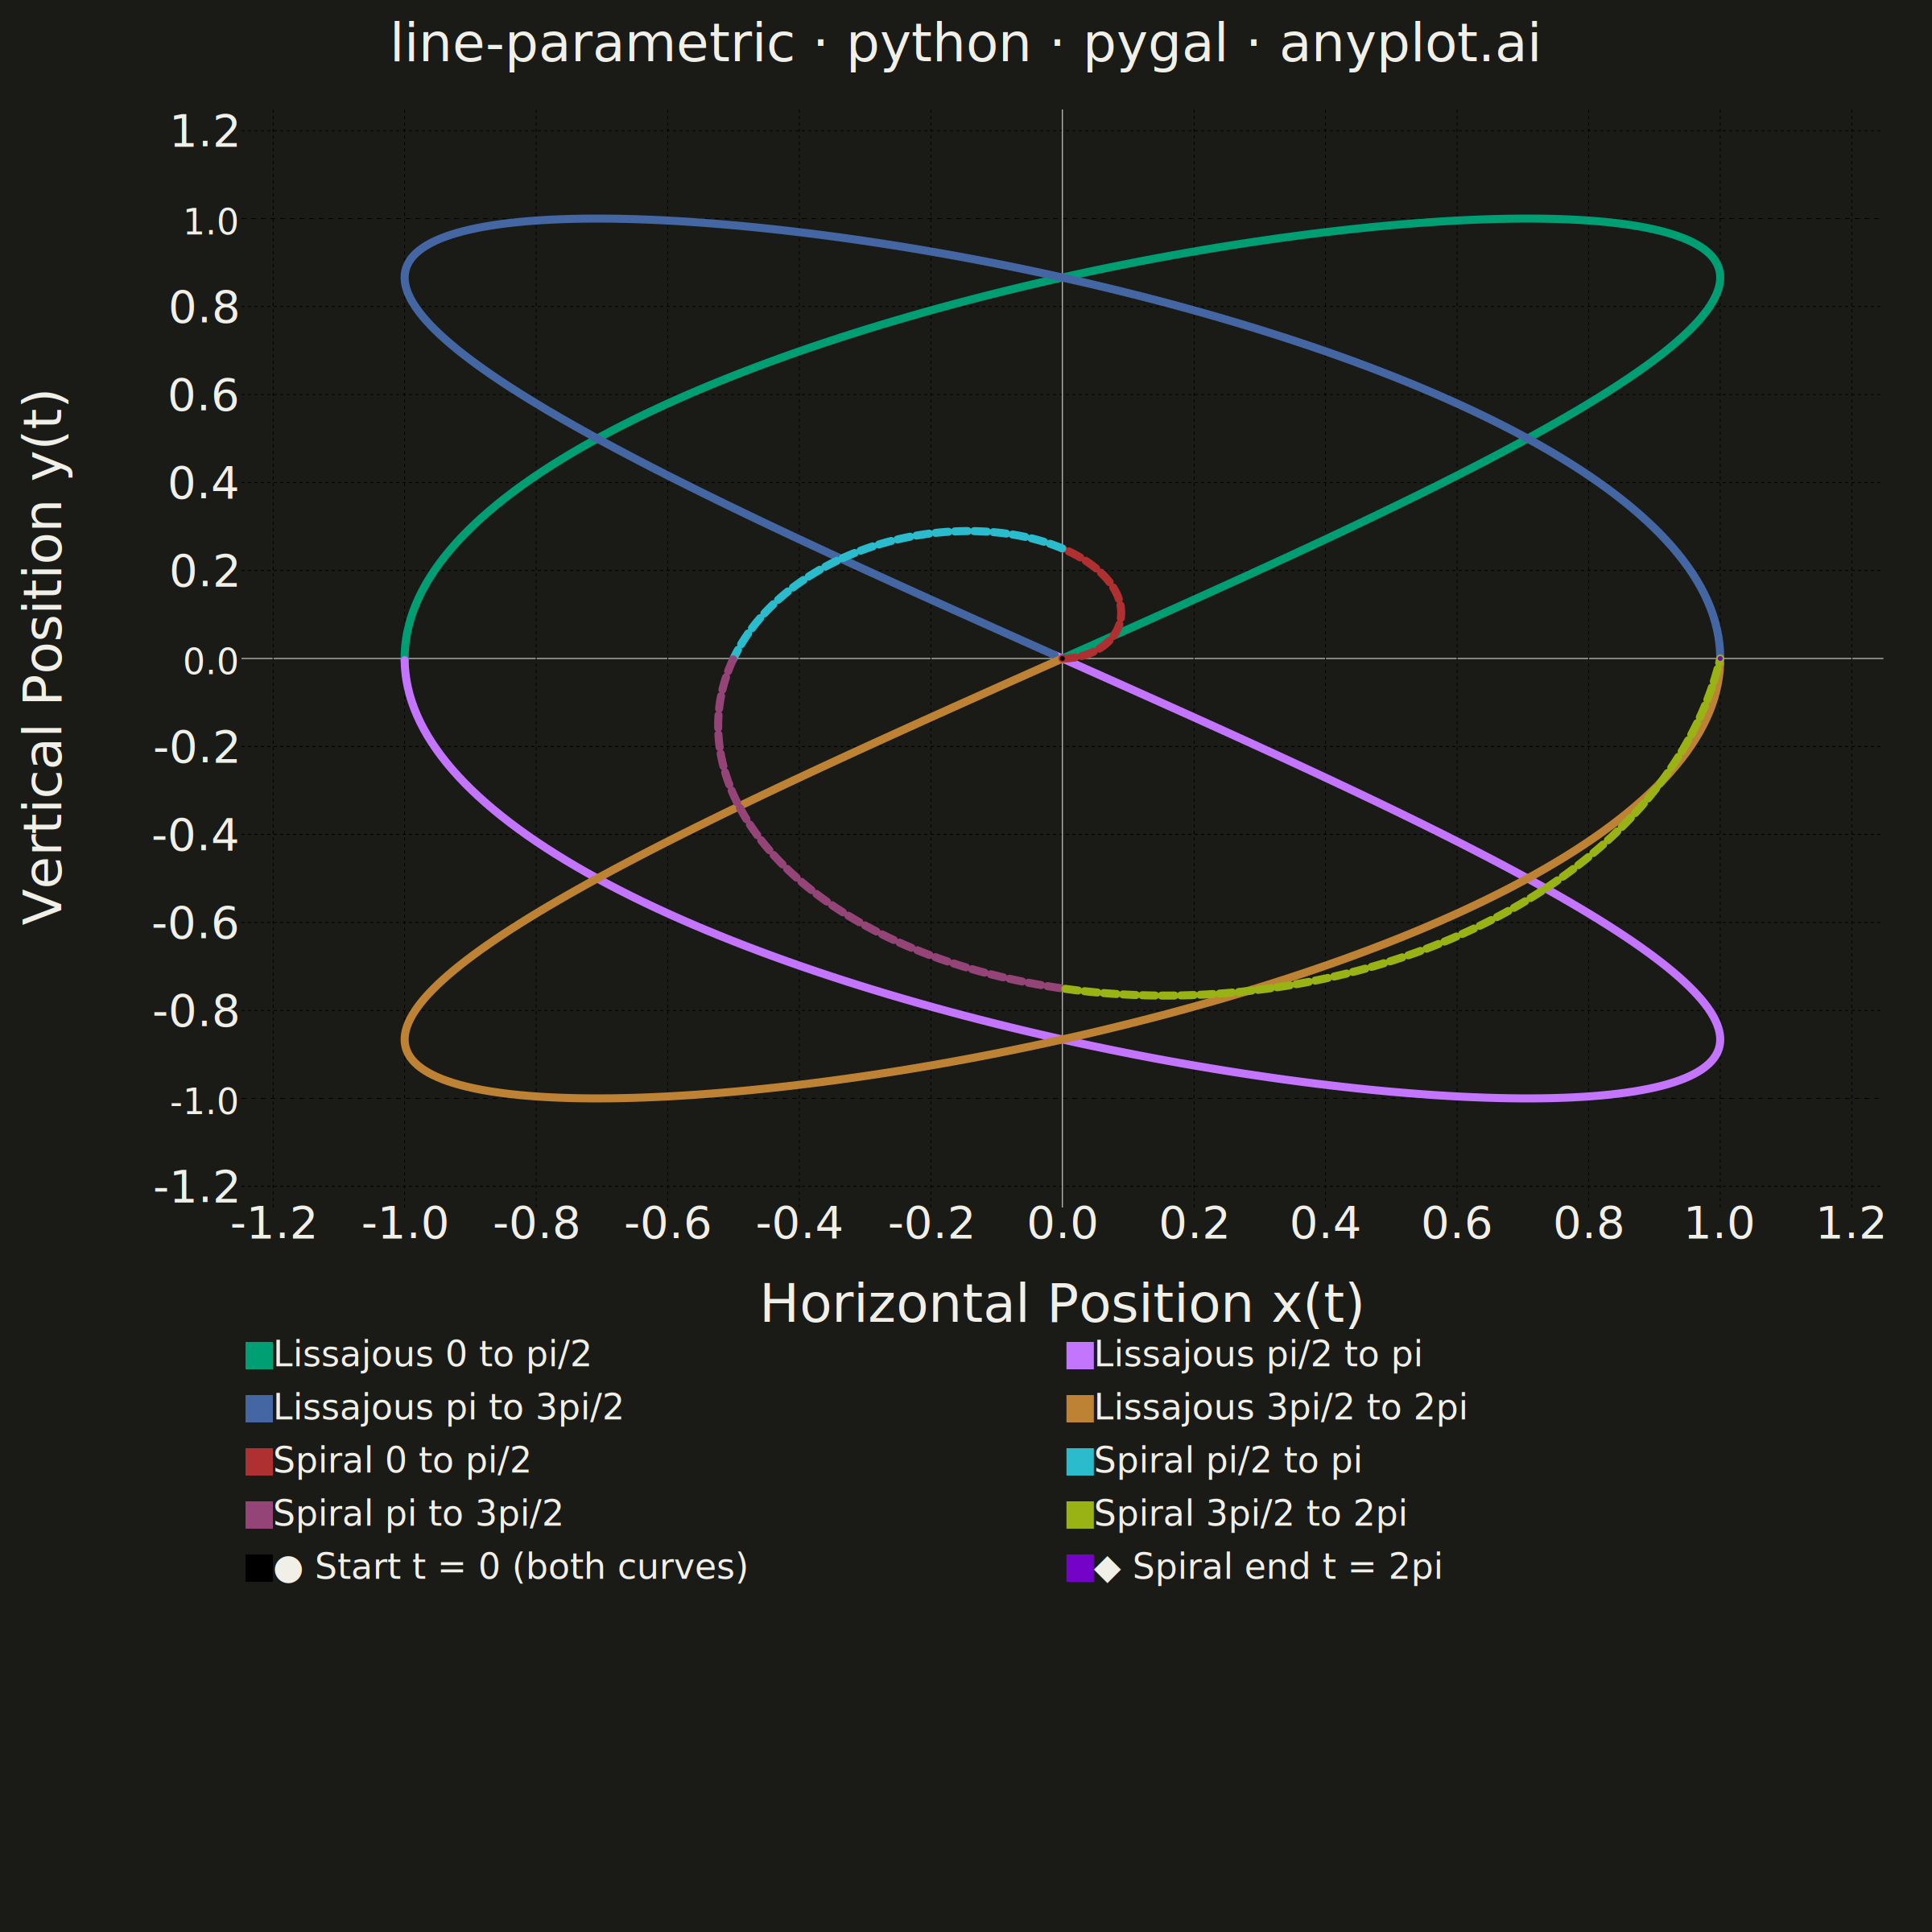
A parametric curve plot visualizes x(t) and y(t) as functions of a parameter t, tracing smooth curves in 2D space. Unlike standard function plots where y = f(x), parametric curves can loop, self-intersect, and form closed shapes such as Lissajous figures, spirals, and cardioids. This makes them essential for representing trajectories, oscillations, and classical mathematical curves that cannot be expressed as single-valued functions.
""" anyplot.ai
line-parametric: Parametric Curve Plot
Library: pygal 3.1.3 | Python 3.13.14
Quality: 82/100 | Updated: 2026-06-20
"""

import os

import numpy as np
import pygal
from pygal.style import Style


THEME = os.getenv("ANYPLOT_THEME", "light")

# Theme-adaptive chrome tokens
PAGE_BG = "#FAF8F1" if THEME == "light" else "#1A1A17"
INK = "#1A1A17" if THEME == "light" else "#F0EFE8"
INK_MUTED = "#6B6A63" if THEME == "light" else "#A8A79F"

# Imprint categorical palette — canonical order
IMPRINT_PALETTE = (
    "#009E73",  # 1 brand green   — Lissajous start
    "#C475FD",  # 2 lavender      — Lissajous 2nd quarter
    "#4467A3",  # 3 blue          — Lissajous 3rd quarter
    "#BD8233",  # 4 ochre         — Lissajous end
    "#AE3030",  # 5 matte red     — Spiral start
    "#2ABCCD",  # 6 cyan          — Spiral 2nd quarter
    "#954477",  # 7 rose          — Spiral 3rd quarter
    "#99B314",  # 8 lime          — Spiral end
)

# Data
n_points = 800
n_segs = 4
seg_size = n_points // n_segs

# Curve 1: Lissajous (3, 2) — x = sin(3t), y = sin(2t), t in [0, 2pi] — closed curve
t_liss = np.linspace(0, 2 * np.pi, n_points)
liss_x = np.sin(3 * t_liss)
liss_y = np.sin(2 * t_liss)

# Curve 2: Archimedean spiral — x = (t/2pi)*cos(t), y = (t/2pi)*sin(t), t in [0, 2pi]
# Normalised so radius reaches 1.0 at t=2pi, fitting the [-1.2, 1.2] axis range
t_spiral = np.linspace(0, 2 * np.pi, n_points)
spiral_x = (t_spiral / (2 * np.pi)) * np.cos(t_spiral)
spiral_y = (t_spiral / (2 * np.pi)) * np.sin(t_spiral)

font = "DejaVu Sans, Helvetica, Arial, sans-serif"

custom_style = Style(
    background=PAGE_BG,
    plot_background=PAGE_BG,
    foreground=INK,
    foreground_strong=INK,
    foreground_subtle=INK_MUTED,
    colors=IMPRINT_PALETTE,
    font_family=font,
    title_font_family=font,
    title_font_size=66,
    label_font_size=56,
    major_label_font_size=44,
    legend_font_size=44,
    value_font_size=36,
    tooltip_font_size=36,
    tooltip_font_family=font,
    opacity=1.0,
    stroke_opacity=1.0,
    stroke_width=10,
)

chart = pygal.XY(
    width=2400,
    height=2400,
    style=custom_style,
    title="line-parametric · python · pygal · anyplot.ai",
    x_title="Horizontal Position  x(t)",
    y_title="Vertical Position  y(t)",
    show_legend=True,
    legend_at_bottom=True,
    legend_at_bottom_columns=2,
    legend_box_size=24,
    stroke=True,
    show_dots=False,
    show_x_guides=True,
    show_y_guides=True,
    x_value_formatter=lambda v: f"{v:.1f}",
    value_formatter=lambda v: f"{v:.1f}",
    js=[],
    xrange=(-1.2, 1.2),
    range=(-1.2, 1.2),
    print_values=False,
    min_scale=3,
    margin_bottom=440,
    margin_left=80,
    margin_right=60,
    margin_top=60,
    truncate_legend=-1,
)

# Segment labels — quarter-period intervals show traversal direction via colour
liss_labels = ["Lissajous  0 to pi/2", "Lissajous  pi/2 to pi", "Lissajous  pi to 3pi/2", "Lissajous  3pi/2 to 2pi"]
spiral_labels = ["Spiral  0 to pi/2", "Spiral  pi/2 to pi", "Spiral  pi to 3pi/2", "Spiral  3pi/2 to 2pi"]

# Lissajous (3,2) — solid lines; colour gradient encodes traversal direction
for k in range(n_segs):
    start = k * seg_size
    end = min((k + 1) * seg_size + 1, n_points)
    seg_data = [{"value": (float(liss_x[i]), float(liss_y[i]))} for i in range(start, end)]
    chart.add(
        liss_labels[k], seg_data, stroke_style={"width": 10, "linecap": "round", "linejoin": "round"}, show_dots=False
    )

# Archimedean spiral — dashed lines provide non-colour family disambiguation
# Colour gradient encodes outward growth from origin (red) to radius 1 (lime)
for k in range(n_segs):
    start = k * seg_size
    end = min((k + 1) * seg_size + 1, n_points)
    seg_data = [{"value": (float(spiral_x[i]), float(spiral_y[i]))} for i in range(start, end)]
    chart.add(
        spiral_labels[k],
        seg_data,
        stroke_style={"width": 10, "dasharray": "16, 8", "linecap": "round", "linejoin": "round"},
        show_dots=False,
    )

# Traversal markers — explicit start/end dots for both curves
# Both curves originate at the origin; Lissajous closes at (0,0), spiral ends at (1, 0)
chart.add("● Start  t = 0  (both curves)", [{"value": (0.0, 0.0)}], show_dots=True)
chart.add("◆ Spiral end  t = 2pi", [{"value": (float(spiral_x[-1]), float(spiral_y[-1]))}], show_dots=True)

# Save — PNG + interactive HTML, both theme-suffixed
chart.render_to_png(f"plot-{THEME}.png")
with open(f"plot-{THEME}.html", "wb") as f:
    f.write(chart.render())
Runnable source as JSON, for any HTTP client: https://api.anyplot.ai/specs/line-parametric/pygal/code. Any spec id and library id listed in llms-full.txt fit the same URL shape; every URL below is complete and callable.
{
  "spec_id": "line-parametric",
  "language": "python",
  "library": "pygal",
  "page": "https://anyplot.ai/line-parametric/python/pygal",
  "hub": "https://anyplot.ai/line-parametric",
  "code_json": "https://api.anyplot.ai/specs/line-parametric/pygal/code",
  "spec_json": "https://api.anyplot.ai/specs/line-parametric",
  "render_light_png": "https://storage.googleapis.com/anyplot-images/plots/line-parametric/python/pygal/plot-light.png",
  "render_dark_png": "https://storage.googleapis.com/anyplot-images/plots/line-parametric/python/pygal/plot-dark.png",
  "interactive_light_html": "https://storage.googleapis.com/anyplot-images/plots/line-parametric/python/pygal/plot-light.html",
  "interactive_dark_html": "https://storage.googleapis.com/anyplot-images/plots/line-parametric/python/pygal/plot-dark.html",
  "quality_score": 82.0,
  "license": "MIT",
  "guide": "https://anyplot.ai/llms.txt"
}
Part of Parametric Curve Plot on anyplot.ai.