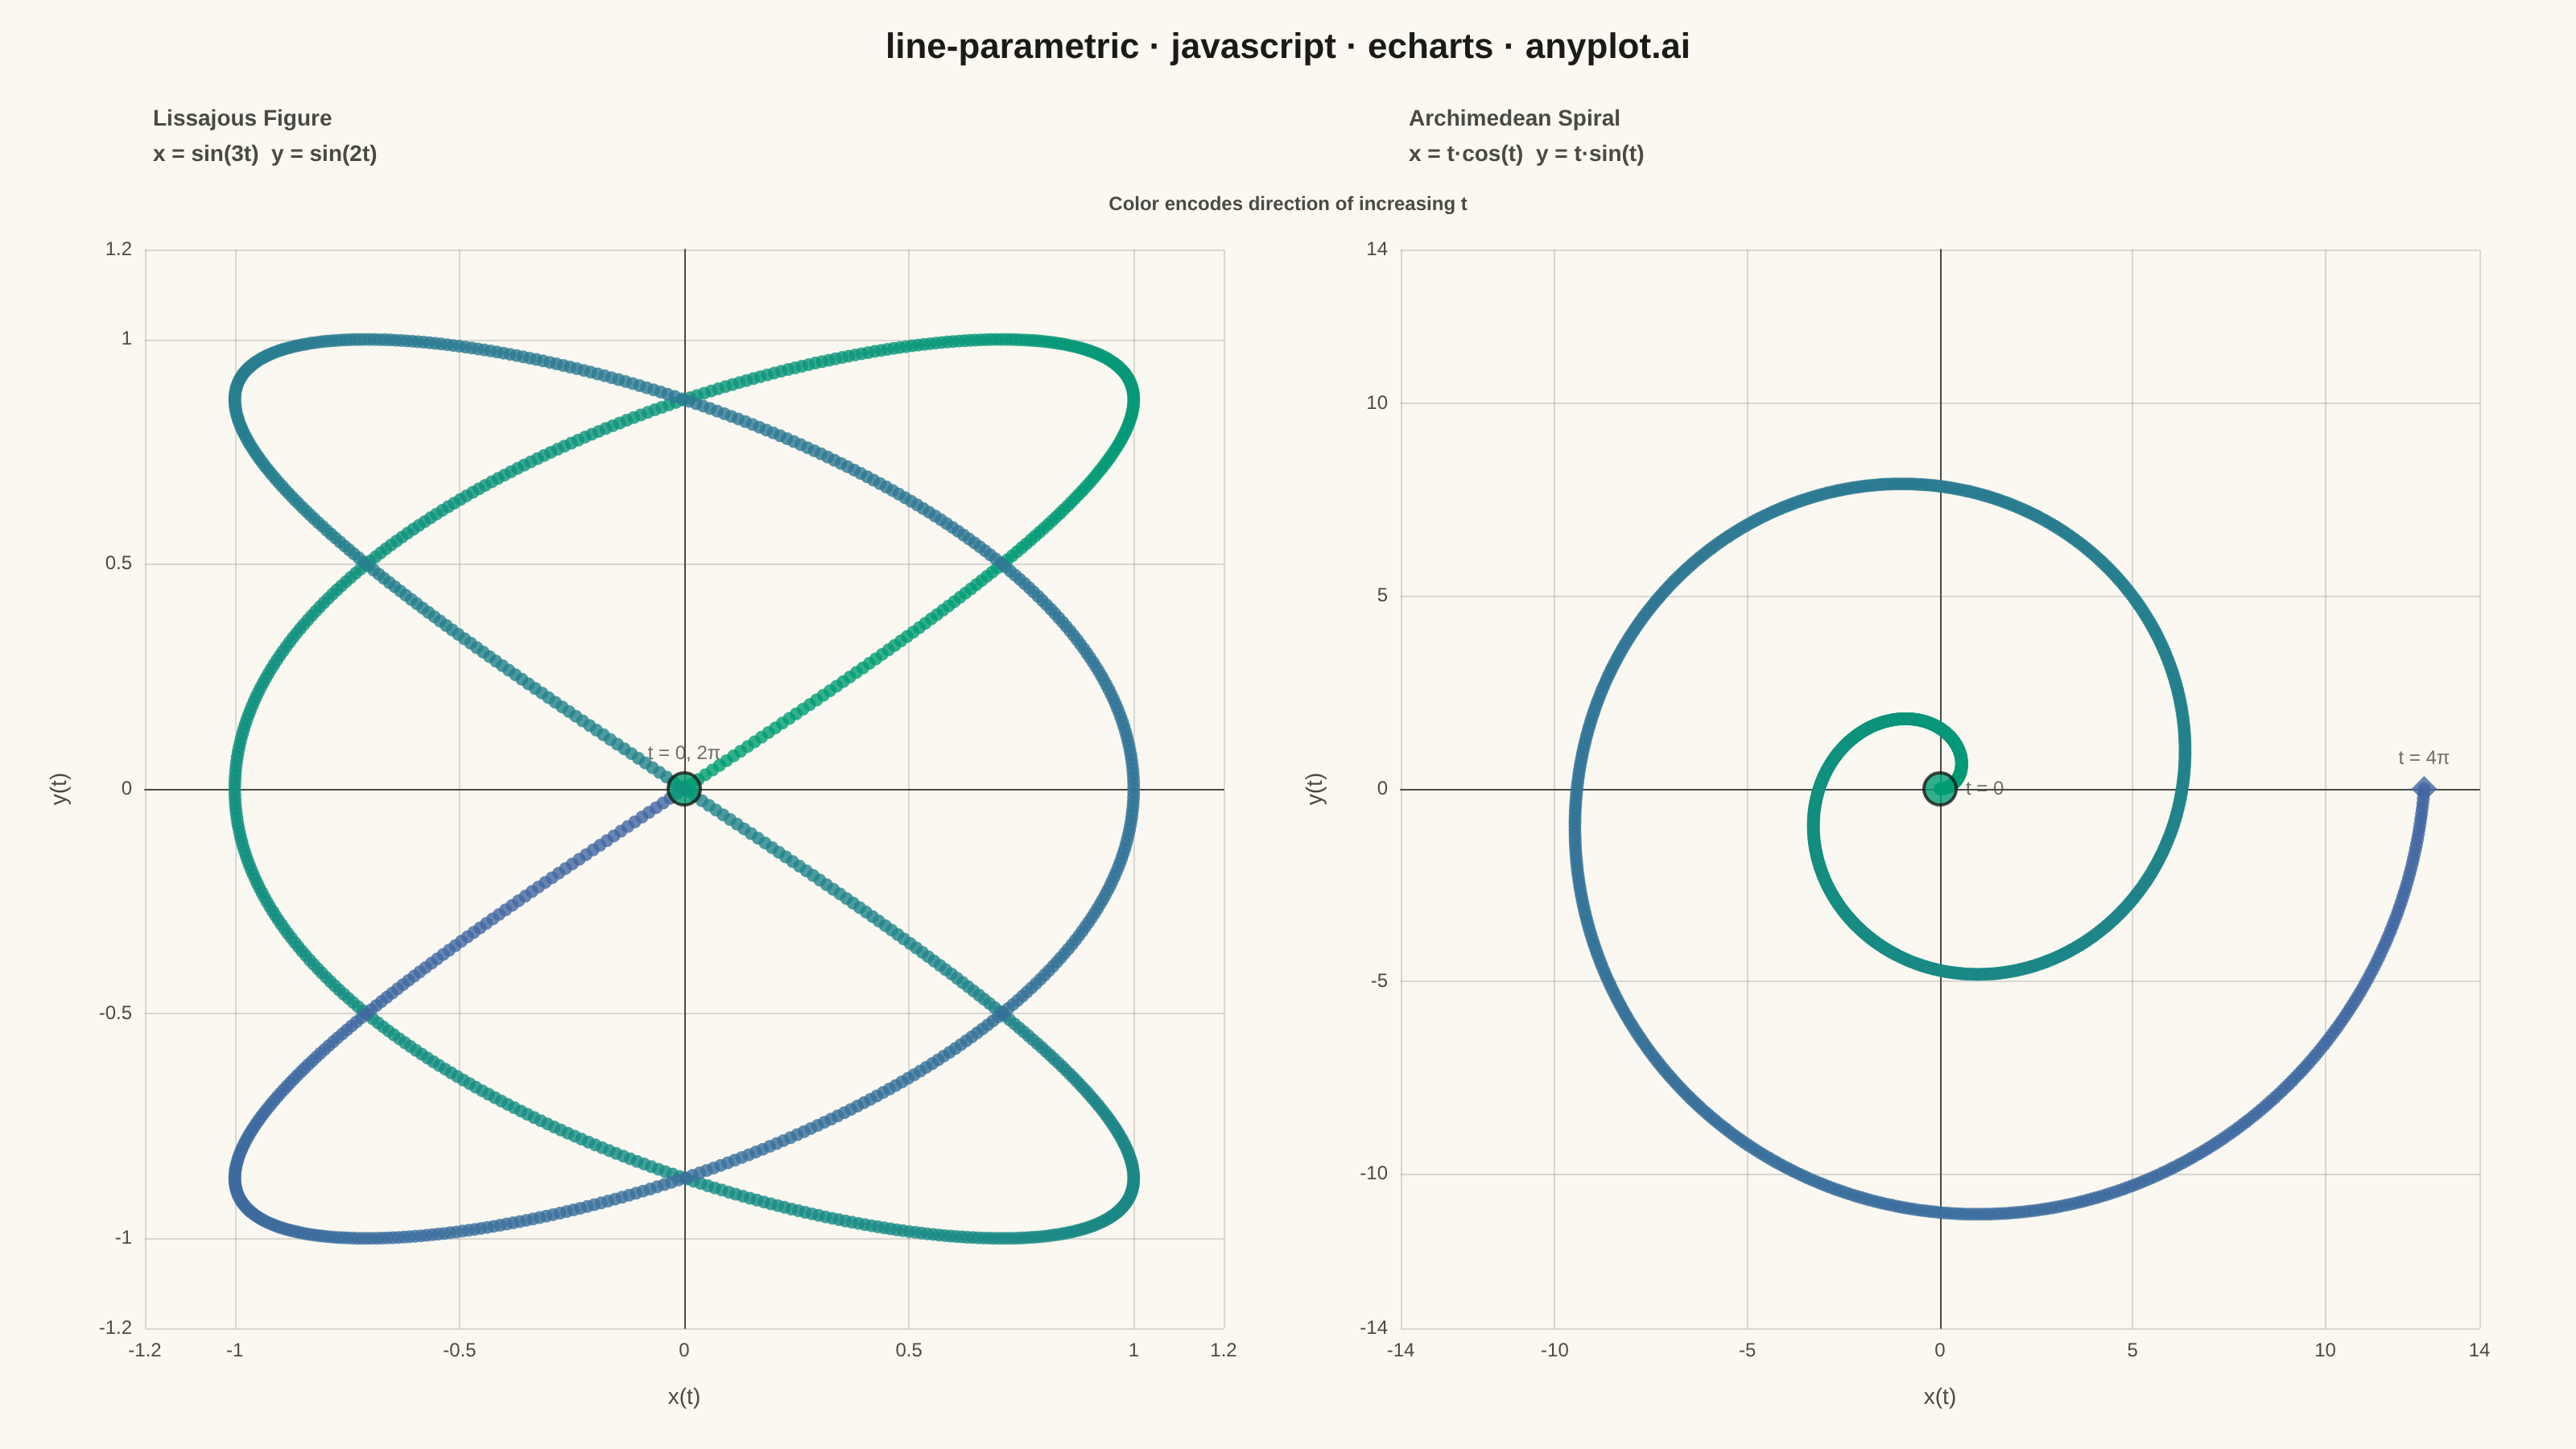
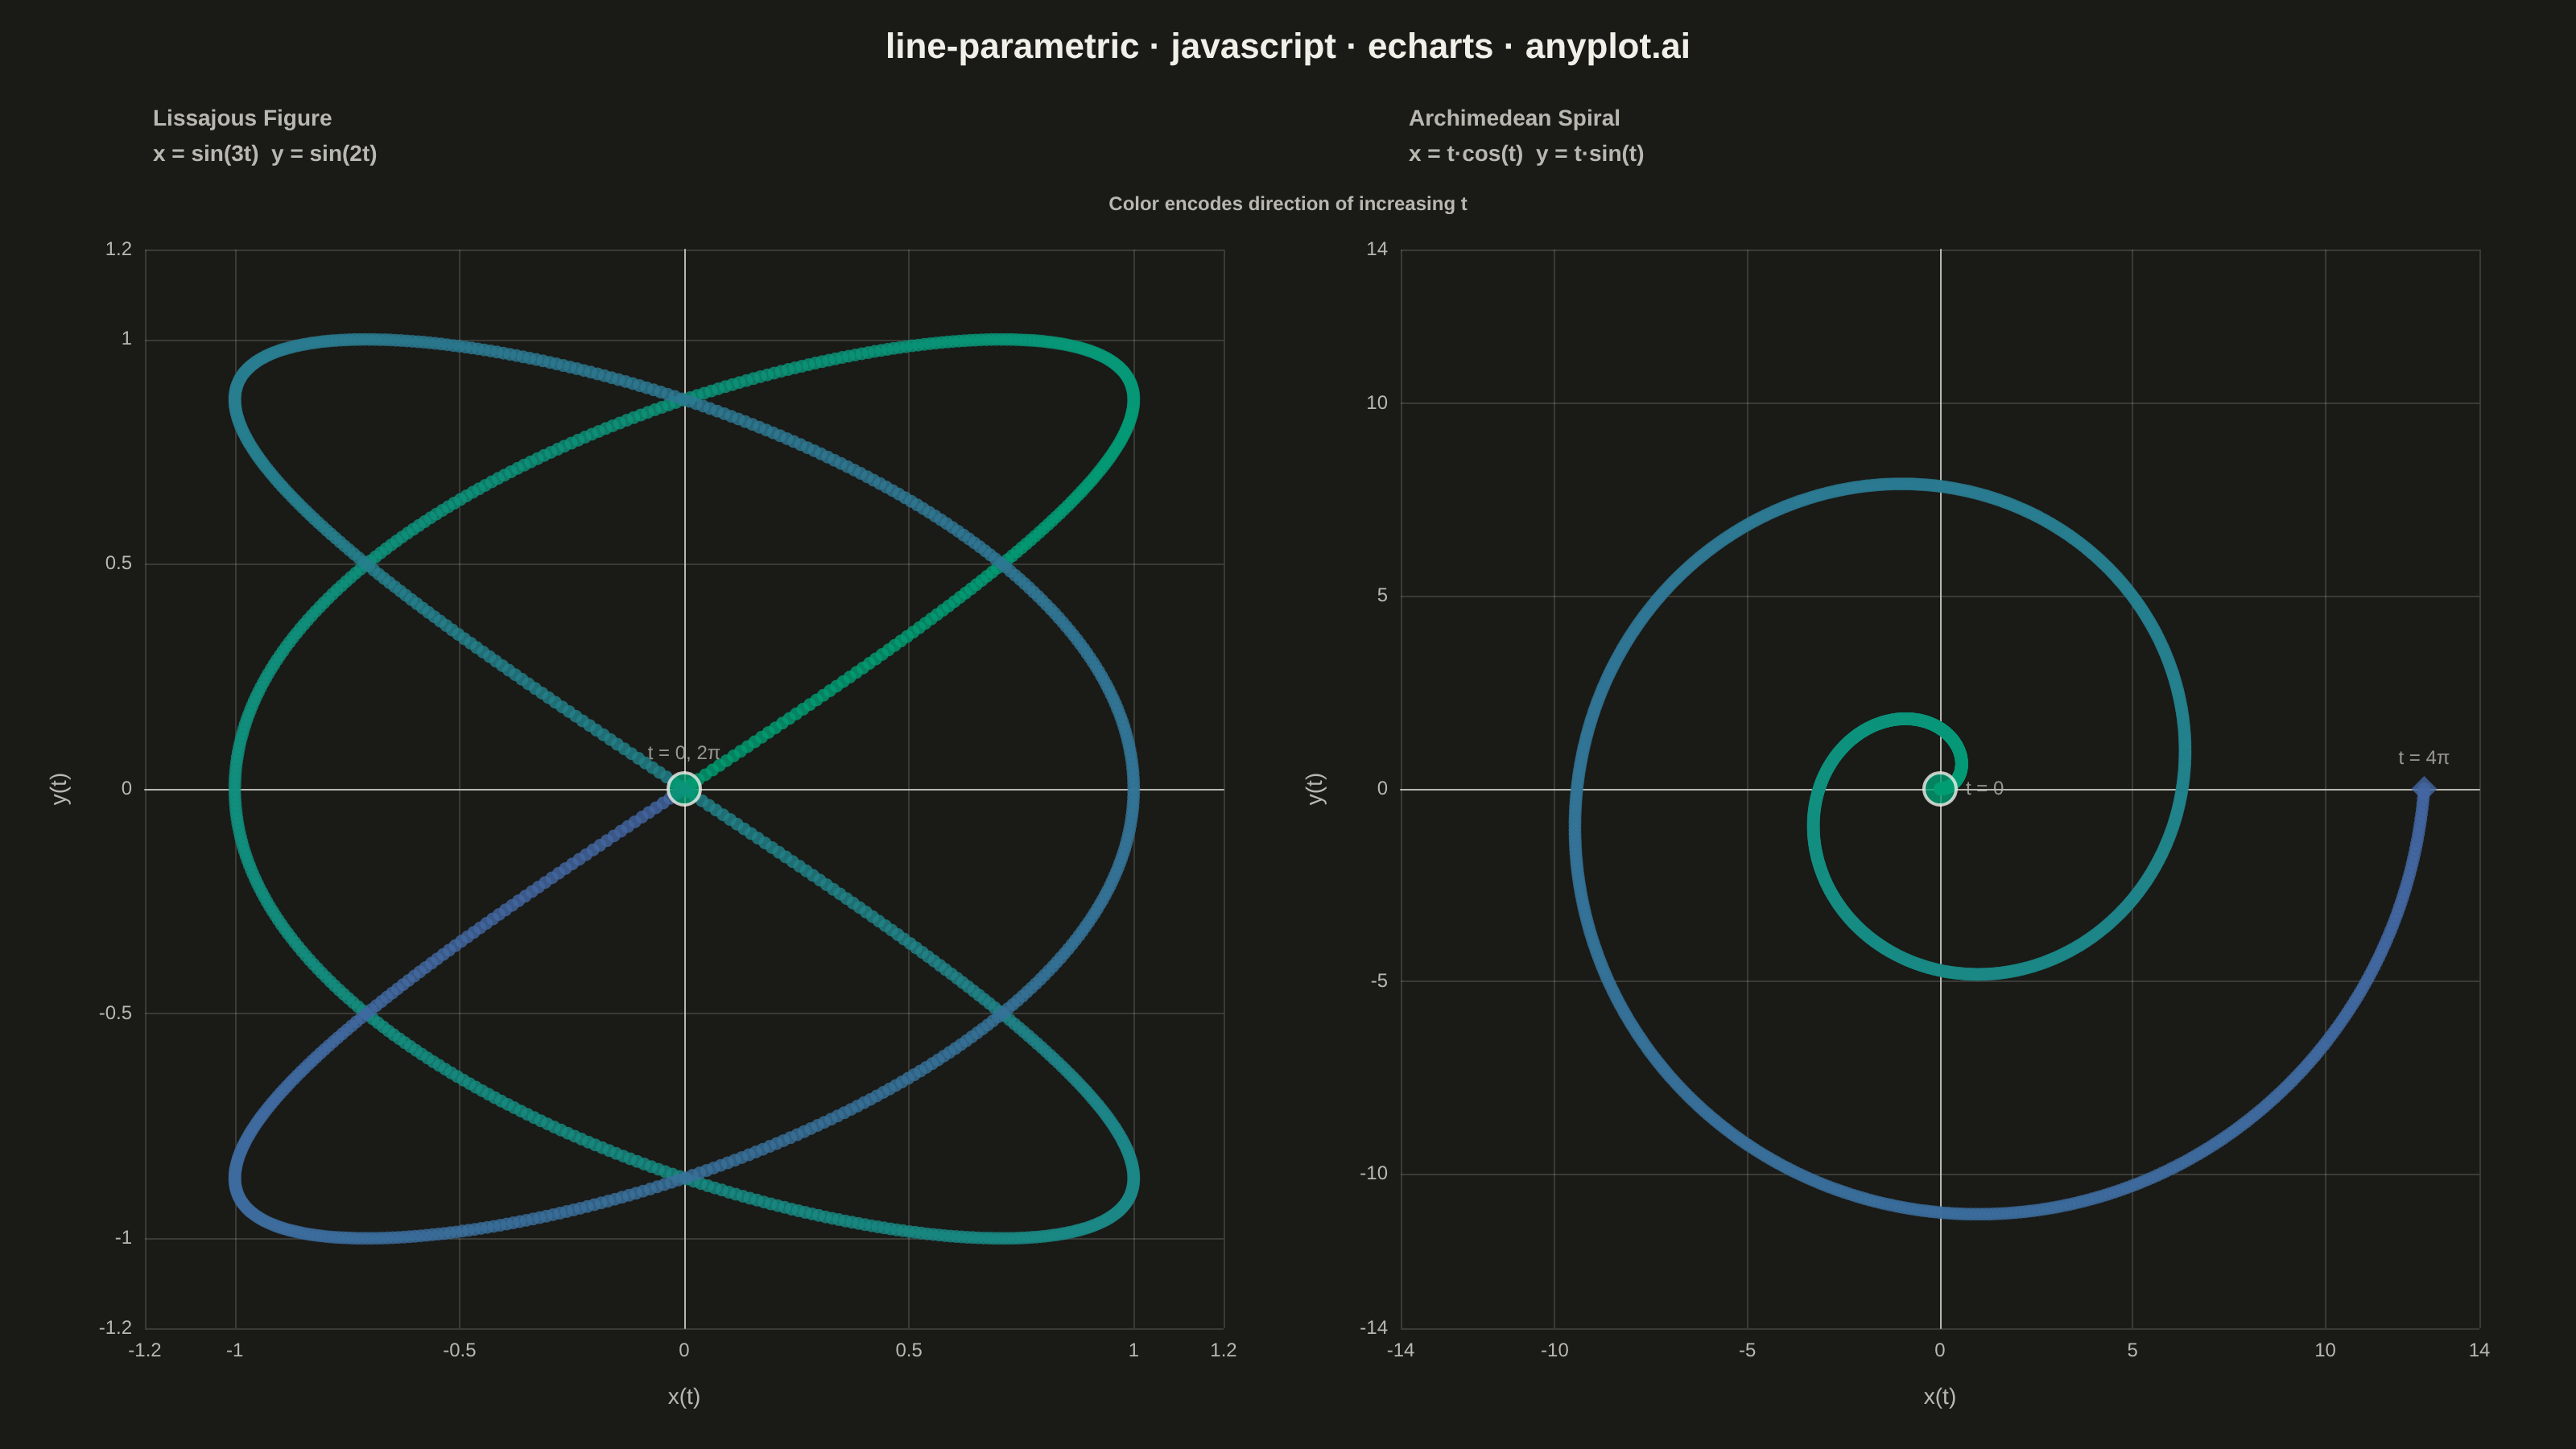
The same plot in 14 other libraries — JavaScript: Chart.js, D3.js, Highcharts, MUI X Charts; Python: Altair, Bokeh, lets-plot, Matplotlib, Plotly, plotnine, Pygal, Seaborn; R: ggplot2; Julia: Makie.jl. Compare all 15 side by side: Parametric Curve Plot in Python, R, Julia and JavaScript.
A parametric curve plot visualizes x(t) and y(t) as functions of a parameter t, tracing smooth curves in 2D space. Unlike standard function plots where y = f(x), parametric curves can loop, self-intersect, and form closed shapes such as Lissajous figures, spirals, and cardioids. This makes them essential for representing trajectories, oscillations, and classical mathematical curves that cannot be expressed as single-valued functions.
// anyplot.ai
// line-parametric: Parametric Curve Plot
// Library: echarts 5.5.1 | JavaScript 22.22.3
// Quality: 89/100 | Created: 2026-06-20

const t = window.ANYPLOT_TOKENS;

// --- Data -------------------------------------------------------------------

// Lissajous figure: x = sin(3t), y = sin(2t), t ∈ [0, 2π]
// 3rd element: normalized t (0→1) drives visualMap color (t.seq gradient)
const N_LISS = 1200;
const lissPoints = Array.from({ length: N_LISS }, (_, i) => {
  const tn = i / (N_LISS - 1);
  const ti = tn * 2 * Math.PI;
  return [Math.sin(3 * ti), Math.sin(2 * ti), tn];
});

// Archimedean spiral: x = t·cos(t), y = t·sin(t), t ∈ [0, 4π]
const N_SPIRAL = 1200;
const spiralPoints = Array.from({ length: N_SPIRAL }, (_, i) => {
  const tn = i / (N_SPIRAL - 1);
  const ti = tn * 4 * Math.PI;
  return [ti * Math.cos(ti), ti * Math.sin(ti), tn];
});

// --- Chart ------------------------------------------------------------------
const chart = echarts.init(document.getElementById('container'));

chart.setOption({
  animation: false,
  color: t.palette,
  backgroundColor: 'transparent',

  title: [
    {
      text: 'line-parametric · javascript · echarts · anyplot.ai',
      left: 'center',
      top: 14,
      textStyle: { color: t.ink, fontSize: 22, fontWeight: 'bold' }
    },
    {
      text: 'Lissajous Figure\nx = sin(3t)  y = sin(2t)',
      left: 90,
      top: 58,
      textStyle: { color: t.inkSoft, fontSize: 14, lineHeight: 22 }
    },
    {
      text: 'Archimedean Spiral\nx = t·cos(t)  y = t·sin(t)',
      left: 870,
      top: 58,
      textStyle: { color: t.inkSoft, fontSize: 14, lineHeight: 22 }
    },
    {
      text: 'Color encodes direction of increasing t',
      left: 'center',
      top: 116,
      textStyle: { color: t.inkSoft, fontSize: 12 }
    }
  ],

  // Two square 670×670 CSS-px plot areas side by side on a 1600×900 mount
  // top 155 + bottom 75 = 230 → height = 900 − 230 = 670 ✓
  grid: [
    { left: 90,  right: 840, top: 155, bottom: 75 },
    { left: 870, right: 60,  top: 155, bottom: 75 }
  ],

  xAxis: [
    {
      gridIndex: 0,
      type: 'value',
      name: 'x(t)',
      nameLocation: 'center',
      nameGap: 36,
      nameTextStyle: { color: t.inkSoft, fontSize: 14 },
      min: -1.2, max: 1.2,
      axisLabel: { color: t.inkSoft, fontSize: 12 },
      axisLine: { show: true, lineStyle: { color: t.inkSoft } },
      axisTick: { show: false },
      splitLine: { lineStyle: { color: t.grid } }
    },
    {
      gridIndex: 1,
      type: 'value',
      name: 'x(t)',
      nameLocation: 'center',
      nameGap: 36,
      nameTextStyle: { color: t.inkSoft, fontSize: 14 },
      min: -14, max: 14,
      axisLabel: { color: t.inkSoft, fontSize: 12 },
      axisLine: { show: true, lineStyle: { color: t.inkSoft } },
      axisTick: { show: false },
      splitLine: { lineStyle: { color: t.grid } }
    }
  ],

  yAxis: [
    {
      gridIndex: 0,
      type: 'value',
      name: 'y(t)',
      nameLocation: 'center',
      nameGap: 46,
      nameTextStyle: { color: t.inkSoft, fontSize: 14 },
      min: -1.2, max: 1.2,
      axisLabel: { color: t.inkSoft, fontSize: 12 },
      axisLine: { show: true, lineStyle: { color: t.inkSoft } },
      axisTick: { show: false },
      splitLine: { lineStyle: { color: t.grid } }
    },
    {
      gridIndex: 1,
      type: 'value',
      name: 'y(t)',
      nameLocation: 'center',
      nameGap: 46,
      nameTextStyle: { color: t.inkSoft, fontSize: 14 },
      min: -14, max: 14,
      axisLabel: { color: t.inkSoft, fontSize: 12 },
      axisLine: { show: true, lineStyle: { color: t.inkSoft } },
      axisTick: { show: false },
      splitLine: { lineStyle: { color: t.grid } }
    }
  ],

  // Per-point color via Imprint sequential colormap (t.seq: green→blue)
  // Scatter series supports per-point color mapping through visualMap dimension
  visualMap: [
    {
      type: 'continuous',
      seriesIndex: 0,
      dimension: 2,
      min: 0, max: 1,
      inRange: { color: t.seq },
      show: false
    },
    {
      type: 'continuous',
      seriesIndex: 2,
      dimension: 2,
      min: 0, max: 1,
      inRange: { color: t.seq },
      show: false
    }
  ],

  series: [
    // Lissajous curve — scatter with symbolSize 8 for dense, gap-free appearance
    {
      type: 'scatter',
      xAxisIndex: 0,
      yAxisIndex: 0,
      data: lissPoints,
      symbolSize: 8,
      encode: { x: 0, y: 1 },
      z: 2
    },
    // Lissajous origin marker — closed curve: t=0 and t=2π meet at (0,0)
    {
      type: 'scatter',
      xAxisIndex: 0,
      yAxisIndex: 0,
      data: [[0, 0]],
      symbolSize: 20,
      itemStyle: { color: t.seq[0], borderColor: t.ink, borderWidth: 2 },
      label: {
        show: true,
        formatter: 't = 0, 2π',
        position: 'top',
        color: t.inkSoft,
        fontSize: 12
      },
      z: 4
    },

    // Archimedean spiral — scatter with t-based gradient via visualMap
    {
      type: 'scatter',
      xAxisIndex: 1,
      yAxisIndex: 1,
      data: spiralPoints,
      symbolSize: 8,
      encode: { x: 0, y: 1 },
      z: 2
    },
    // Spiral start marker at origin
    {
      type: 'scatter',
      xAxisIndex: 1,
      yAxisIndex: 1,
      data: [[0, 0]],
      symbolSize: 20,
      itemStyle: { color: t.seq[0], borderColor: t.ink, borderWidth: 2 },
      label: {
        show: true,
        formatter: 't = 0',
        position: 'right',
        color: t.inkSoft,
        fontSize: 12
      },
      z: 4
    },
    // Spiral end marker at t = 4π
    {
      type: 'scatter',
      xAxisIndex: 1,
      yAxisIndex: 1,
      data: [[spiralPoints[N_SPIRAL - 1][0], spiralPoints[N_SPIRAL - 1][1]]],
      symbolSize: 16,
      symbol: 'diamond',
      itemStyle: { color: t.seq[1] },
      label: {
        show: true,
        formatter: 't = 4π',
        position: 'top',
        color: t.inkSoft,
        fontSize: 12
      },
      z: 4
    }
  ]
});
Runnable source as JSON, for any HTTP client: https://api.anyplot.ai/specs/line-parametric/echarts/code. Any spec id and library id listed in llms-full.txt fit the same URL shape; every URL below is complete and callable.
{
  "spec_id": "line-parametric",
  "language": "javascript",
  "library": "echarts",
  "page": "https://anyplot.ai/line-parametric/javascript/echarts",
  "hub": "https://anyplot.ai/line-parametric",
  "code_json": "https://api.anyplot.ai/specs/line-parametric/echarts/code",
  "spec_json": "https://api.anyplot.ai/specs/line-parametric",
  "render_light_png": "https://storage.googleapis.com/anyplot-images/plots/line-parametric/javascript/echarts/plot-light.png",
  "render_dark_png": "https://storage.googleapis.com/anyplot-images/plots/line-parametric/javascript/echarts/plot-dark.png",
  "interactive_light_html": "https://storage.googleapis.com/anyplot-images/plots/line-parametric/javascript/echarts/plot-light.html",
  "interactive_dark_html": "https://storage.googleapis.com/anyplot-images/plots/line-parametric/javascript/echarts/plot-dark.html",
  "quality_score": 89.0,
  "license": "MIT",
  "guide": "https://anyplot.ai/llms.txt"
}
Part of Parametric Curve Plot on anyplot.ai.