The same plot in 14 other libraries — JavaScript: Chart.js, D3.js, Highcharts, MUI X Charts; Python: Altair, Bokeh, lets-plot, Matplotlib, Plotly, plotnine, Pygal, Seaborn; R: ggplot2; Julia: Makie.jl. Compare all 15 side by side: Reaction Coordinate Energy Diagram in Python, R, Julia and JavaScript.
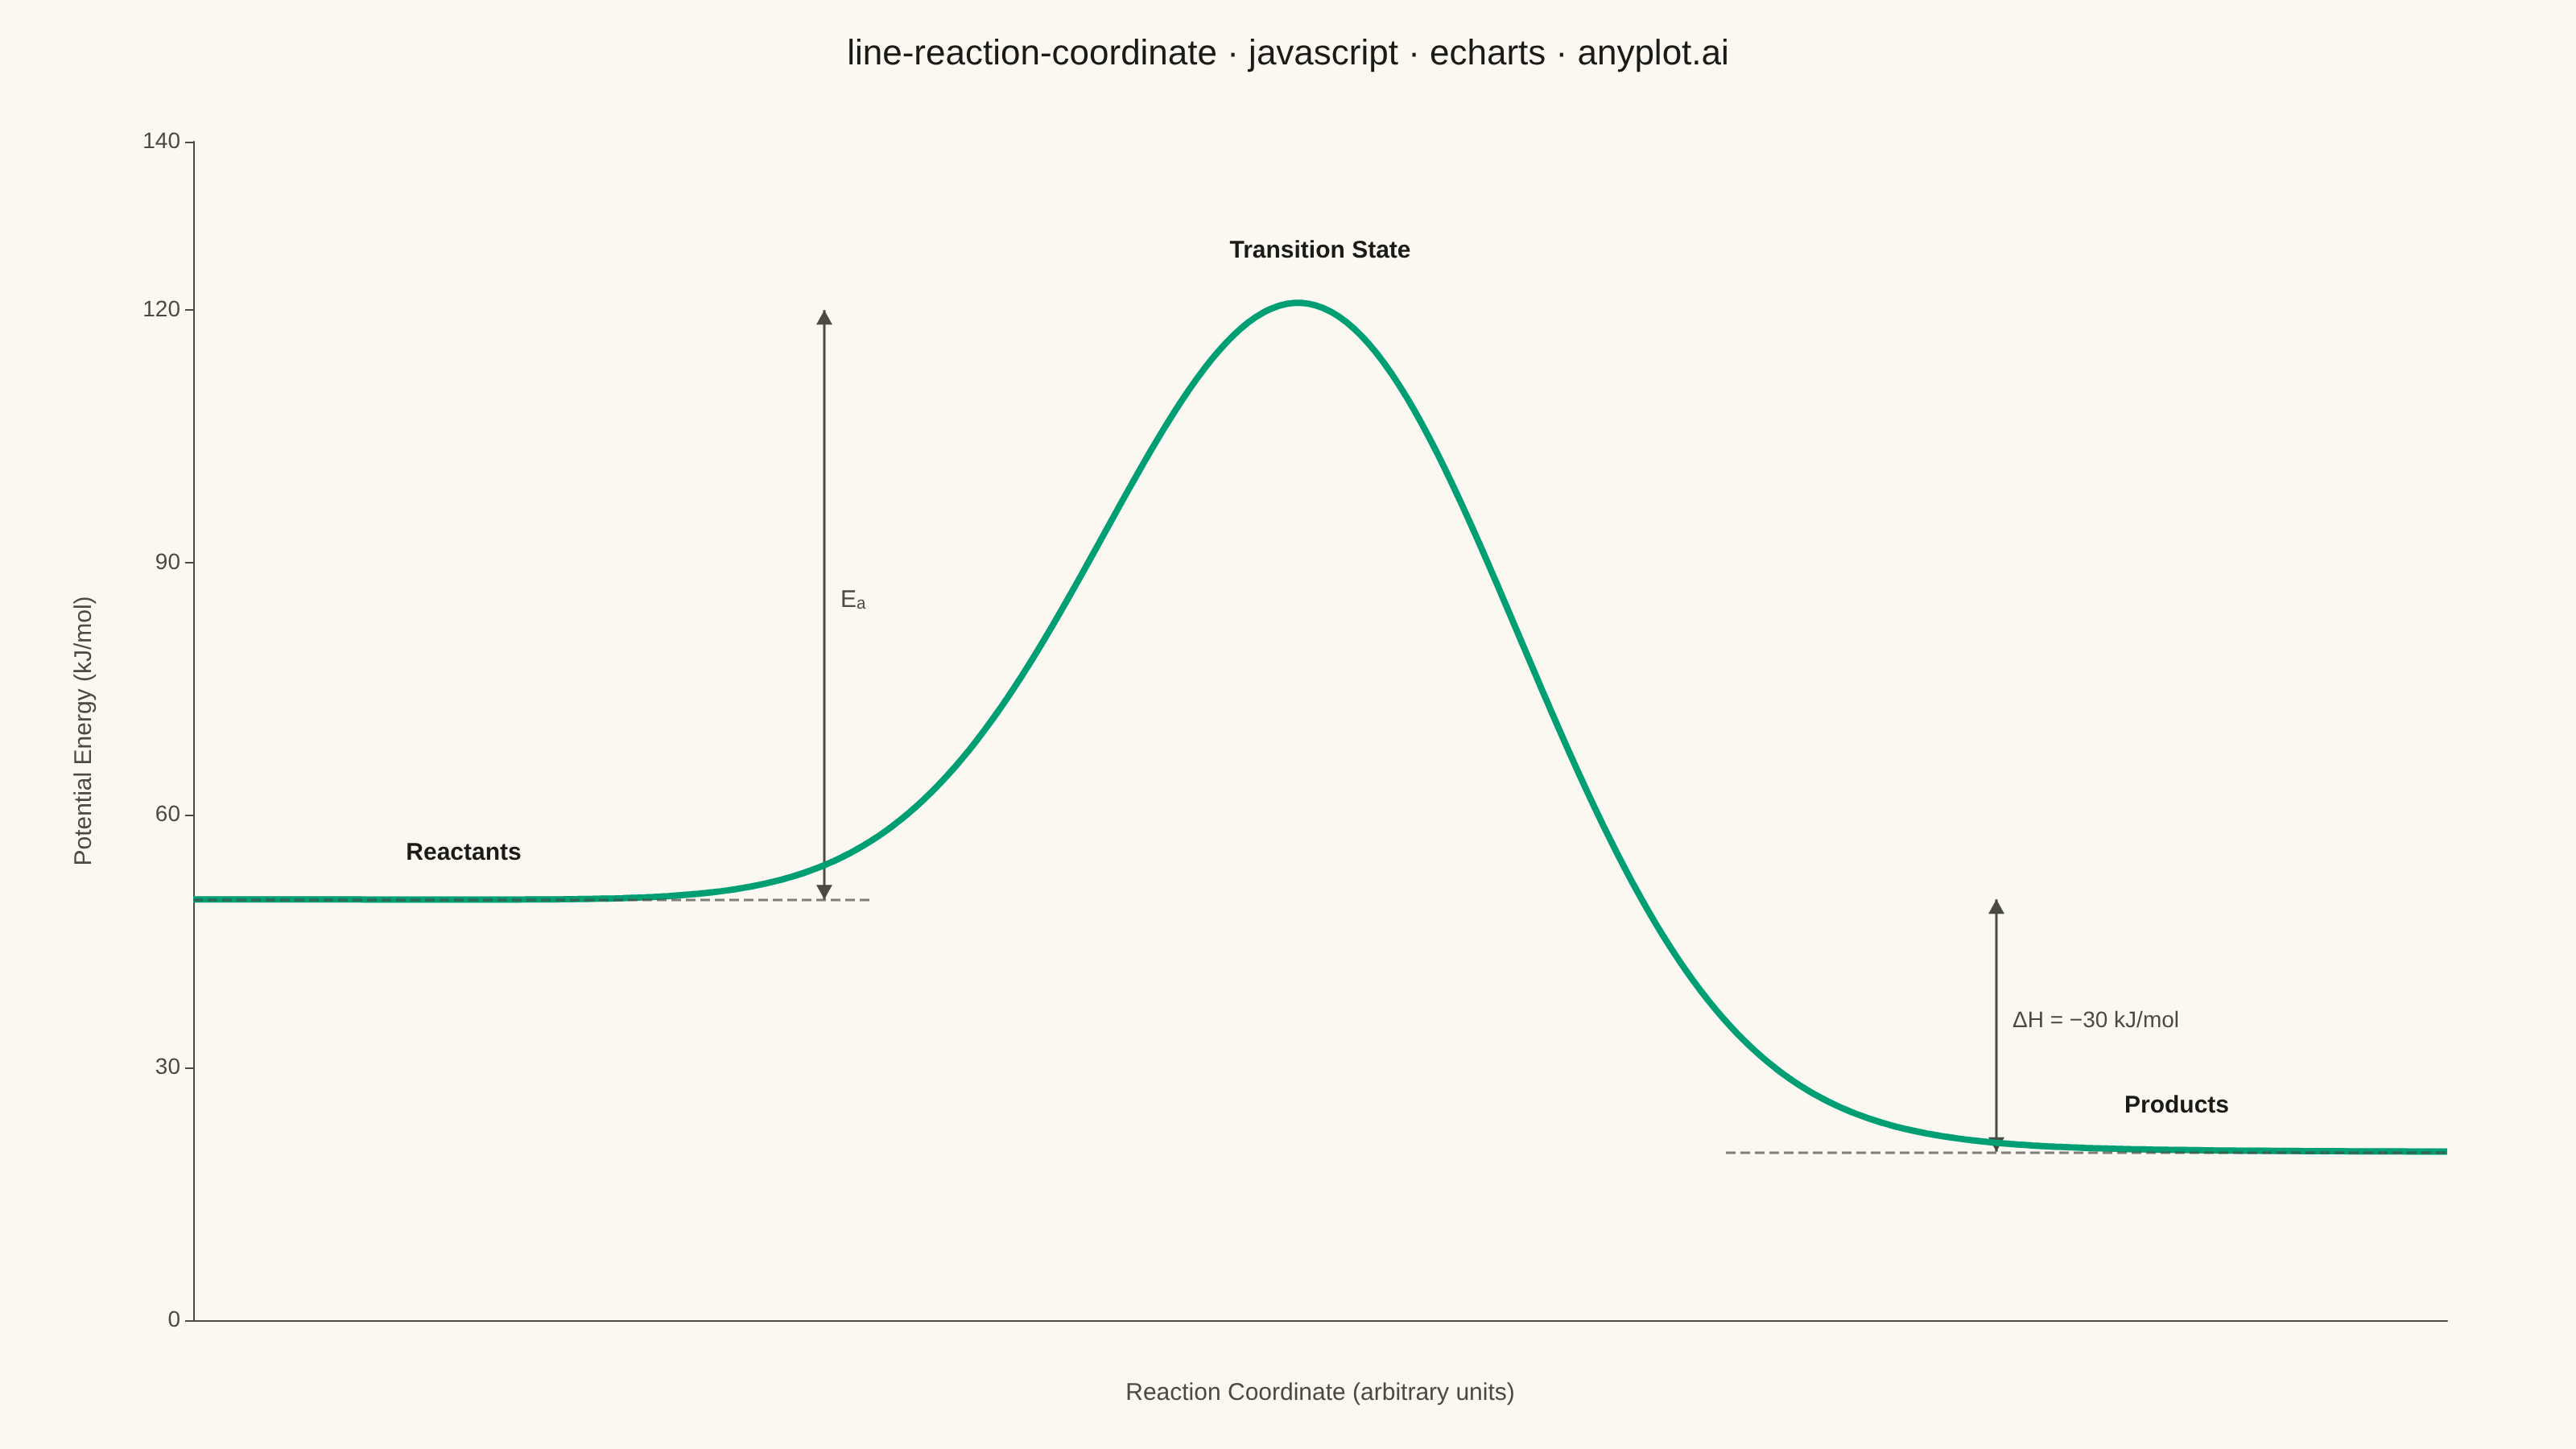
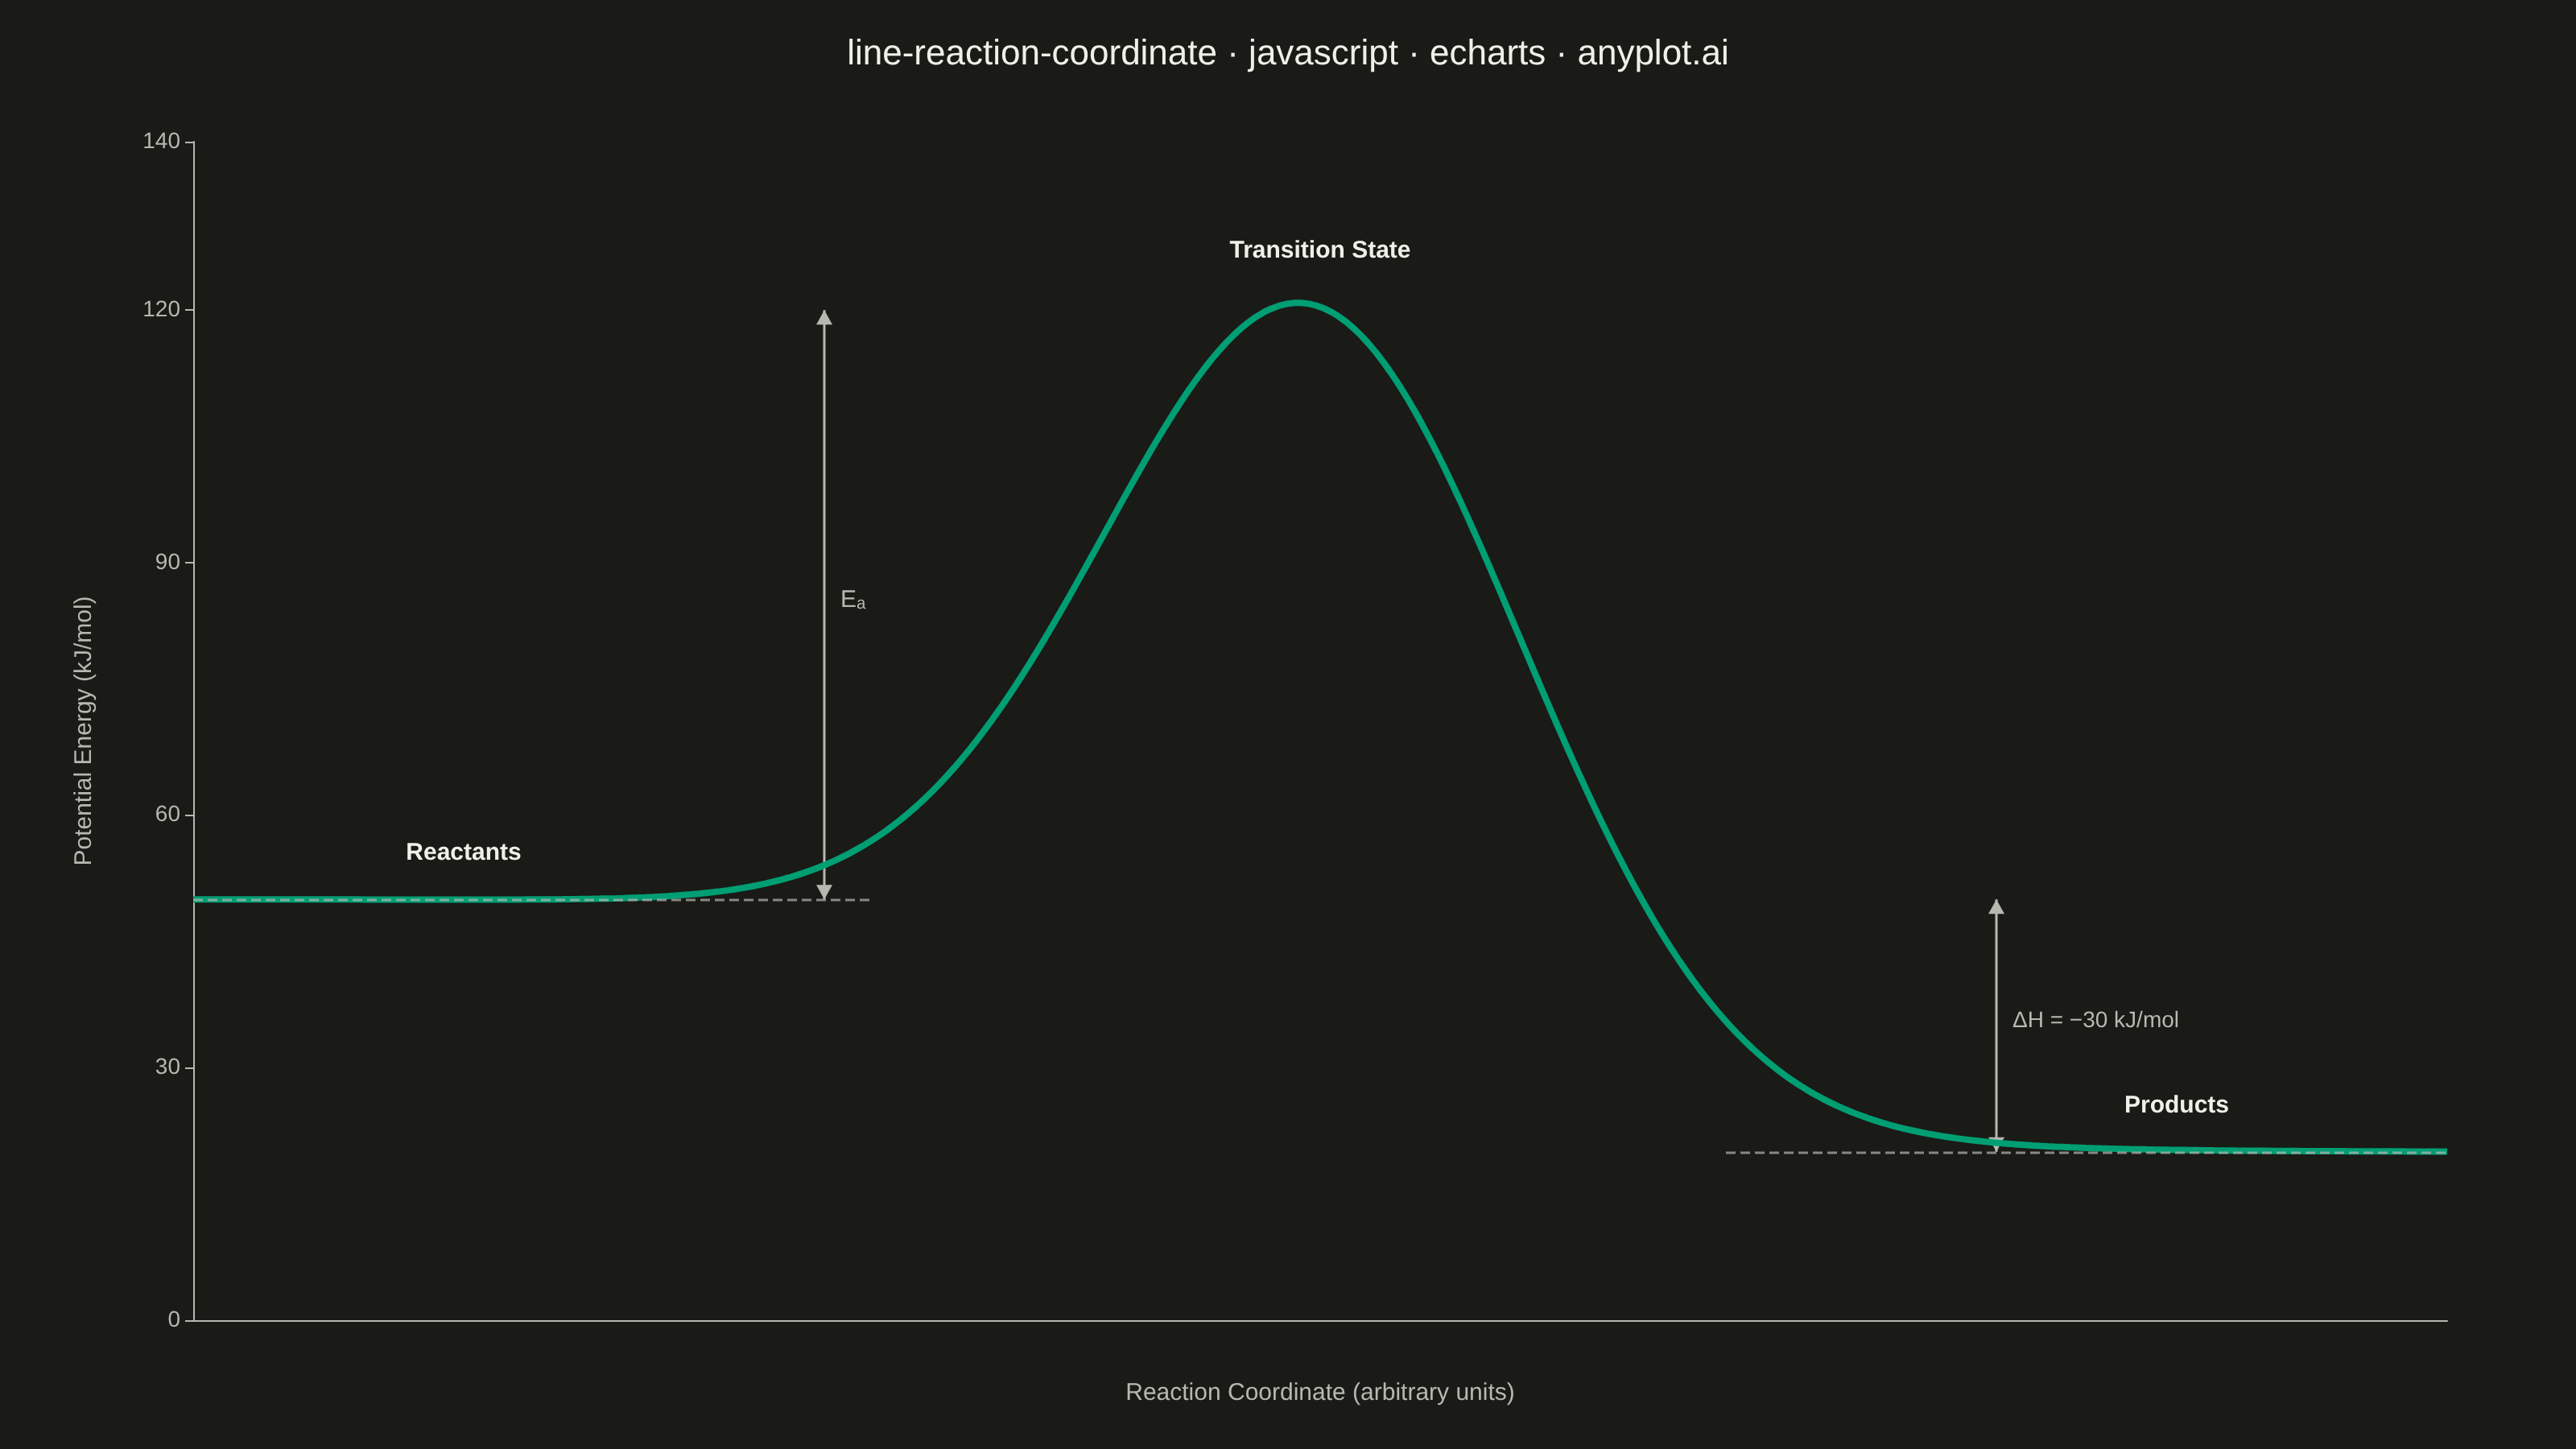
A reaction coordinate diagram plots potential energy against reaction progress, showing the energy landscape of a chemical transformation. The smooth curve traces the path from reactants through the transition state (energy maximum) to products, clearly depicting the activation energy barrier and overall enthalpy change. This fundamental chemistry visualization is essential for understanding reaction kinetics and thermodynamics.
// anyplot.ai
// line-reaction-coordinate: Reaction Coordinate Energy Diagram
// Library: echarts 5.5.1 | JavaScript 22.22.3
// Quality: 92/100 | Created: 2026-06-24

const t = window.ANYPLOT_TOKENS;

// Data: single-step exothermic reaction
// Reactants 50 kJ/mol → Transition State ~120 kJ/mol → Products 20 kJ/mol
const N = 300;
const curveData = [];
for (let i = 0; i < N; i++) {
  const x = i / (N - 1);
  const sig = 1 / (1 + Math.exp(-15 * (x - 0.55)));
  const baseline = 50 * (1 - sig) + 20 * sig;
  const bump = 80 * Math.exp(-((x - 0.5) / 0.13) * ((x - 0.5) / 0.13));
  curveData.push([x, baseline + bump]);
}

const chart = echarts.init(document.getElementById("container"));

chart.setOption({
  animation: false,
  color: t.palette,
  backgroundColor: "transparent",
  title: {
    text: "line-reaction-coordinate · javascript · echarts · anyplot.ai",
    left: "center",
    top: 18,
    textStyle: { color: t.ink, fontSize: 22, fontWeight: "500" },
  },
  grid: { left: 120, right: 80, top: 88, bottom: 80 },
  xAxis: {
    type: "value",
    name: "Reaction Coordinate (arbitrary units)",
    nameLocation: "middle",
    nameGap: 38,
    nameTextStyle: { color: t.inkSoft, fontSize: 15 },
    min: 0,
    max: 1,
    axisLabel: { show: false },
    axisTick: { show: false },
    axisLine: { lineStyle: { color: t.inkSoft } },
    splitLine: { show: false },
  },
  yAxis: {
    type: "value",
    name: "Potential Energy (kJ/mol)",
    nameLocation: "middle",
    nameGap: 60,
    nameTextStyle: { color: t.inkSoft, fontSize: 15 },
    min: 0,
    max: 140,
    axisLabel: { color: t.inkSoft, fontSize: 14 },
    axisLine: { lineStyle: { color: t.inkSoft } },
    splitLine: { show: false },
  },
  series: [
    {
      type: "line",
      data: curveData,
      smooth: false,
      symbol: "none",
      lineStyle: { color: t.palette[0], width: 4 },
      markLine: {
        silent: true,
        symbol: ["none", "none"],
        label: { show: false },
        data: [
          [
            { coord: [0.0, 50], lineStyle: { type: "dashed", color: t.inkSoft, width: 1.5, opacity: 0.7 } },
            { coord: [0.30, 50] },
          ],
          [
            { coord: [0.68, 20], lineStyle: { type: "dashed", color: t.inkSoft, width: 1.5, opacity: 0.7 } },
            { coord: [1.0, 20] },
          ],
        ],
      },
    },
  ],
});

// Pixel positions for annotation elements (CSS px on the 1600×900 mount)
const toP = (xy) => chart.convertToPixel({ gridIndex: 0 }, xy);

const [, yTs]    = toP([0, 120]);
const [, yReact] = toP([0, 50]);
const [, yProd]  = toP([0, 20]);
const [eaX]      = toP([0.28, 0]);
const [dhX]      = toP([0.80, 0]);
const [tsX]      = toP([0.50, 0]);
const [rX]       = toP([0.12, 0]);
const [pX]       = toP([0.88, 0]);

const AH = 9;  // arrowhead height in CSS px

chart.setOption({
  graphic: {
    elements: [
      // --- Species labels ---
      {
        type: "text",
        x: rX,
        y: yReact - 36,
        style: { text: "Reactants", fill: t.ink, fontSize: 15, fontWeight: "bold", align: "center" },
      },
      {
        type: "text",
        x: tsX,
        y: yTs - 44,
        style: { text: "Transition State", fill: t.ink, fontSize: 15, fontWeight: "bold", align: "center" },
      },
      {
        type: "text",
        x: pX,
        y: yProd - 36,
        style: { text: "Products", fill: t.ink, fontSize: 15, fontWeight: "bold", align: "center" },
      },

      // --- Eₐ double-headed arrow (reactant level → TS peak) ---
      {
        type: "line",
        shape: { x1: eaX, y1: yReact, x2: eaX, y2: yTs },
        style: { stroke: t.inkSoft, lineWidth: 1.5 },
      },
      // top arrowhead pointing up (toward TS)
      {
        type: "polygon",
        shape: { points: [[eaX, yTs], [eaX - 5, yTs + AH], [eaX + 5, yTs + AH]] },
        style: { fill: t.inkSoft },
      },
      // bottom arrowhead pointing down (toward reactants)
      {
        type: "polygon",
        shape: { points: [[eaX, yReact], [eaX - 5, yReact - AH], [eaX + 5, yReact - AH]] },
        style: { fill: t.inkSoft },
      },
      {
        type: "text",
        x: eaX + 10,
        y: (yReact + yTs) / 2 - 10,
        style: { text: "Eₐ", fill: t.inkSoft, fontSize: 15 },
      },

      // --- ΔH double-headed arrow (product level → reactant level) ---
      {
        type: "line",
        shape: { x1: dhX, y1: yProd, x2: dhX, y2: yReact },
        style: { stroke: t.inkSoft, lineWidth: 1.5 },
      },
      // top arrowhead pointing up (toward reactant level)
      {
        type: "polygon",
        shape: { points: [[dhX, yReact], [dhX - 5, yReact + AH], [dhX + 5, yReact + AH]] },
        style: { fill: t.inkSoft },
      },
      // bottom arrowhead pointing down (toward product level)
      {
        type: "polygon",
        shape: { points: [[dhX, yProd], [dhX - 5, yProd - AH], [dhX + 5, yProd - AH]] },
        style: { fill: t.inkSoft },
      },
      {
        type: "text",
        x: dhX + 10,
        y: (yProd + yReact) / 2 - 10,
        style: { text: "ΔH = −30 kJ/mol", fill: t.inkSoft, fontSize: 14 },
      },
    ],
  },
});
Runnable source as JSON, for any HTTP client: https://api.anyplot.ai/specs/line-reaction-coordinate/echarts/code. Any spec id and library id listed in llms-full.txt fit the same URL shape; every URL below is complete and callable.
{
  "spec_id": "line-reaction-coordinate",
  "language": "javascript",
  "library": "echarts",
  "page": "https://anyplot.ai/line-reaction-coordinate/javascript/echarts",
  "hub": "https://anyplot.ai/line-reaction-coordinate",
  "code_json": "https://api.anyplot.ai/specs/line-reaction-coordinate/echarts/code",
  "spec_json": "https://api.anyplot.ai/specs/line-reaction-coordinate",
  "render_light_png": "https://storage.googleapis.com/anyplot-images/plots/line-reaction-coordinate/javascript/echarts/plot-light.png",
  "render_dark_png": "https://storage.googleapis.com/anyplot-images/plots/line-reaction-coordinate/javascript/echarts/plot-dark.png",
  "interactive_light_html": "https://storage.googleapis.com/anyplot-images/plots/line-reaction-coordinate/javascript/echarts/plot-light.html",
  "interactive_dark_html": "https://storage.googleapis.com/anyplot-images/plots/line-reaction-coordinate/javascript/echarts/plot-dark.html",
  "quality_score": 92.0,
  "license": "MIT",
  "guide": "https://anyplot.ai/llms.txt"
}
Part of Reaction Coordinate Energy Diagram on anyplot.ai.