The same plot in 14 other libraries — JavaScript: Chart.js, D3.js, Apache ECharts, Highcharts; Python: Altair, Bokeh, lets-plot, Matplotlib, Plotly, plotnine, Pygal, Seaborn; R: ggplot2; Julia: Makie.jl. Compare all 15 side by side: Reaction Coordinate Energy Diagram in Python, R, Julia and JavaScript.
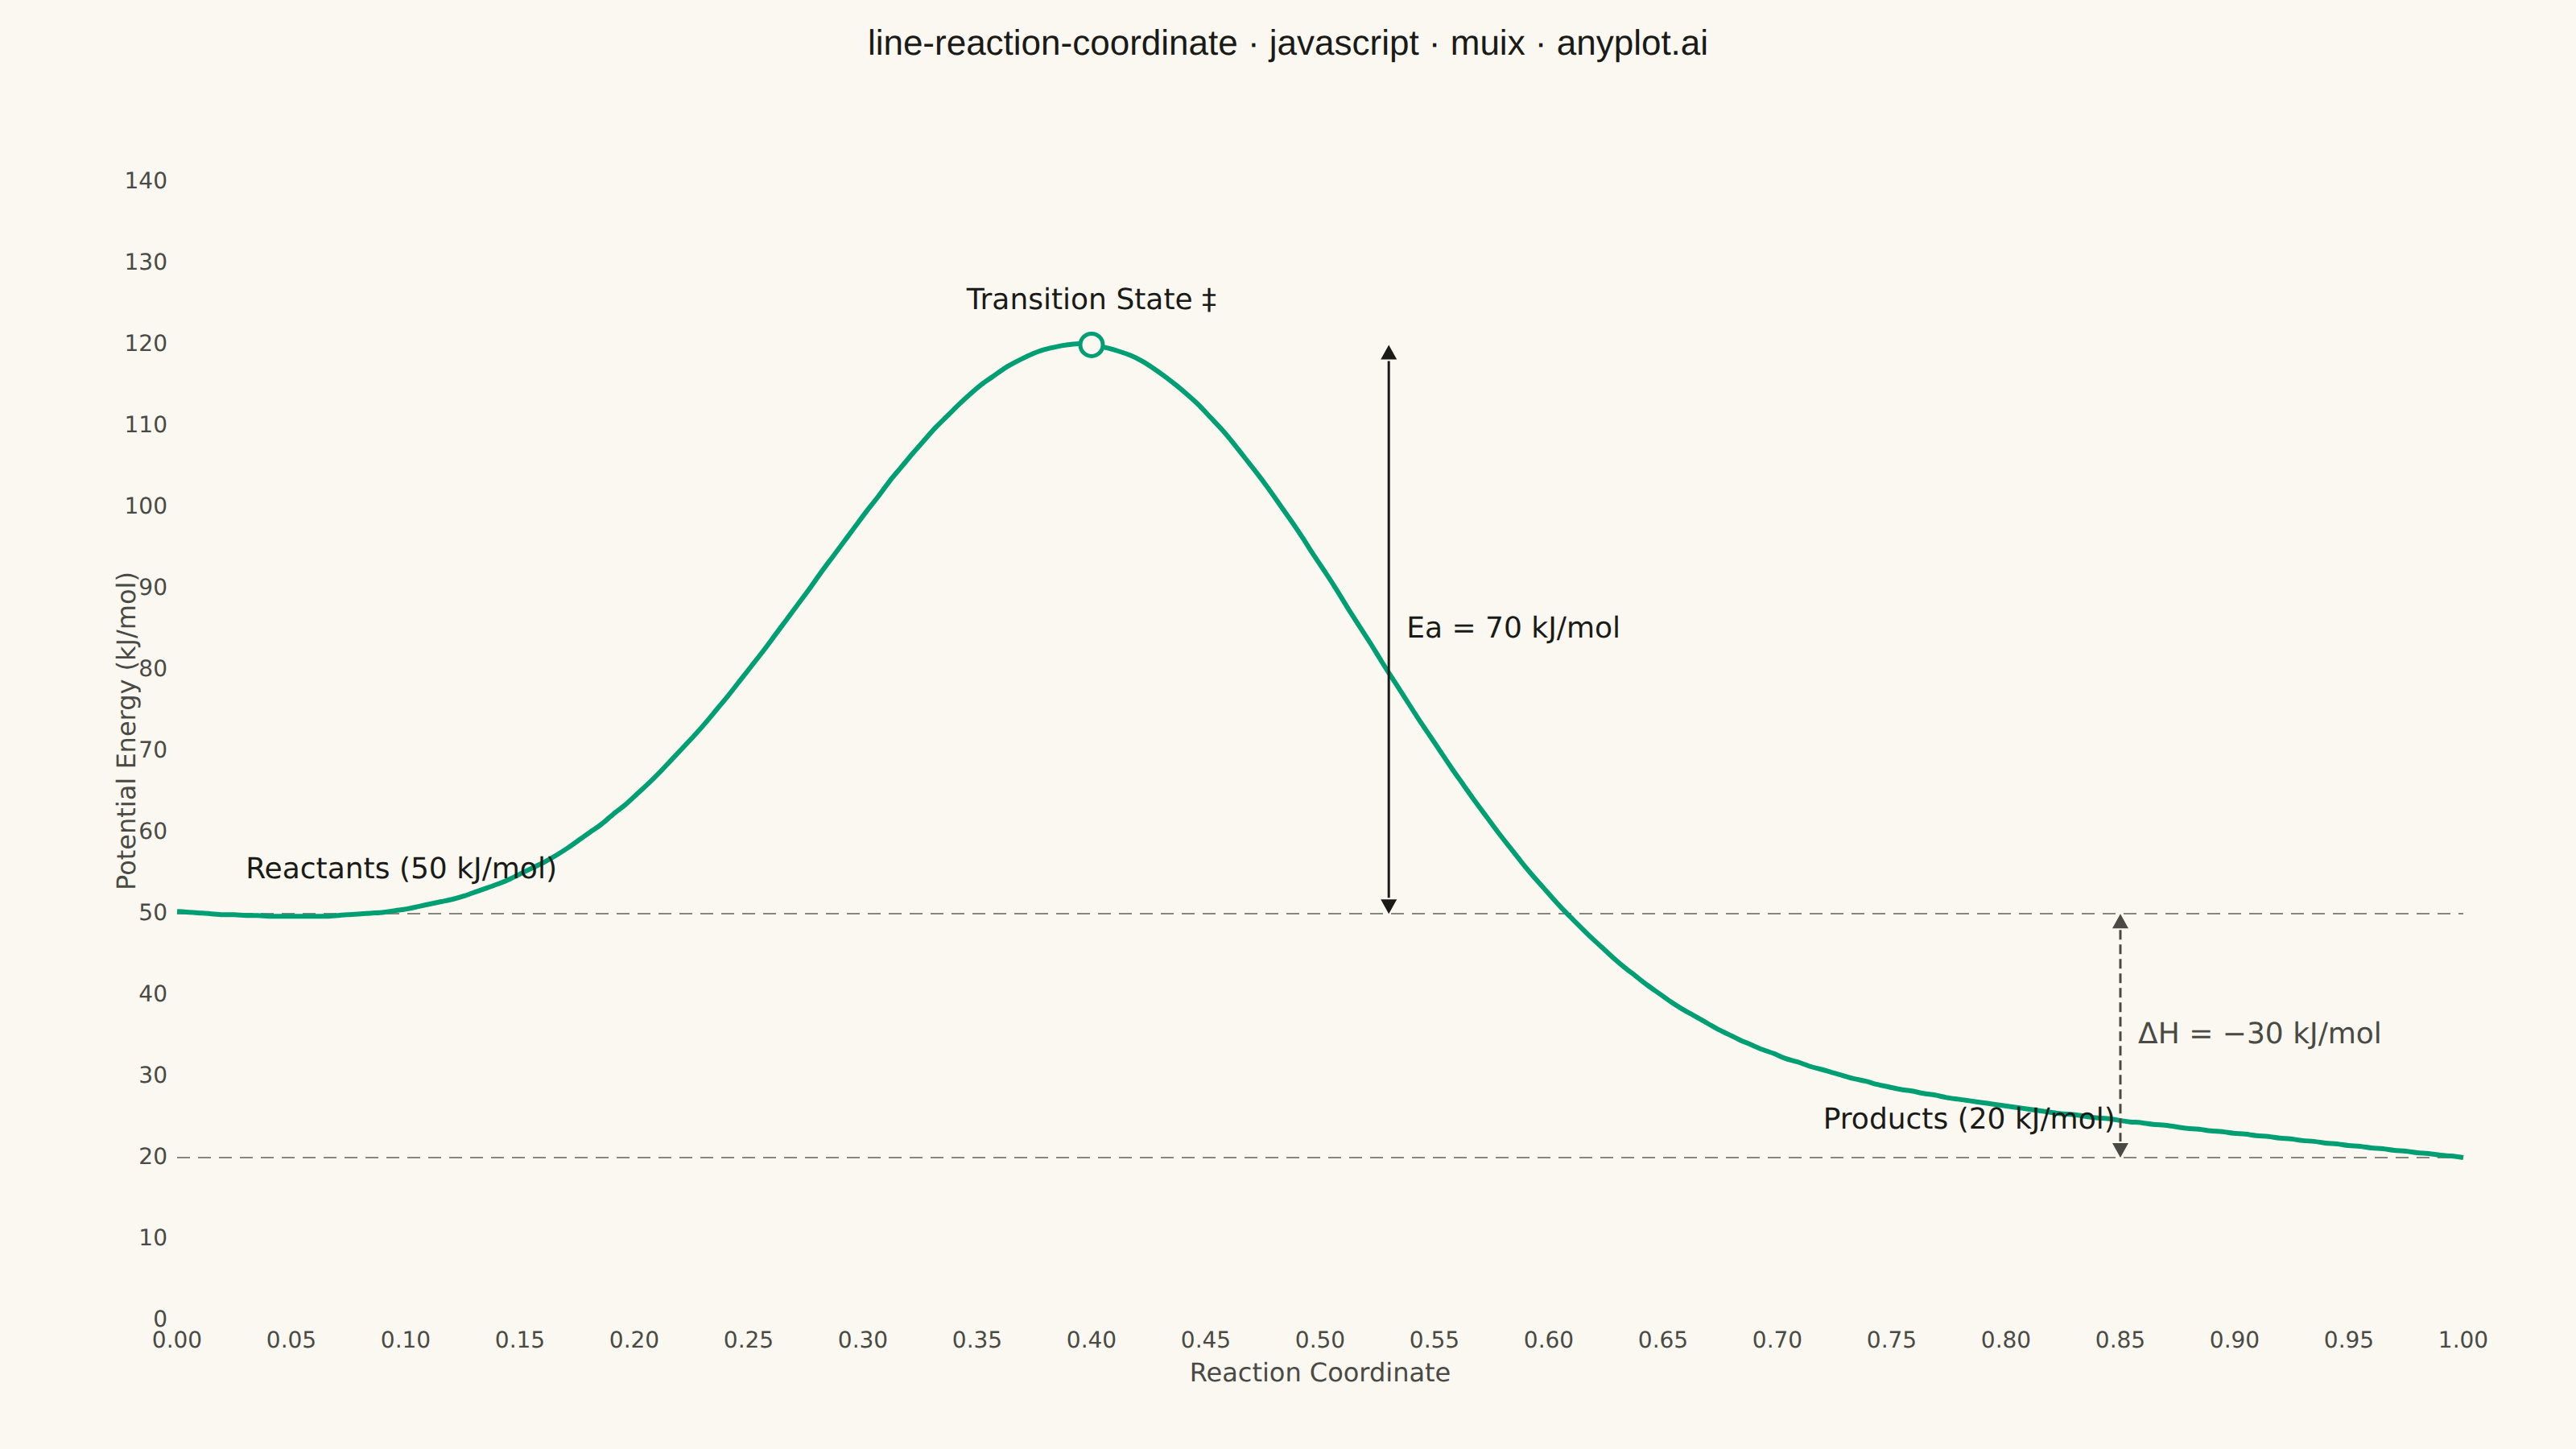
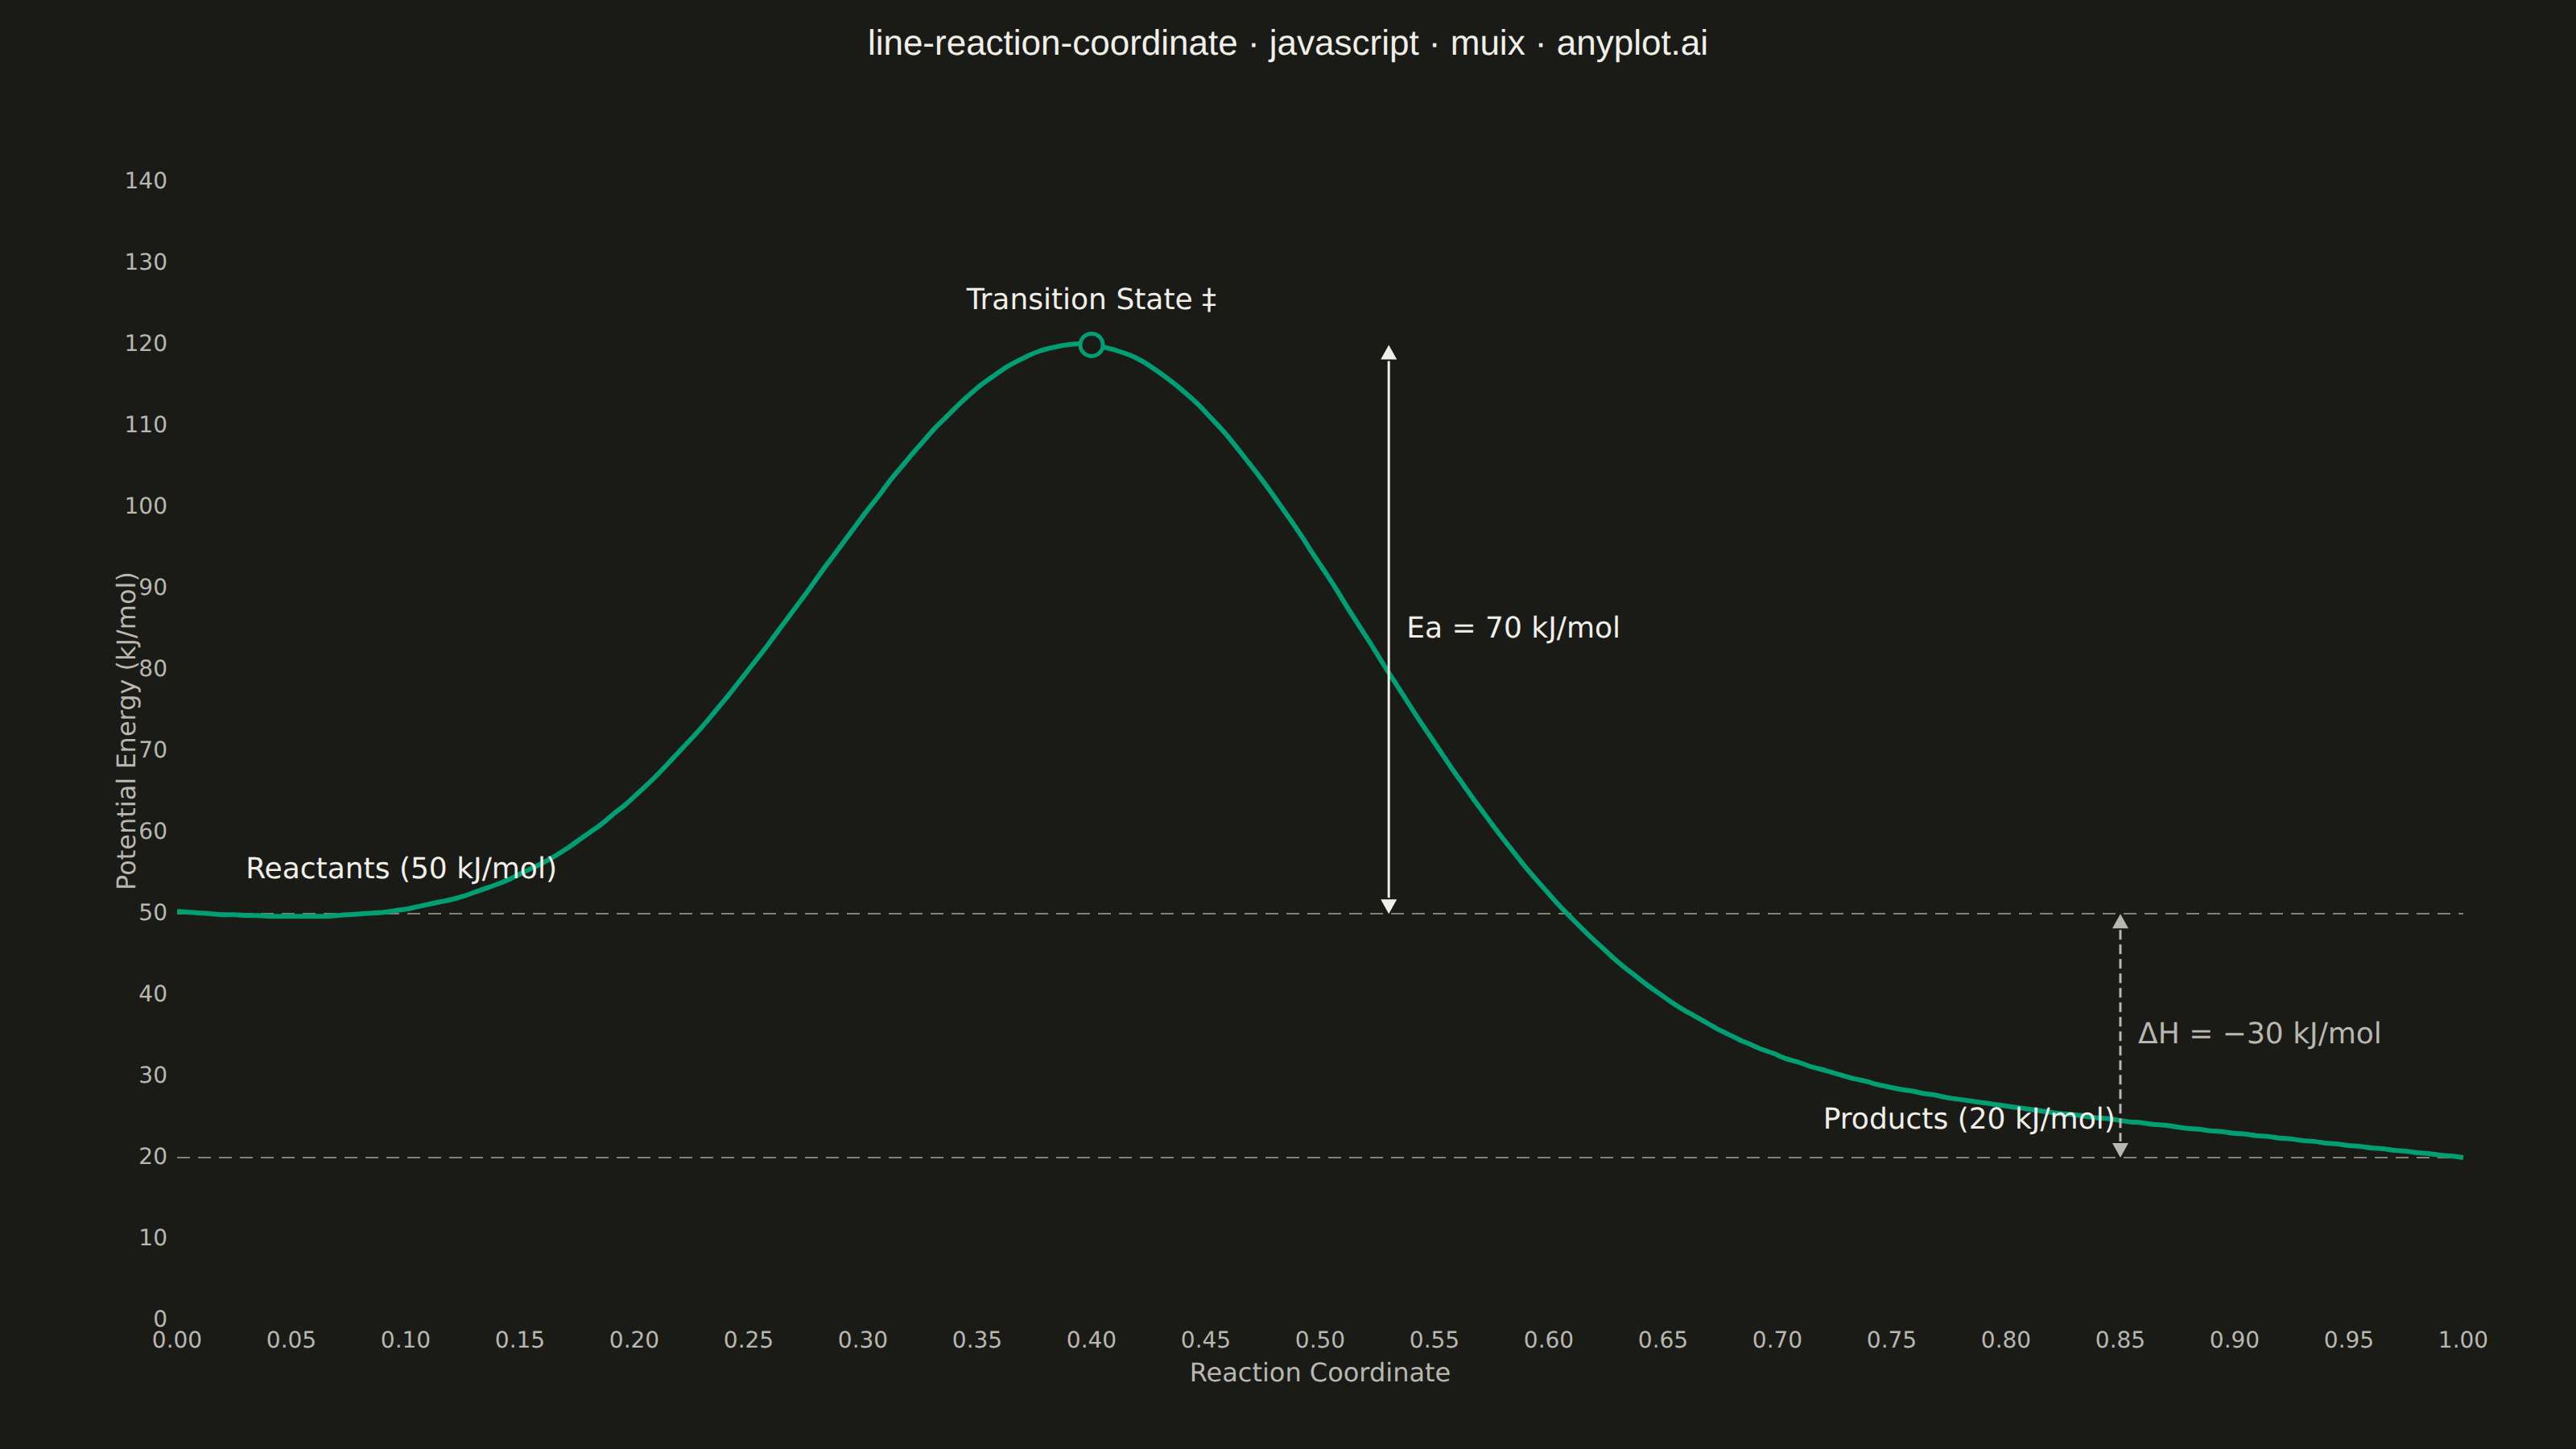
A reaction coordinate diagram plots potential energy against reaction progress, showing the energy landscape of a chemical transformation. The smooth curve traces the path from reactants through the transition state (energy maximum) to products, clearly depicting the activation energy barrier and overall enthalpy change. This fundamental chemistry visualization is essential for understanding reaction kinetics and thermodynamics.
// anyplot.ai
// line-reaction-coordinate: Reaction Coordinate Energy Diagram
// Library: muix 7.29.1 | JavaScript 22.22.3
// Quality: 88/100 | Created: 2026-06-24
//# anyplot-orientation: landscape
// anyplot.ai
// line-reaction-coordinate: Reaction Coordinate Energy Diagram
// Library: MUI X Charts | React | Node 22
// License: @mui/x-charts — MIT (community). Pro/Premium are out of scope.
// Quality: pending | Created: 2026-06-24

import { ChartContainer } from "@mui/x-charts/ChartContainer";
import { LinePlot } from "@mui/x-charts/LineChart";
import { ChartsXAxis } from "@mui/x-charts/ChartsXAxis";
import { ChartsYAxis } from "@mui/x-charts/ChartsYAxis";
import { ChartsReferenceLine } from "@mui/x-charts/ChartsReferenceLine";
import { useDrawingArea } from "@mui/x-charts/hooks";
import Box from "@mui/material/Box";
import Typography from "@mui/material/Typography";

const t = window.ANYPLOT_TOKENS;
const FONT = "system-ui, -apple-system, sans-serif";

// Energy diagram: single-step exothermic reaction (kJ/mol)
const E_REACTANTS  = 50;
const E_TRANSITION = 120;
const E_PRODUCTS   = 20;
const X_PEAK       = 0.4;   // reaction coordinate at transition state

// Y-axis bounds — must match yAxis min/max below for correct coordinate mapping
const Y_MIN = 0;
const Y_MAX = 145;

// Smooth energy curve: baseline from 50→20, Gaussian peak at TS (200 points)
// E(x) = (50 + (20-50)*x) + 82 * exp(-0.5 * ((x - 0.4) / 0.12)^2)
// At x=0: ≈50.3  |  x=0.4: 120.0  |  x=1: ≈20.0
const N = 200;
const xData = Array.from({ length: N }, (_, i) => i / (N - 1));
const yData = xData.map((x) => {
  const baseline = E_REACTANTS + (E_PRODUCTS - E_REACTANTS) * x;
  const peak = 82 * Math.exp(-0.5 * Math.pow((x - X_PEAK) / 0.12, 2));
  return Math.round((baseline + peak) * 10) / 10;
});

// Custom SVG annotations: labels + double-headed arrows for Ea and ΔH.
// Renders inside ChartContainer's SVG; uses useDrawingArea for coordinate mapping.
function EnergyAnnotations() {
  const { left, top, width, height } = useDrawingArea();

  // Linear mapping: data coords → SVG pixel position
  const toX = (x) => left + x * width;
  const toY = (y) => top + ((Y_MAX - y) / (Y_MAX - Y_MIN)) * height;

  const yR  = toY(E_REACTANTS);   // pixel y for reactant level (50)
  const yTS = toY(E_TRANSITION);  // pixel y for transition state (120)
  const yP  = toY(E_PRODUCTS);    // pixel y for product level (20)

  // Arrow x positions (in data-coordinate space)
  const xEa  = toX(0.53);  // Ea annotation — right of peak, descending area
  const xDH  = toX(0.85);  // ΔH annotation — flat product region

  const AW = 5;  // arrowhead half-width (px)
  const AH = 9;  // arrowhead height (px)

  const ink     = t.ink;
  const inkSoft = t.inkSoft;
  const green   = t.palette[0];

  return (
    <g fontFamily={FONT}>
      {/* ── Transition state peak marker — hollow circle on the curve ── */}
      <circle
        cx={toX(X_PEAK)}
        cy={yTS}
        r={7}
        fill={t.pageBg}
        stroke={green}
        strokeWidth={2.5}
      />

      {/* ── Ea arrow: reactant level → transition state ── */}
      <line
        x1={xEa} y1={yTS + AH + 1}
        x2={xEa} y2={yR - AH - 1}
        stroke={ink} strokeWidth={1.5}
      />
      {/* Upper tip (at TS level, pointing up) */}
      <polygon
        points={`${xEa - AW},${yTS + AH} ${xEa + AW},${yTS + AH} ${xEa},${yTS}`}
        fill={ink}
      />
      {/* Lower tip (at reactant level, pointing down) */}
      <polygon
        points={`${xEa - AW},${yR - AH} ${xEa + AW},${yR - AH} ${xEa},${yR}`}
        fill={ink}
      />
      <text
        x={xEa + 11} y={(yTS + yR) / 2}
        fill={ink} fontSize={18} dominantBaseline="middle" fontWeight="500"
      >
        Ea = 70 kJ/mol
      </text>

      {/* ── ΔH arrow: reactant level → product level ── */}
      <line
        x1={xDH} y1={yR + AH + 1}
        x2={xDH} y2={yP - AH - 1}
        stroke={inkSoft} strokeWidth={1.5} strokeDasharray="6 3"
      />
      {/* Upper tip (at reactant level, pointing up) */}
      <polygon
        points={`${xDH - AW},${yR + AH} ${xDH + AW},${yR + AH} ${xDH},${yR}`}
        fill={inkSoft}
      />
      {/* Lower tip (at product level, pointing down) */}
      <polygon
        points={`${xDH - AW},${yP - AH} ${xDH + AW},${yP - AH} ${xDH},${yP}`}
        fill={inkSoft}
      />
      <text
        x={xDH + 11} y={(yR + yP) / 2}
        fill={inkSoft} fontSize={18} dominantBaseline="middle"
      >
        ΔH = −30 kJ/mol
      </text>

      {/* ── Transition State label (above peak marker) ── */}
      <text
        x={toX(X_PEAK)} y={yTS - 22}
        fill={ink} fontSize={18} textAnchor="middle" fontWeight="500"
      >
        Transition State ‡
      </text>

      {/* ── Reactants label — offset 22px above dashed reference line ── */}
      <text
        x={toX(0.03)} y={yR - 22}
        fill={ink} fontSize={18} textAnchor="start"
      >
        Reactants (50 kJ/mol)
      </text>

      {/* ── Products label ── */}
      <text
        x={toX(0.72)} y={yP - 18}
        fill={ink} fontSize={18} textAnchor="start"
      >
        Products (20 kJ/mol)
      </text>
    </g>
  );
}

export default function Chart() {
  const { width, height } = window.ANYPLOT_SIZE;
  const titleH = 52;

  return (
    <Box
      sx={{
        width,
        height,
        bgcolor: t.pageBg,
        display: "flex",
        flexDirection: "column",
        pt: "14px",
      }}
    >
      <Typography
        sx={{
          color: t.ink,
          fontSize: 22,
          fontWeight: 500,
          textAlign: "center",
          lineHeight: 1.2,
          mb: "4px",
          fontFamily: "inherit",
        }}
      >
        line-reaction-coordinate · javascript · muix · anyplot.ai
      </Typography>

      <ChartContainer
        width={width}
        height={height - titleH}
        margin={{ left: 110, right: 70, top: 44, bottom: 72 }}
        series={[
          {
            type: "line",
            id: "energy",
            data: yData,
            color: t.palette[0],  // Imprint brand green — first series
            showMark: false,
            curve: "natural",
            label: "Energy profile",
          },
        ]}
        xAxis={[{
          data: xData,
          scaleType: "linear",
          min: 0,
          max: 1,
        }]}
        yAxis={[{
          min: Y_MIN,
          max: Y_MAX,
          valueFormatter: (v) => `${v}`,
        }]}
        sx={{
          "& .MuiLineElement-root": { strokeWidth: 3 },
          "& .MuiChartsAxis-line": { stroke: t.inkSoft, strokeWidth: 0.7 },
          "& .MuiChartsAxis-tick": { stroke: t.inkSoft, strokeWidth: 0.7 },
        }}
      >
        {/* Horizontal dashed reference lines at reactant and product energy levels */}
        <ChartsReferenceLine
          y={E_REACTANTS}
          lineStyle={{
            stroke: t.inkSoft,
            strokeDasharray: "8 5",
            strokeWidth: 1.2,
            opacity: 0.65,
          }}
        />
        <ChartsReferenceLine
          y={E_PRODUCTS}
          lineStyle={{
            stroke: t.inkSoft,
            strokeDasharray: "8 5",
            strokeWidth: 1.2,
            opacity: 0.65,
          }}
        />

        {/* Energy curve */}
        <LinePlot skipAnimation />

        {/* Axes */}
        <ChartsXAxis
          label="Reaction Coordinate"
          tickLabelStyle={{ fontSize: 14, fill: t.inkSoft, fontFamily: FONT }}
          labelStyle={{ fontSize: 16, fontWeight: "500", fill: t.inkSoft, fontFamily: FONT }}
          disableLine
          disableTicks
        />
        <ChartsYAxis
          label="Potential Energy (kJ/mol)"
          tickLabelStyle={{ fontSize: 14, fill: t.inkSoft, fontFamily: FONT }}
          labelStyle={{ fontSize: 16, fontWeight: "500", fill: t.inkSoft, fontFamily: FONT }}
          disableLine
          disableTicks
        />

        {/* Custom annotations: peak marker, labels, and measurement arrows */}
        <EnergyAnnotations />
      </ChartContainer>
    </Box>
  );
}
Runnable source as JSON, for any HTTP client: https://api.anyplot.ai/specs/line-reaction-coordinate/muix/code. Any spec id and library id listed in llms-full.txt fit the same URL shape; every URL below is complete and callable.
{
  "spec_id": "line-reaction-coordinate",
  "language": "javascript",
  "library": "muix",
  "page": "https://anyplot.ai/line-reaction-coordinate/javascript/muix",
  "hub": "https://anyplot.ai/line-reaction-coordinate",
  "code_json": "https://api.anyplot.ai/specs/line-reaction-coordinate/muix/code",
  "spec_json": "https://api.anyplot.ai/specs/line-reaction-coordinate",
  "render_light_png": "https://storage.googleapis.com/anyplot-images/plots/line-reaction-coordinate/javascript/muix/plot-light.png",
  "render_dark_png": "https://storage.googleapis.com/anyplot-images/plots/line-reaction-coordinate/javascript/muix/plot-dark.png",
  "interactive_light_html": "https://storage.googleapis.com/anyplot-images/plots/line-reaction-coordinate/javascript/muix/plot-light.html",
  "interactive_dark_html": "https://storage.googleapis.com/anyplot-images/plots/line-reaction-coordinate/javascript/muix/plot-dark.html",
  "quality_score": 88.0,
  "license": "MIT",
  "guide": "https://anyplot.ai/llms.txt"
}
Part of Reaction Coordinate Energy Diagram on anyplot.ai.