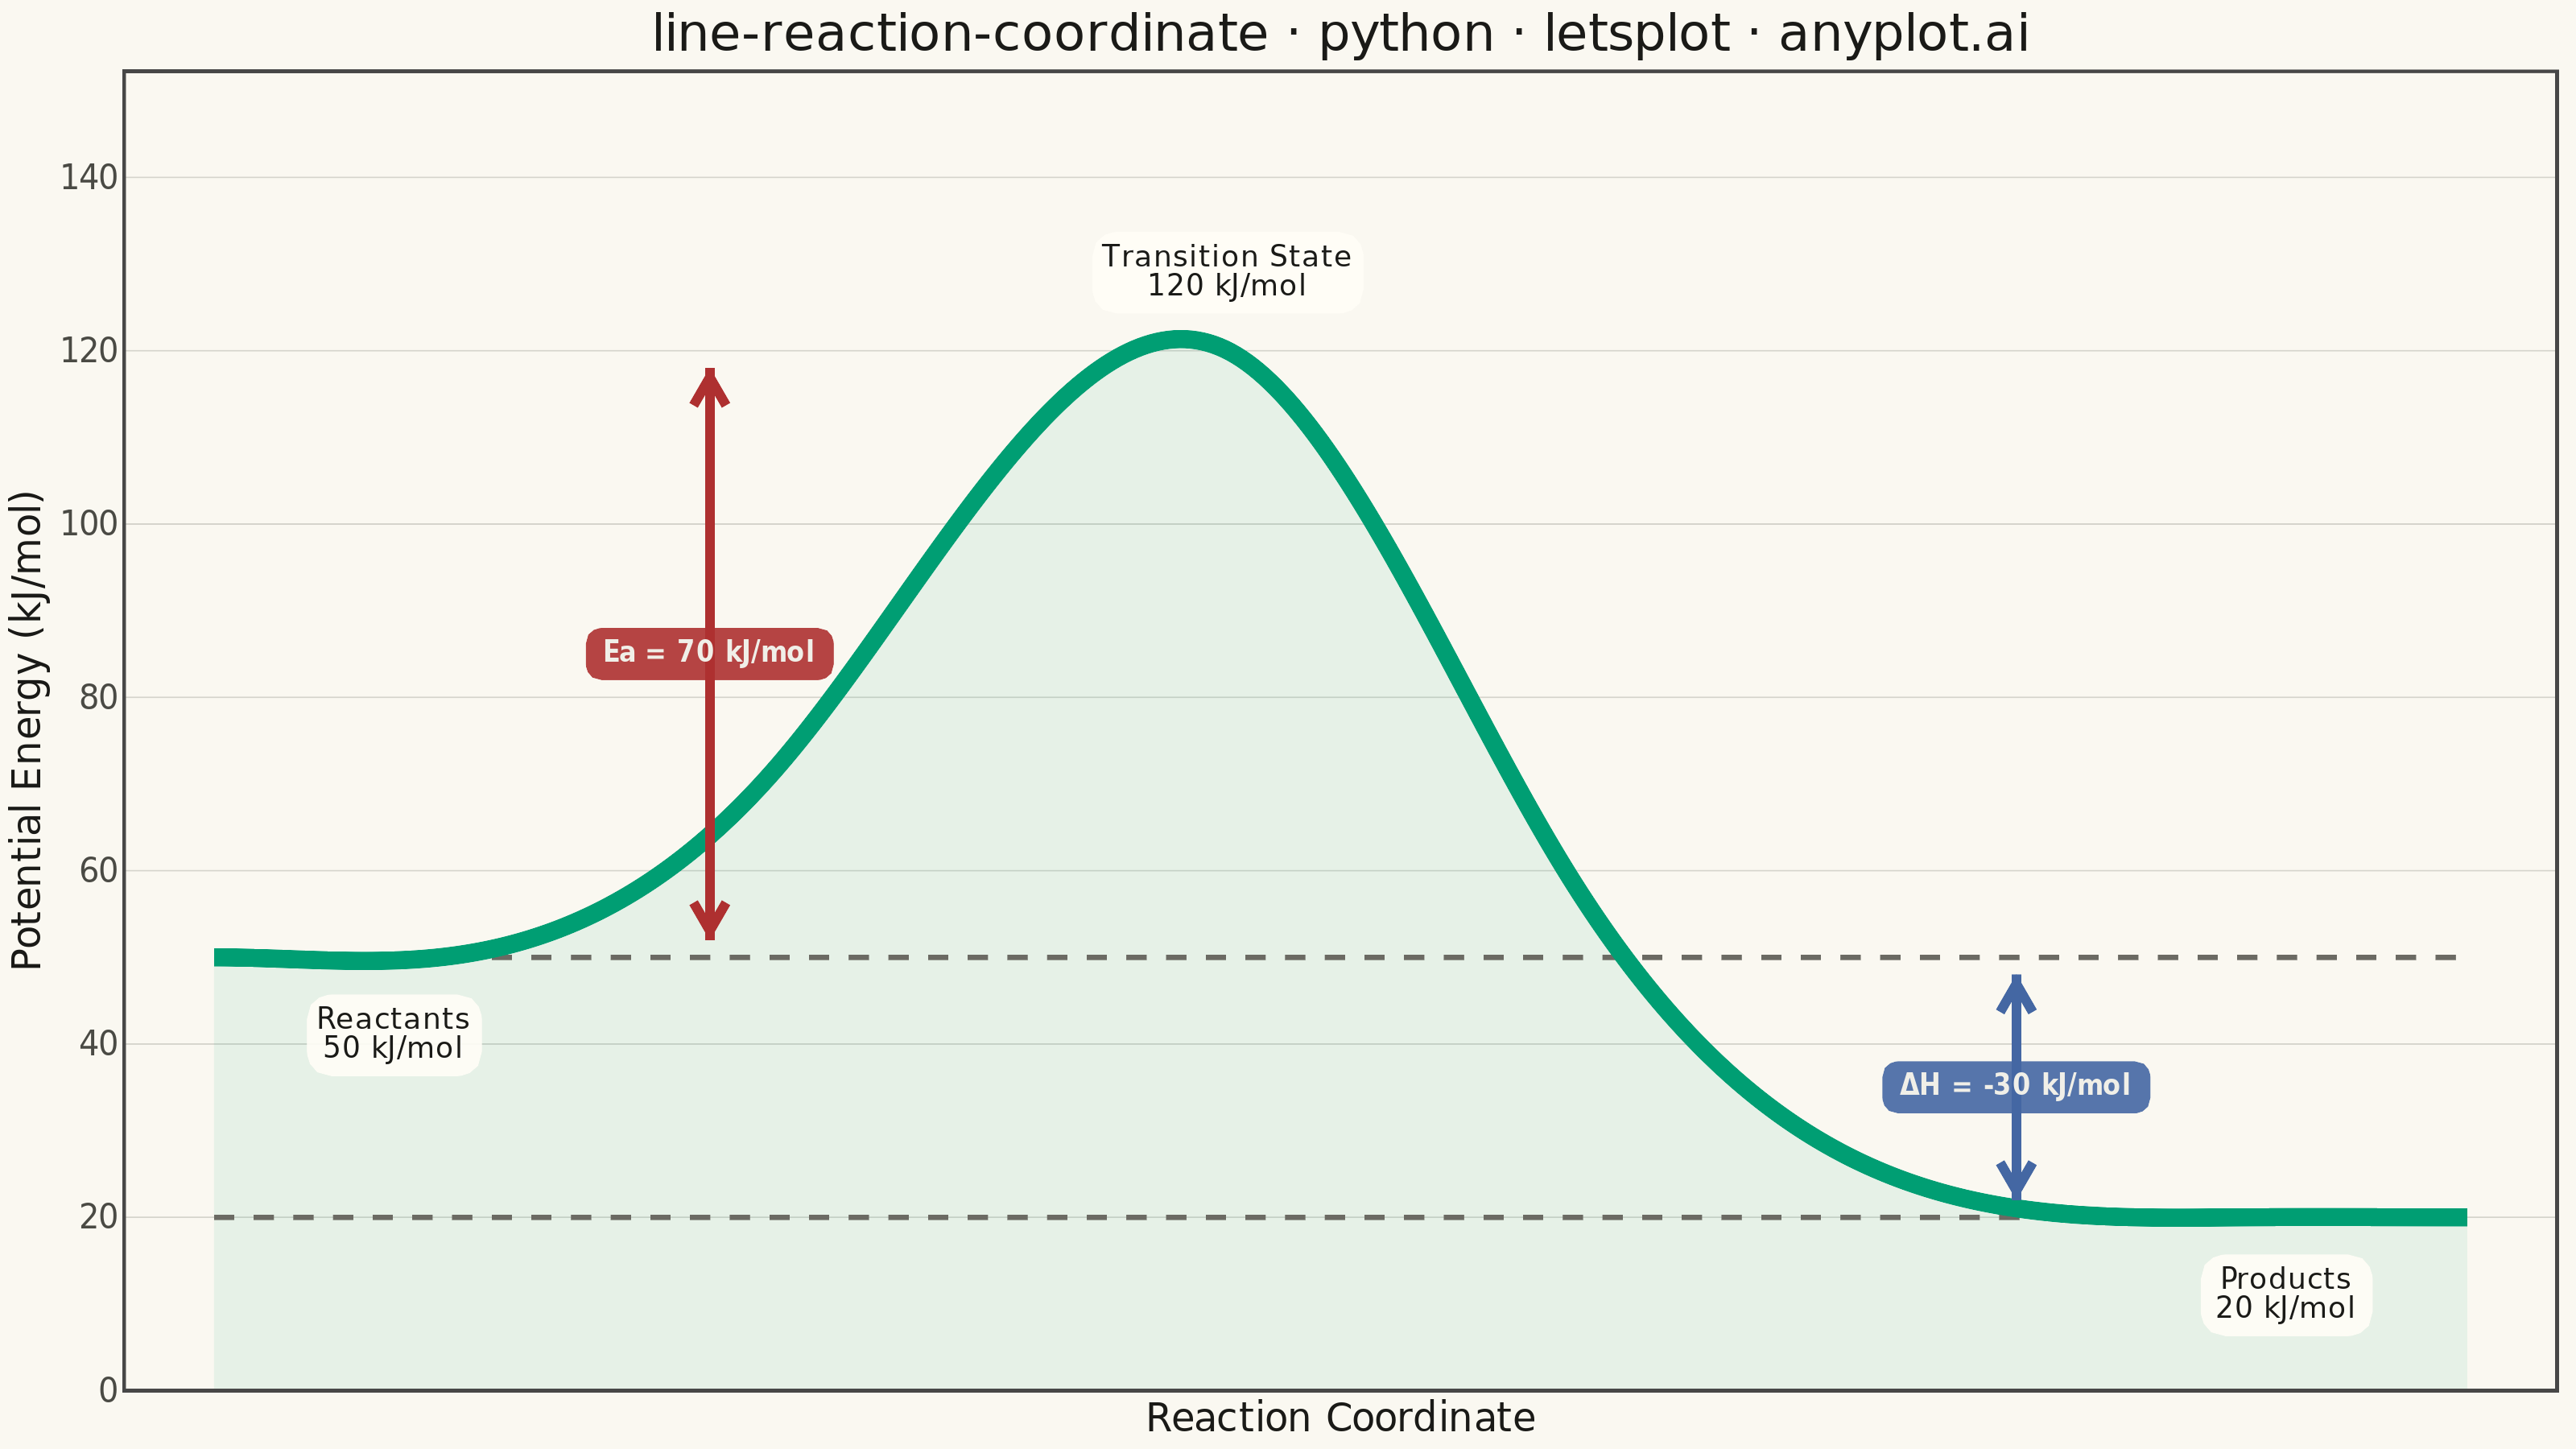
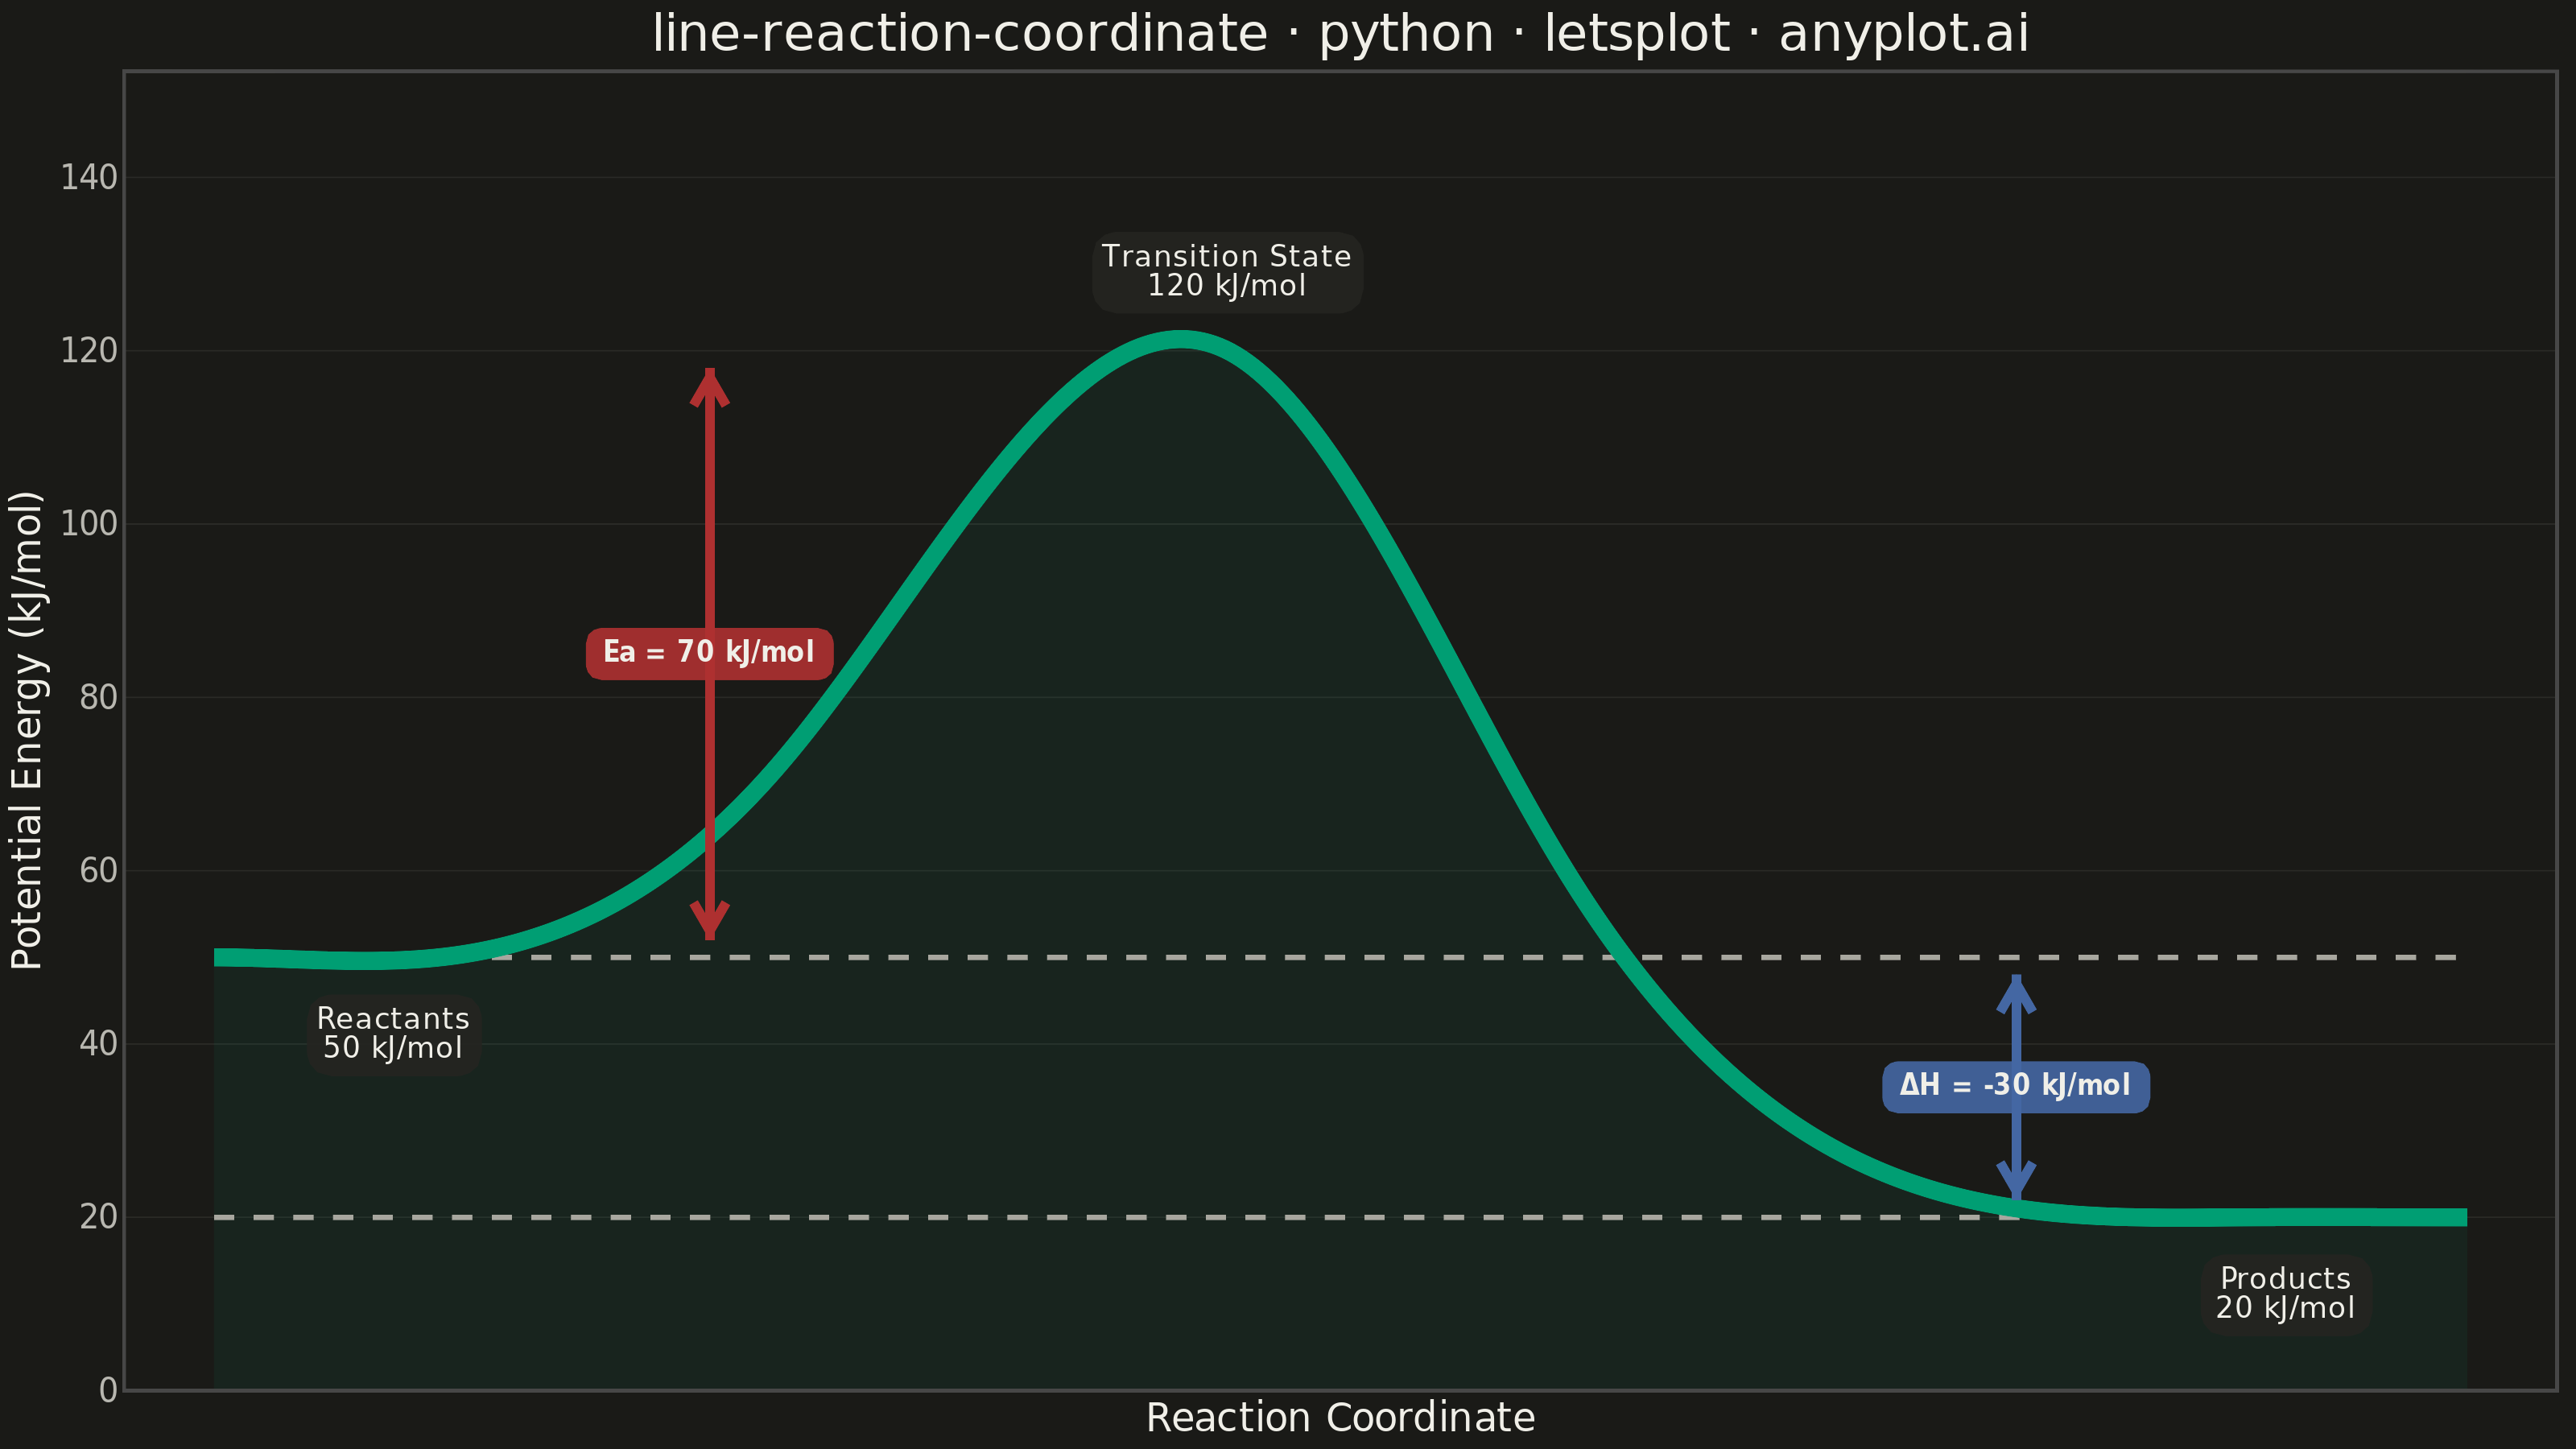
A reaction coordinate diagram plots potential energy against reaction progress, showing the energy landscape of a chemical transformation. The smooth curve traces the path from reactants through the transition state (energy maximum) to products, clearly depicting the activation energy barrier and overall enthalpy change. This fundamental chemistry visualization is essential for understanding reaction kinetics and thermodynamics.
""" anyplot.ai
line-reaction-coordinate: Reaction Coordinate Energy Diagram
Library: letsplot 4.10.1 | Python 3.13.14
Quality: 89/100 | Updated: 2026-06-24
"""

import os

import numpy as np
import pandas as pd
from lets_plot import (
    LetsPlot,
    aes,
    arrow,
    element_blank,
    element_line,
    element_rect,
    element_text,
    geom_area,
    geom_label,
    geom_line,
    geom_segment,
    ggplot,
    ggsize,
    labs,
    scale_x_continuous,
    scale_y_continuous,
    theme,
)
from lets_plot.export import ggsave
from scipy.interpolate import CubicSpline


LetsPlot.setup_html()

# Theme tokens (Imprint palette — see prompts/default-style-guide.md)
THEME = os.getenv("ANYPLOT_THEME", "light")
PAGE_BG = "#FAF8F1" if THEME == "light" else "#1A1A17"
ELEVATED_BG = "#FFFDF6" if THEME == "light" else "#242420"
INK = "#1A1A17" if THEME == "light" else "#F0EFE8"
INK_SOFT = "#4A4A44" if THEME == "light" else "#B8B7B0"
INK_MUTED = "#6B6A63" if THEME == "light" else "#A8A79F"
GRID_COLOR = "#D5D4CC" if THEME == "light" else "#2A2A26"

# Imprint palette
CURVE_COLOR = "#009E73"  # Imprint position 1 — main energy curve
EA_COLOR = "#AE3030"  # Imprint position 5 (matte red) — activation energy barrier
DH_COLOR = "#4467A3"  # Imprint position 3 (blue) — enthalpy change

# Data: single-step exothermic reaction via cubic spline interpolation
# Control points chosen for realistic reactant plateau, TS peak, and product plateau
reactant_energy = 50.0
transition_energy = 120.0
product_energy = 20.0
peak_pos = 0.45

ctrl_x = np.array([0.0, 0.10, 0.25, 0.45, 0.60, 0.78, 0.90, 1.0])
ctrl_y = np.array([50.0, 50.0, 72.0, 120.0, 60.0, 22.0, 20.0, 20.0])
cs = CubicSpline(ctrl_x, ctrl_y, bc_type=((1, 0.0), (1, 0.0)))

reaction_coord = np.linspace(0, 1, 400)
energy = cs(reaction_coord)
df = pd.DataFrame({"reaction_coordinate": reaction_coord, "energy": energy})

ea = transition_energy - reactant_energy
delta_h = product_energy - reactant_energy

# Horizontal reference dashed lines at reactant and product energy levels
hline_df = pd.DataFrame(
    {
        "x": [0.0, 0.0],
        "xend": [1.0, 1.0],
        "y": [reactant_energy, product_energy],
        "yend": [reactant_energy, product_energy],
    }
)

# Ea double-headed arrow
ea_x = 0.22
ea_arrow_df = pd.DataFrame(
    {
        "x": [ea_x, ea_x],
        "y": [reactant_energy + 2, transition_energy - 2],
        "xend": [ea_x, ea_x],
        "yend": [transition_energy - 2, reactant_energy + 2],
    }
)

# ΔH double-headed arrow
dh_x = 0.80
dh_arrow_df = pd.DataFrame(
    {
        "x": [dh_x, dh_x],
        "y": [reactant_energy - 2, product_energy + 2],
        "xend": [dh_x, dh_x],
        "yend": [product_energy + 2, reactant_energy - 2],
    }
)

# Title font scaling (57 chars < 67 baseline → no scaling needed)
title_str = "line-reaction-coordinate · python · letsplot · anyplot.ai"
n = len(title_str)
default_fontsize = 16
ratio = 67 / n if n > 67 else 1.0
title_fontsize = max(11, round(default_fontsize * ratio))

anyplot_theme = theme(
    plot_background=element_rect(fill=PAGE_BG, color=PAGE_BG),
    panel_background=element_rect(fill=PAGE_BG),
    panel_border=element_blank(),
    panel_grid_major_y=element_line(color=GRID_COLOR, size=0.4),
    panel_grid_minor=element_blank(),
    panel_grid_major_x=element_blank(),
    axis_title=element_text(color=INK, size=12),
    axis_text=element_text(color=INK_SOFT, size=10),
    axis_text_x=element_blank(),
    axis_ticks_x=element_blank(),
    axis_line_x=element_line(color=INK_SOFT, size=0.5),
    axis_line_y=element_line(color=INK_SOFT, size=0.5),
    plot_title=element_text(color=INK, size=title_fontsize, hjust=0.5),
    legend_position="none",
)

plot = (
    ggplot(df, aes(x="reaction_coordinate", y="energy"))
    + geom_area(fill=CURVE_COLOR, alpha=0.08)
    + geom_segment(
        data=hline_df, mapping=aes(x="x", xend="xend", y="y", yend="yend"), linetype="dashed", color=INK_MUTED, size=0.7
    )
    + geom_line(color=CURVE_COLOR, size=2.5)
    + geom_segment(
        data=ea_arrow_df,
        mapping=aes(x="x", xend="xend", y="y", yend="yend"),
        color=EA_COLOR,
        size=1.3,
        arrow=arrow(length=10, type="open"),
    )
    + geom_segment(
        data=dh_arrow_df,
        mapping=aes(x="x", xend="xend", y="y", yend="yend"),
        color=DH_COLOR,
        size=1.3,
        arrow=arrow(length=10, type="open"),
    )
    + geom_label(
        data=pd.DataFrame({"x": [0.08], "y": [reactant_energy - 9], "label": ["Reactants\n50 kJ/mol"]}),
        mapping=aes(x="x", y="y", label="label"),
        size=4.5,
        color=INK,
        fill=ELEVATED_BG,
        alpha=0.9,
        label_padding=0.4,
        label_r=0.3,
        label_size=0,
    )
    + geom_label(
        data=pd.DataFrame({"x": [peak_pos], "y": [transition_energy + 9], "label": ["Transition State\n120 kJ/mol"]}),
        mapping=aes(x="x", y="y", label="label"),
        size=4.5,
        color=INK,
        fill=ELEVATED_BG,
        alpha=0.9,
        label_padding=0.4,
        label_r=0.3,
        label_size=0,
    )
    + geom_label(
        data=pd.DataFrame({"x": [0.92], "y": [product_energy - 9], "label": ["Products\n20 kJ/mol"]}),
        mapping=aes(x="x", y="y", label="label"),
        size=4.5,
        color=INK,
        fill=ELEVATED_BG,
        alpha=0.9,
        label_padding=0.4,
        label_r=0.3,
        label_size=0,
    )
    + geom_label(
        data=pd.DataFrame(
            {"x": [ea_x], "y": [(reactant_energy + transition_energy) / 2], "label": [f"Ea = {ea:.0f} kJ/mol"]}
        ),
        mapping=aes(x="x", y="y", label="label"),
        size=4.0,
        color="#F0EFE8",
        fill=EA_COLOR,
        alpha=0.9,
        label_padding=0.5,
        label_r=0.3,
        label_size=0,
        fontface="bold",
    )
    + geom_label(
        data=pd.DataFrame(
            {"x": [dh_x], "y": [(reactant_energy + product_energy) / 2], "label": [f"ΔH = {delta_h:.0f} kJ/mol"]}
        ),
        mapping=aes(x="x", y="y", label="label"),
        size=4.0,
        color="#F0EFE8",
        fill=DH_COLOR,
        alpha=0.9,
        label_padding=0.5,
        label_r=0.3,
        label_size=0,
        fontface="bold",
    )
    + scale_x_continuous(name="Reaction Coordinate", breaks=[], expand=[0.02, 0.02])
    + scale_y_continuous(name="Potential Energy (kJ/mol)", limits=[0, 145])
    + labs(title=title_str)
    + ggsize(800, 450)
    + anyplot_theme
)

# Save
ggsave(plot, filename=f"plot-{THEME}.png", path=".", scale=4)
ggsave(plot, filename=f"plot-{THEME}.html", path=".")
Runnable source as JSON, for any HTTP client: https://api.anyplot.ai/specs/line-reaction-coordinate/letsplot/code. Any spec id and library id listed in llms-full.txt fit the same URL shape; every URL below is complete and callable.
{
  "spec_id": "line-reaction-coordinate",
  "language": "python",
  "library": "letsplot",
  "page": "https://anyplot.ai/line-reaction-coordinate/python/letsplot",
  "hub": "https://anyplot.ai/line-reaction-coordinate",
  "code_json": "https://api.anyplot.ai/specs/line-reaction-coordinate/letsplot/code",
  "spec_json": "https://api.anyplot.ai/specs/line-reaction-coordinate",
  "render_light_png": "https://storage.googleapis.com/anyplot-images/plots/line-reaction-coordinate/python/letsplot/plot-light.png",
  "render_dark_png": "https://storage.googleapis.com/anyplot-images/plots/line-reaction-coordinate/python/letsplot/plot-dark.png",
  "interactive_light_html": "https://storage.googleapis.com/anyplot-images/plots/line-reaction-coordinate/python/letsplot/plot-light.html",
  "interactive_dark_html": "https://storage.googleapis.com/anyplot-images/plots/line-reaction-coordinate/python/letsplot/plot-dark.html",
  "quality_score": 89.0,
  "license": "MIT",
  "guide": "https://anyplot.ai/llms.txt"
}
Part of Reaction Coordinate Energy Diagram on anyplot.ai.