The same plot in 14 other libraries — JavaScript: Chart.js, Apache ECharts, Highcharts, MUI X Charts; Python: Altair, Bokeh, lets-plot, Matplotlib, Plotly, plotnine, Pygal, Seaborn; R: ggplot2; Julia: Makie.jl. Compare all 15 side by side: Basic Lollipop Chart in Python, R, Julia and JavaScript.
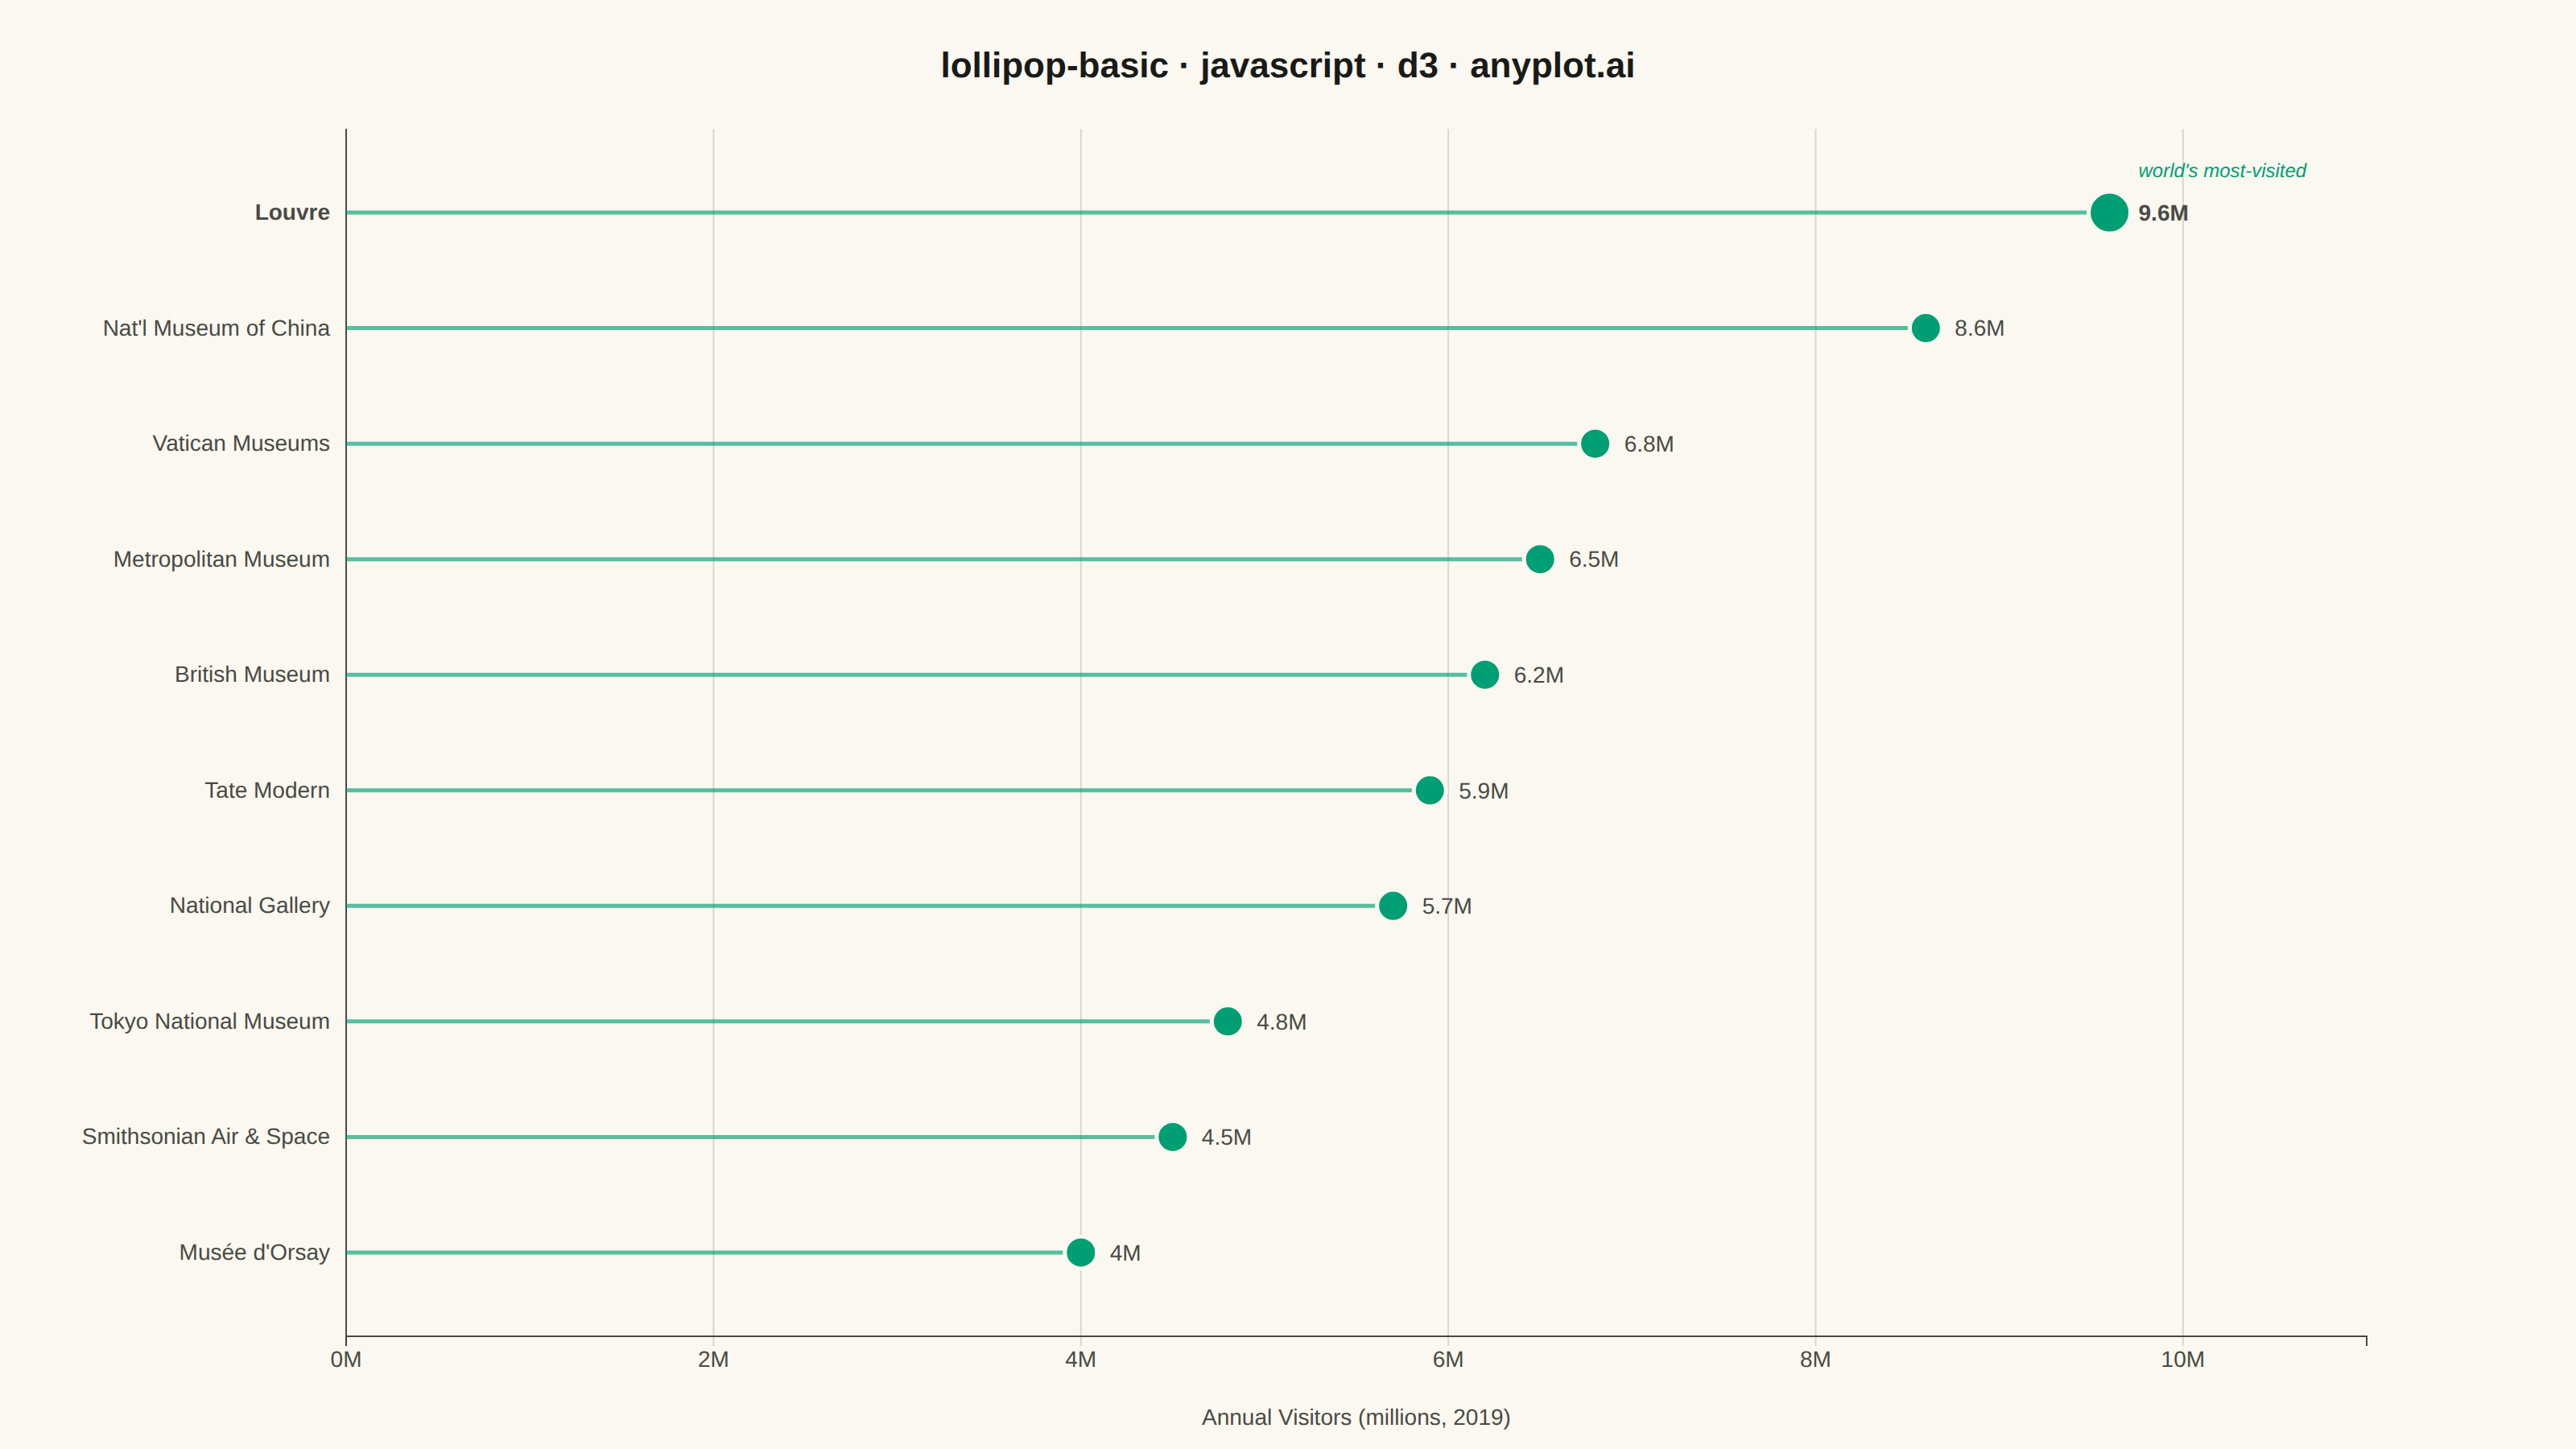
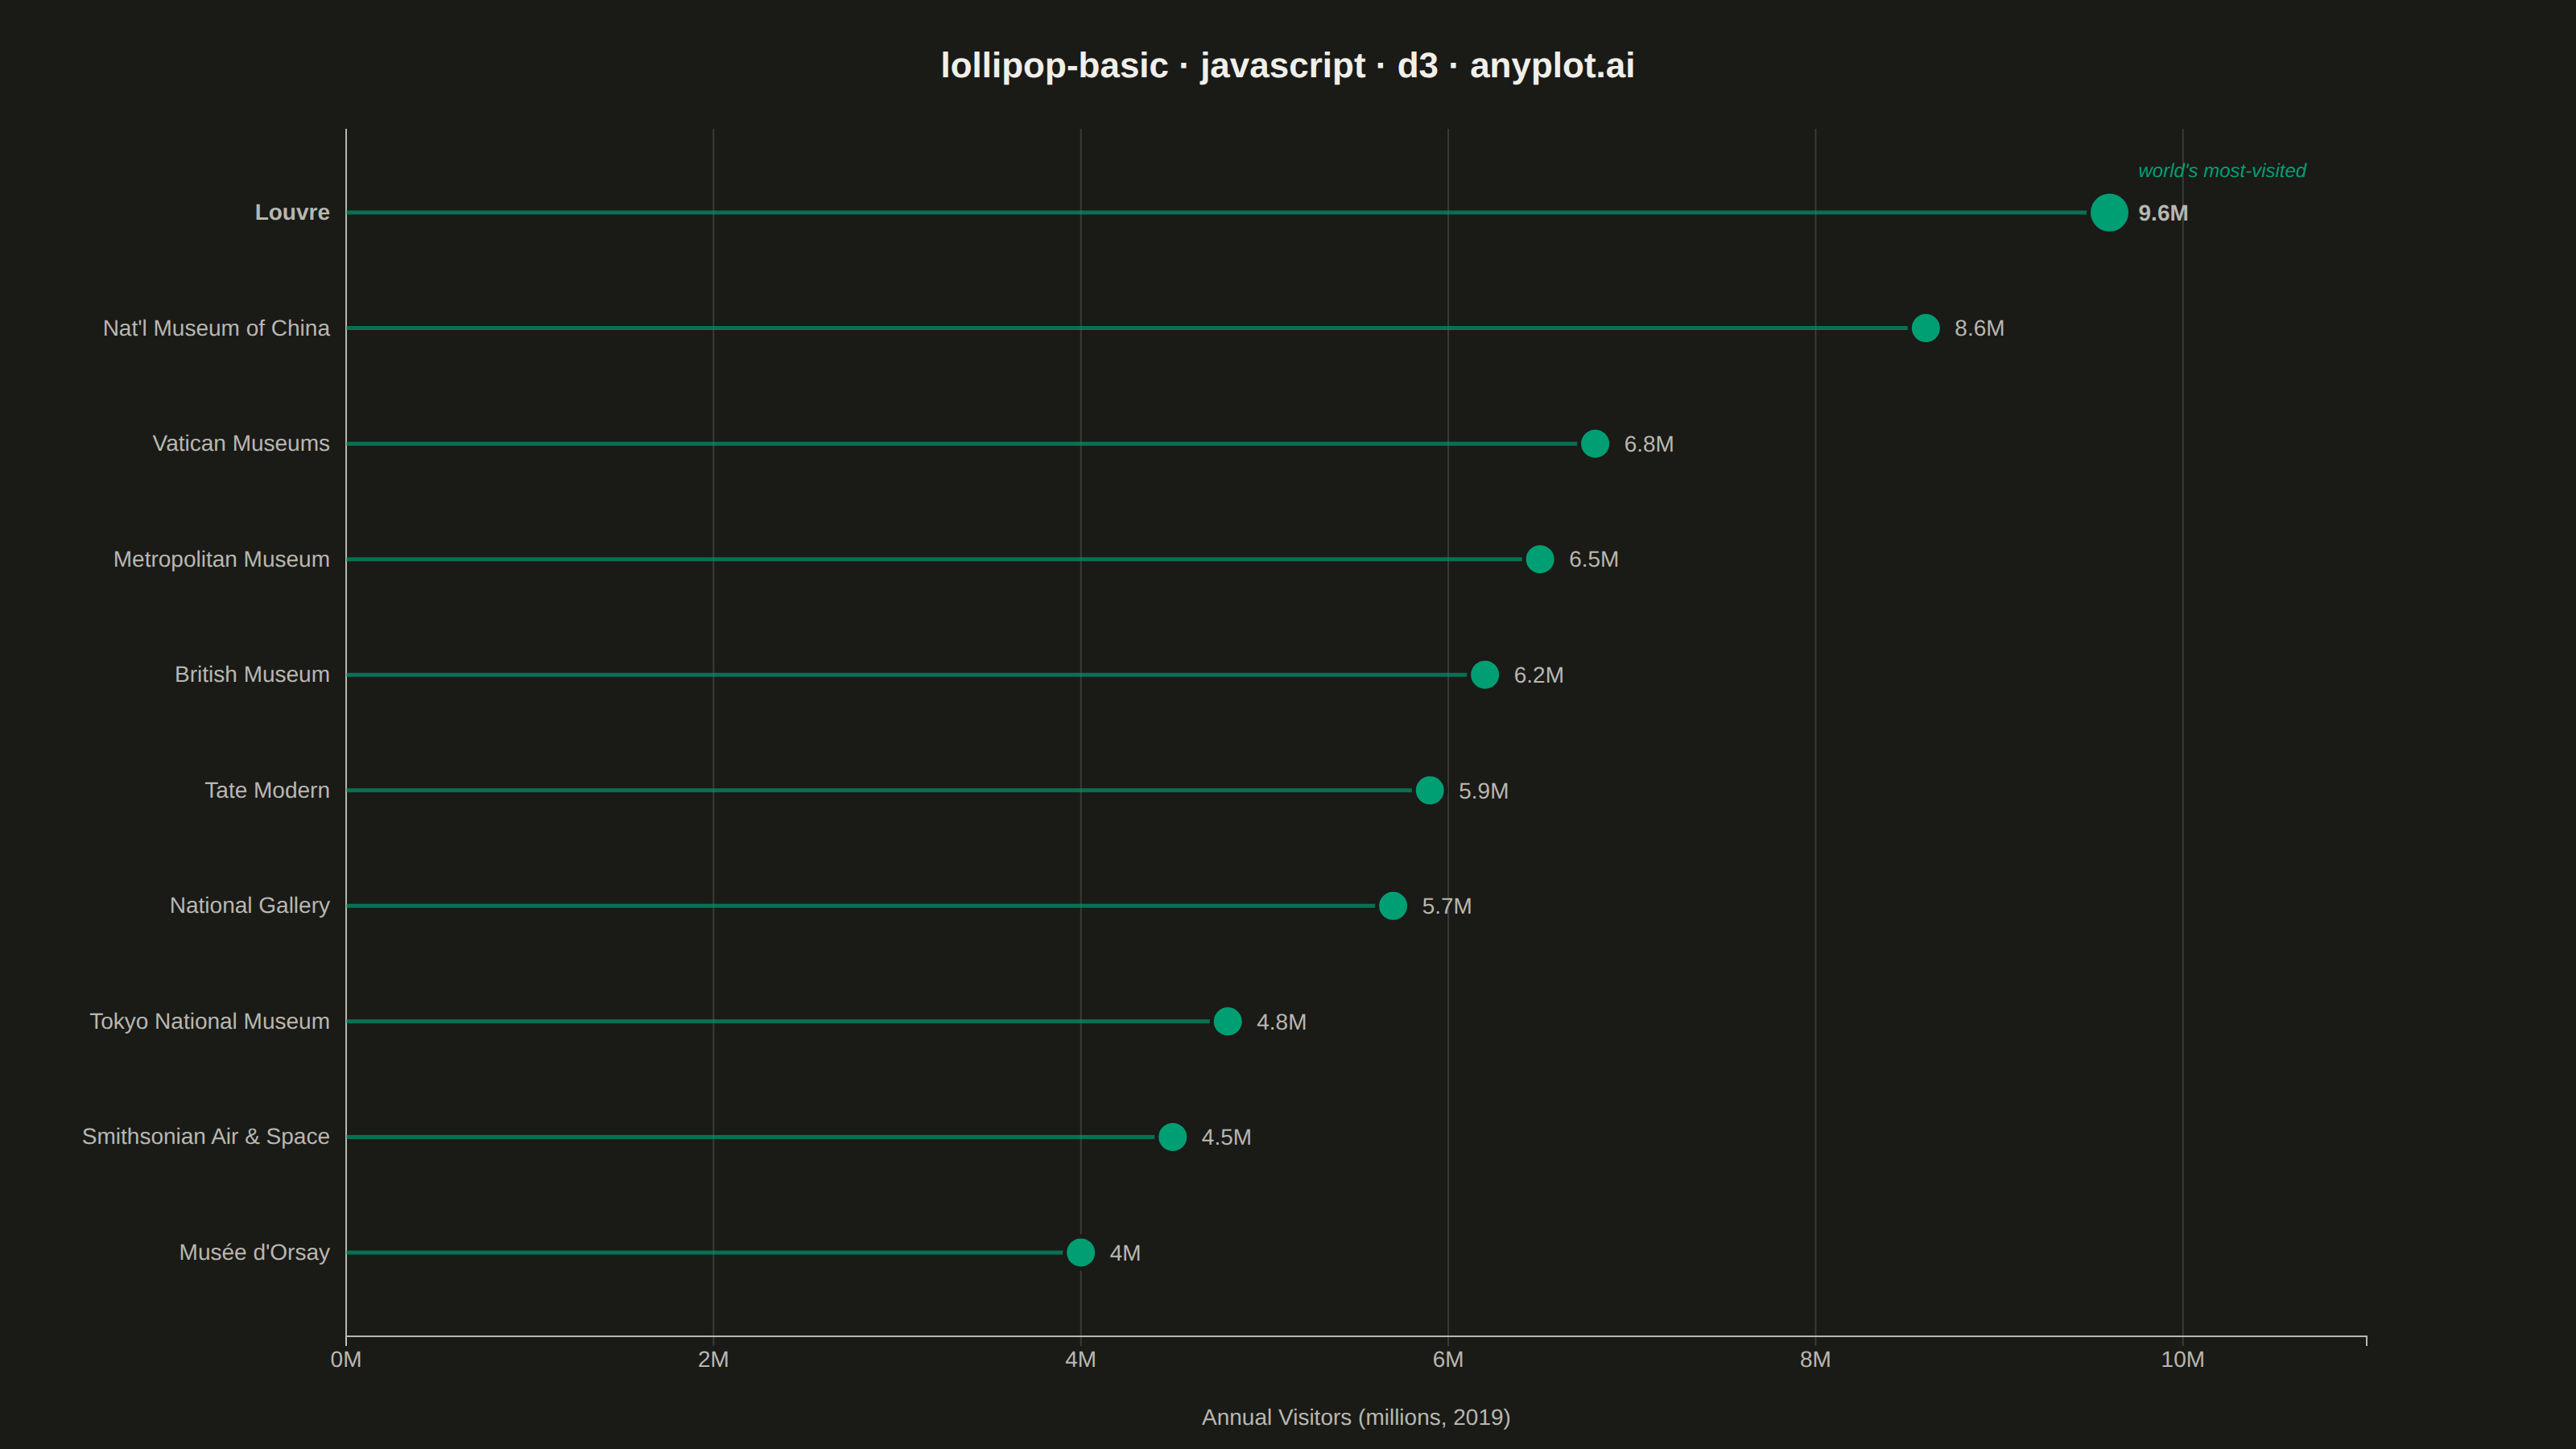
A lollipop chart displays categorical data with thin lines (stems) extending from a baseline to circular markers (dots) at each data point. It presents the same information as a bar chart but with a cleaner, more minimalist aesthetic that reduces visual clutter while maintaining clear value comparisons.
// anyplot.ai
// lollipop-basic: Basic Lollipop Chart
// Library: d3 7.9.0 | JavaScript 22.23.0
// Quality: 91/100 | Created: 2026-07-01
//# anyplot-orientation: landscape

const t = window.ANYPLOT_TOKENS;
const { width, height } = window.ANYPLOT_SIZE;
const margin = { top: 80, right: 130, bottom: 70, left: 215 };
const iw = width - margin.left - margin.right;
const ih = height - margin.top - margin.bottom;

// Data: World's most-visited museums (annual visitors, millions, 2019)
// sorted ascending — scaleBand range([ih,0]) maps first→bottom, last→top
const museums = [
  { name: "Musée d'Orsay",          visitors: 4.0 },
  { name: "Smithsonian Air & Space", visitors: 4.5 },
  { name: "Tokyo National Museum",   visitors: 4.8 },
  { name: "National Gallery",        visitors: 5.7 },
  { name: "Tate Modern",             visitors: 5.9 },
  { name: "British Museum",          visitors: 6.2 },
  { name: "Metropolitan Museum",     visitors: 6.5 },
  { name: "Vatican Museums",         visitors: 6.8 },
  { name: "Nat'l Museum of China",   visitors: 8.6 },
  { name: "Louvre",                  visitors: 9.6 },
];

// SVG
const svg = d3.select("#container").append("svg")
  .attr("width", width).attr("height", height);
const g = svg.append("g").attr("transform", `translate(${margin.left},${margin.top})`);

// Scales
const x = d3.scaleLinear().domain([0, 11]).range([0, iw]);
const y = d3.scaleBand()
  .domain(museums.map(d => d.name))
  .range([ih, 0])
  .padding(0.45);

// Vertical gridlines — idiomatic D3 data join
g.selectAll(".grid")
  .data(x.ticks(6))
  .join("line")
  .attr("class", "grid")
  .attr("x1", d => x(d)).attr("x2", d => x(d))
  .attr("y1", 0).attr("y2", ih)
  .attr("stroke", t.grid)
  .attr("stroke-width", 1);

// Axes
const xAxisG = g.append("g").attr("transform", `translate(0,${ih})`).call(
  d3.axisBottom(x).ticks(6).tickFormat(d => `${d}M`)
);
const yAxisG = g.append("g").call(d3.axisLeft(y).tickSize(0).tickPadding(10));

xAxisG.selectAll("text").attr("fill", t.inkSoft).style("font-size", "14px");
xAxisG.selectAll("line").attr("stroke", t.grid);
xAxisG.select(".domain").attr("stroke", t.inkSoft);

// Semi-bold Louvre label for typographic hierarchy (top-ranked entry)
yAxisG.selectAll("text")
  .attr("fill", t.inkSoft)
  .style("font-size", "14px")
  .style("font-weight", d => d === "Louvre" ? "600" : "400");
yAxisG.select(".domain").attr("stroke", t.inkSoft);

// Stems
g.selectAll(".stem")
  .data(museums)
  .join("line")
  .attr("class", "stem")
  .attr("x1", 0)
  .attr("x2", d => x(d.visitors))
  .attr("y1", d => y(d.name) + y.bandwidth() / 2)
  .attr("y2", d => y(d.name) + y.bandwidth() / 2)
  .attr("stroke", t.palette[0])
  .attr("stroke-width", 2.5)
  .attr("stroke-opacity", 0.65);

// Dots — Louvre at r=13 (vs r=10) signals its outlier status
g.selectAll(".dot")
  .data(museums)
  .join("circle")
  .attr("class", "dot")
  .attr("cx", d => x(d.visitors))
  .attr("cy", d => y(d.name) + y.bandwidth() / 2)
  .attr("r", d => d.name === "Louvre" ? 13 : 10)
  .attr("fill", t.palette[0])
  .attr("stroke", t.pageBg)
  .attr("stroke-width", 2.5);

// Value labels — 14px to meet the floor; Louvre label semi-bold
g.selectAll(".val")
  .data(museums)
  .join("text")
  .attr("class", "val")
  .attr("x", d => x(d.visitors) + 18)
  .attr("y", d => y(d.name) + y.bandwidth() / 2)
  .attr("dy", "0.35em")
  .attr("fill", t.inkSoft)
  .style("font-size", "14px")
  .style("font-weight", d => d.name === "Louvre" ? "600" : "400")
  .text(d => `${d.visitors}M`);

// Focal-point annotation on the Louvre outlier
const louvre = museums[museums.length - 1];
g.append("text")
  .attr("x", x(louvre.visitors) + 18)
  .attr("y", y(louvre.name) + y.bandwidth() / 2 - 22)
  .attr("fill", t.palette[0])
  .style("font-size", "12px")
  .style("font-style", "italic")
  .text("world's most-visited");

// X-axis label
g.append("text")
  .attr("x", iw / 2)
  .attr("y", ih + 55)
  .attr("text-anchor", "middle")
  .attr("fill", t.inkSoft)
  .style("font-size", "14px")
  .text("Annual Visitors (millions, 2019)");

// Title
svg.append("text")
  .attr("x", width / 2)
  .attr("y", 48)
  .attr("text-anchor", "middle")
  .attr("fill", t.ink)
  .style("font-size", "22px")
  .style("font-weight", "600")
  .text("lollipop-basic · javascript · d3 · anyplot.ai");
Runnable source as JSON, for any HTTP client: https://api.anyplot.ai/specs/lollipop-basic/d3/code. Any spec id and library id listed in llms-full.txt fit the same URL shape; every URL below is complete and callable.
{
  "spec_id": "lollipop-basic",
  "language": "javascript",
  "library": "d3",
  "page": "https://anyplot.ai/lollipop-basic/javascript/d3",
  "hub": "https://anyplot.ai/lollipop-basic",
  "code_json": "https://api.anyplot.ai/specs/lollipop-basic/d3/code",
  "spec_json": "https://api.anyplot.ai/specs/lollipop-basic",
  "render_light_png": "https://storage.googleapis.com/anyplot-images/plots/lollipop-basic/javascript/d3/plot-light.png",
  "render_dark_png": "https://storage.googleapis.com/anyplot-images/plots/lollipop-basic/javascript/d3/plot-dark.png",
  "interactive_light_html": "https://storage.googleapis.com/anyplot-images/plots/lollipop-basic/javascript/d3/plot-light.html",
  "interactive_dark_html": "https://storage.googleapis.com/anyplot-images/plots/lollipop-basic/javascript/d3/plot-dark.html",
  "quality_score": 91.0,
  "license": "MIT",
  "guide": "https://anyplot.ai/llms.txt"
}
Part of Basic Lollipop Chart on anyplot.ai.