The same plot in 14 other libraries — JavaScript: Chart.js, D3.js, Apache ECharts, Highcharts; Python: Altair, Bokeh, lets-plot, Matplotlib, Plotly, plotnine, Pygal, Seaborn; R: ggplot2; Julia: Makie.jl. Compare all 15 side by side: Basic Lollipop Chart in Python, R, Julia and JavaScript.
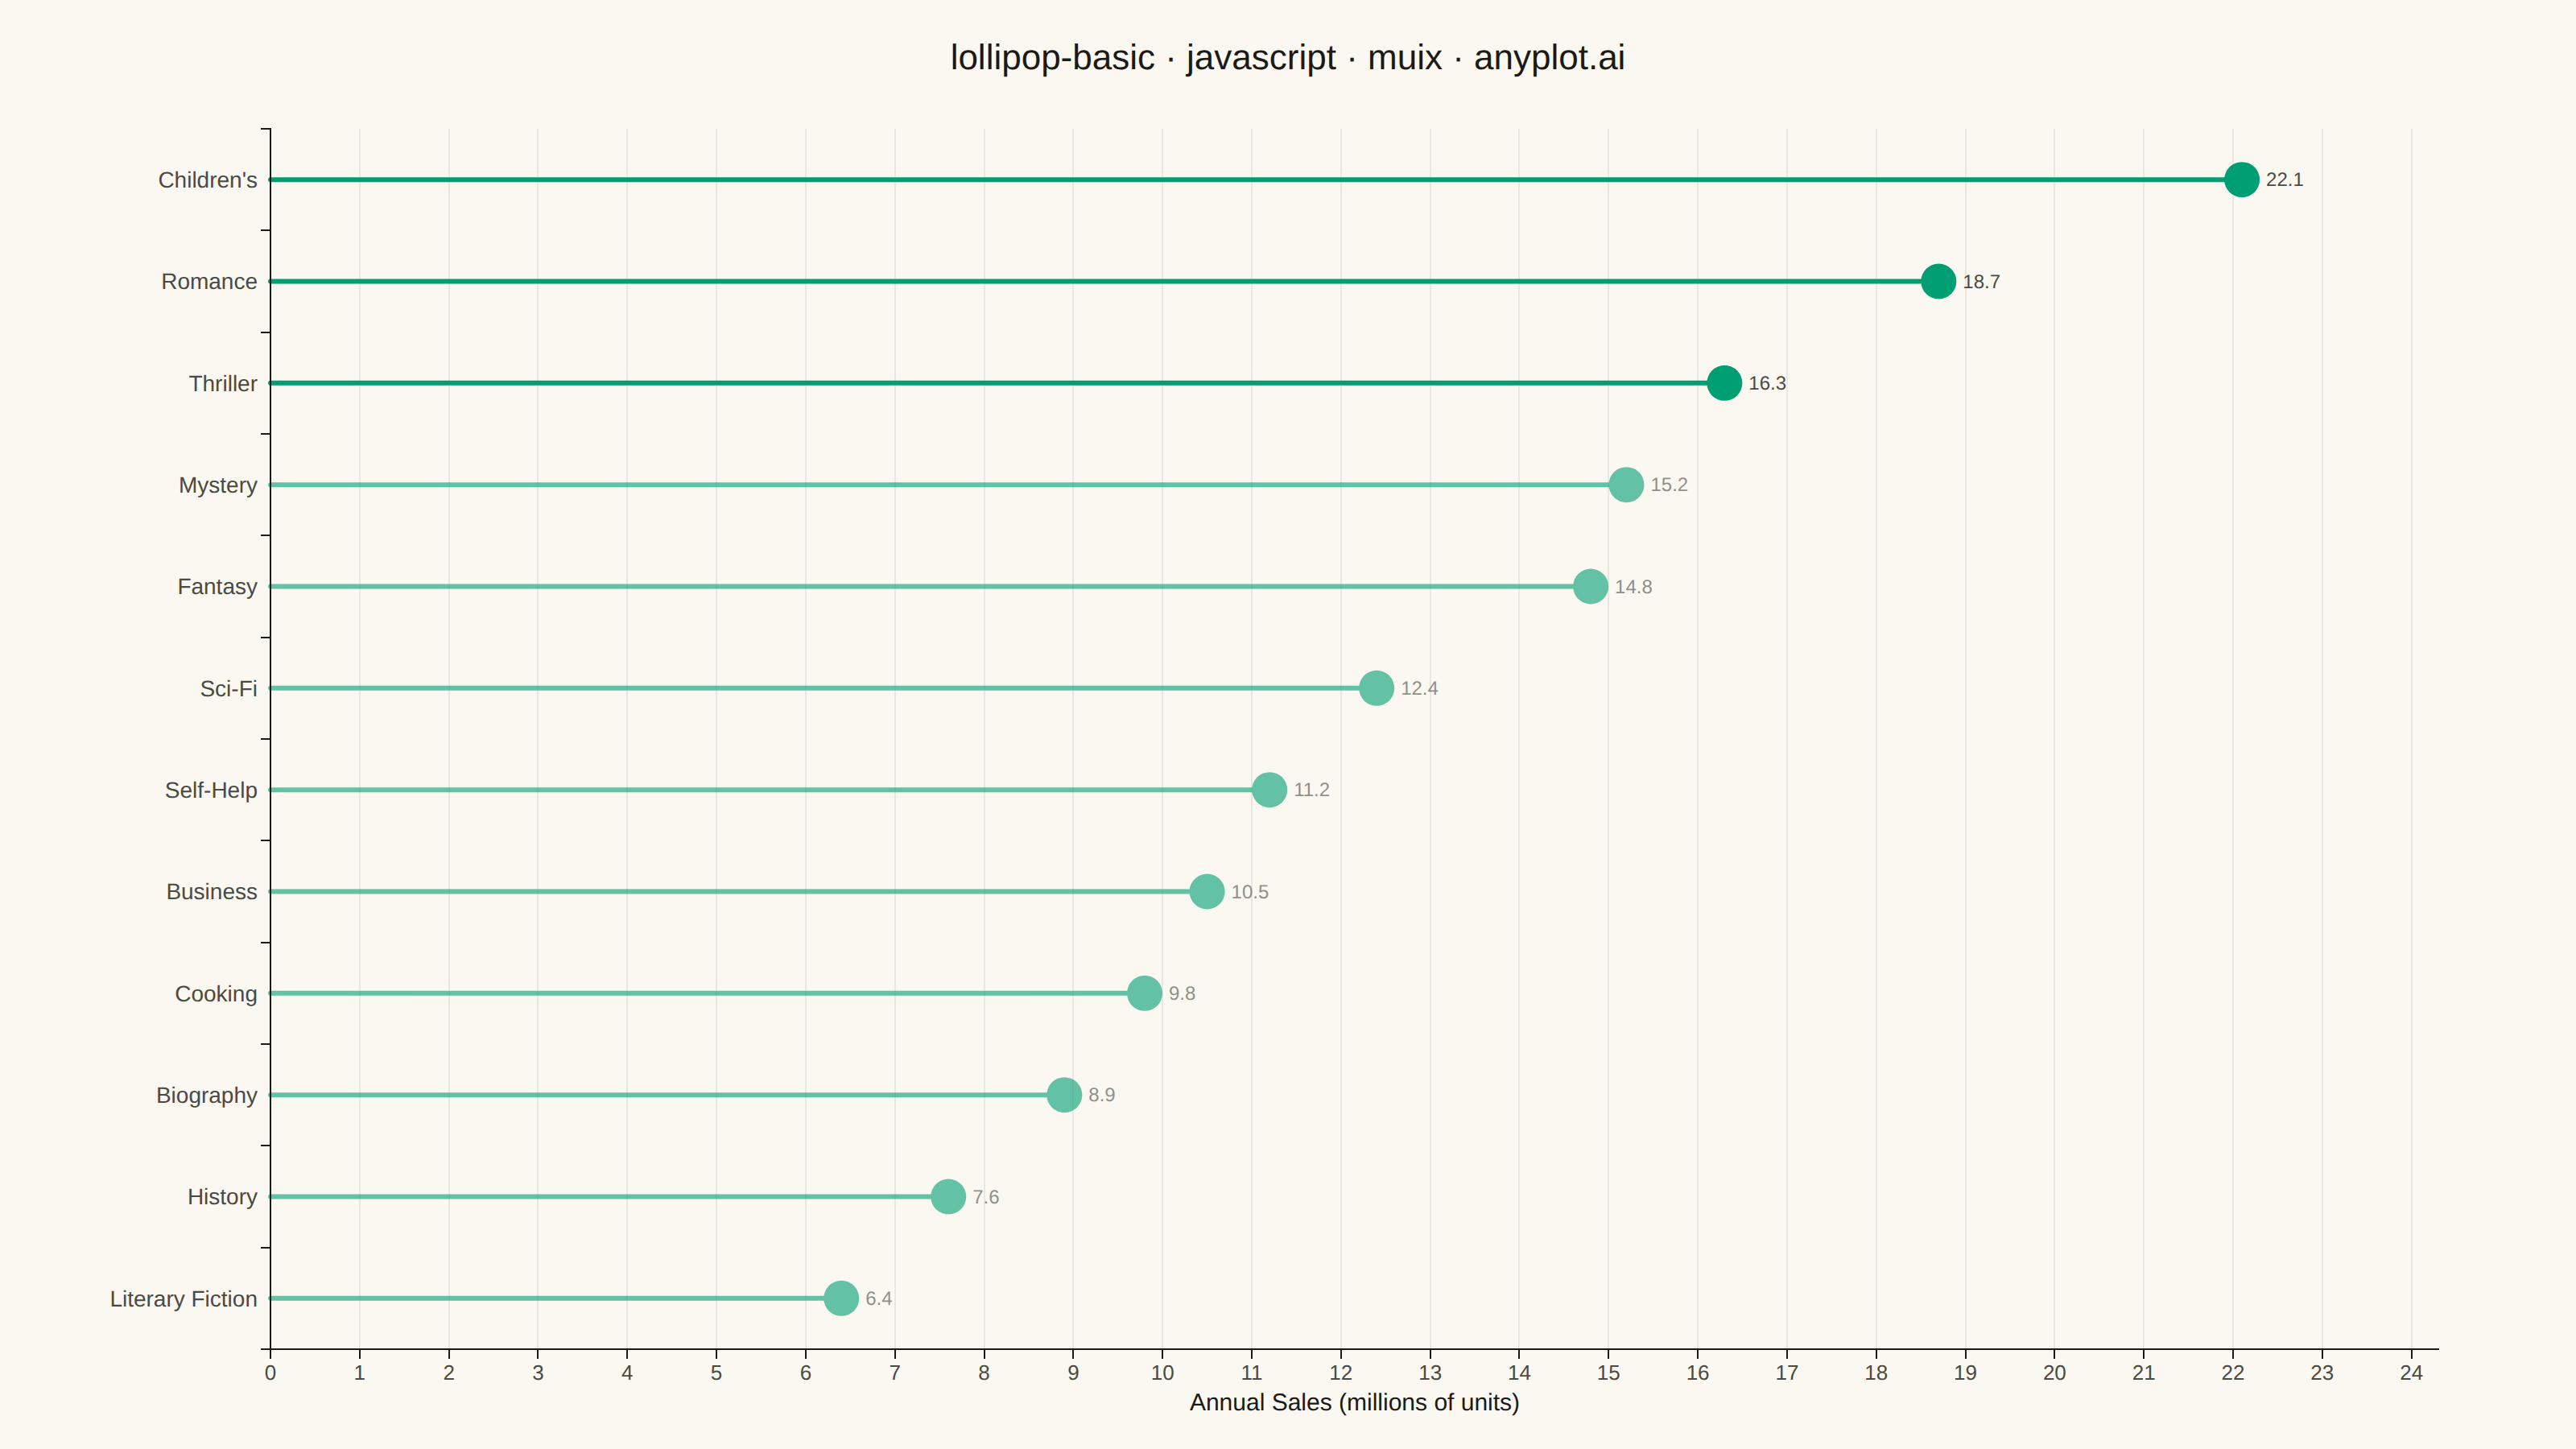
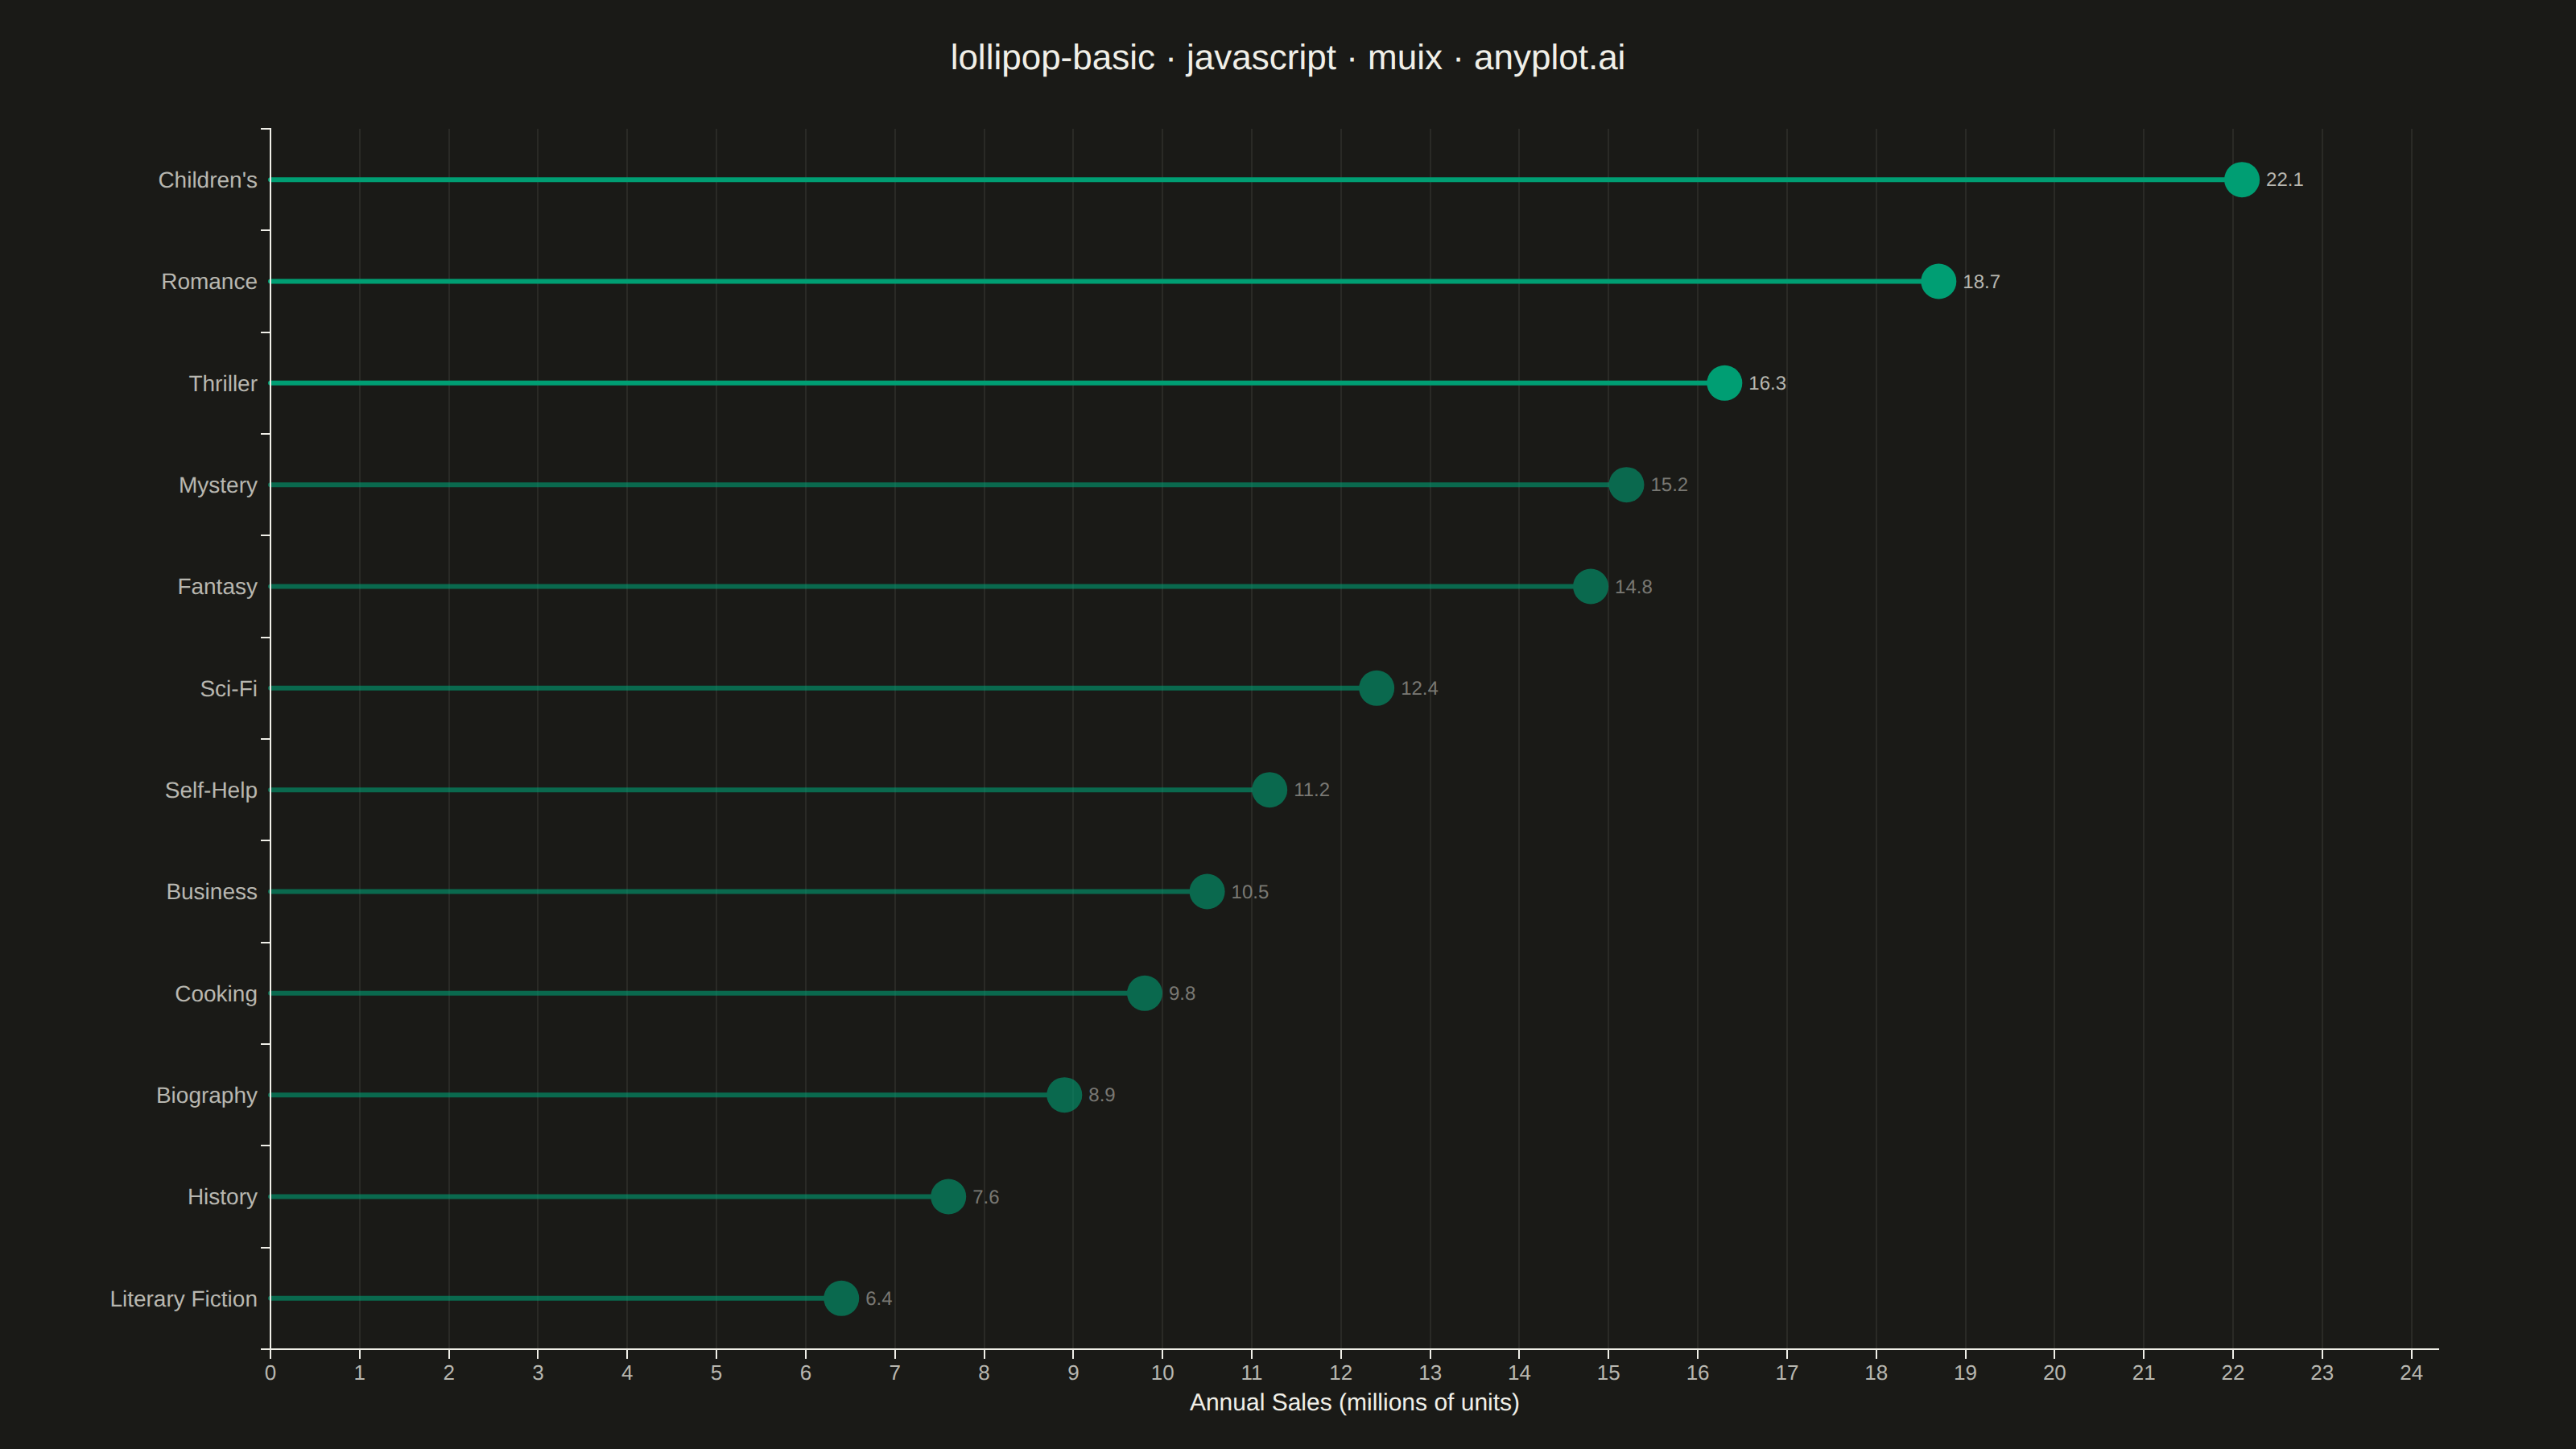
A lollipop chart displays categorical data with thin lines (stems) extending from a baseline to circular markers (dots) at each data point. It presents the same information as a bar chart but with a cleaner, more minimalist aesthetic that reduces visual clutter while maintaining clear value comparisons.
// anyplot.ai
// lollipop-basic: Basic Lollipop Chart
// Library: muix 7.29.1 | JavaScript 22.23.0
// Quality: 90/100 | Created: 2026-07-01
//# anyplot-orientation: landscape
// anyplot.ai
// lollipop-basic: Basic Lollipop Chart
// Library: MUI X Charts | React | Node 22
// License: @mui/x-charts — MIT (community). Pro/Premium are out of scope.
// Quality: pending | Created: 2026-07-01

import { ChartContainer } from "@mui/x-charts/ChartContainer";
import { ChartsXAxis } from "@mui/x-charts/ChartsXAxis";
import { ChartsYAxis } from "@mui/x-charts/ChartsYAxis";
import { ChartsGrid } from "@mui/x-charts/ChartsGrid";
import { useXScale, useYScale } from "@mui/x-charts";
import Box from "@mui/material/Box";
import Typography from "@mui/material/Typography";

const t = window.ANYPLOT_TOKENS;

// Annual book sales by genre (millions of units), sorted highest to lowest
const genres = [
  "Children's",
  "Romance",
  "Thriller",
  "Mystery",
  "Fantasy",
  "Sci-Fi",
  "Self-Help",
  "Business",
  "Cooking",
  "Biography",
  "History",
  "Literary Fiction",
];
const salesData = [22.1, 18.7, 16.3, 15.2, 14.8, 12.4, 11.2, 10.5, 9.8, 8.9, 7.6, 6.4];
const MAX_VAL = Math.max(...salesData);

// Must be rendered inside ChartContainer to access its scale context
function LollipopPlot() {
  const xScale = useXScale();
  const yScale = useYScale();

  // Wait until band scale is fully resolved
  if (!xScale || !yScale || typeof yScale.bandwidth !== "function") return null;

  return (
    <g>
      {salesData.map((val, i) => {
        const genre = genres[i];
        const x0 = +xScale(0);
        const x1 = +xScale(val);
        const bandTop = yScale(genre);
        if (bandTop == null || !isFinite(+bandTop)) return null;
        const cy = +bandTop + yScale.bandwidth() / 2;

        // Highlight top 3 genres; de-emphasise the rest for visual hierarchy
        const opacity = i < 3 ? 1.0 : 0.6;

        return (
          <g key={genre} opacity={opacity}>
            <line
              x1={x0} y1={cy}
              x2={x1} y2={cy}
              stroke={t.palette[0]}
              strokeWidth={3}
              strokeLinecap="round"
            />
            <circle cx={x1} cy={cy} r={11} fill={t.palette[0]} />
            <text
              x={x1 + 15}
              y={cy + 4}
              fill={t.inkSoft}
              fontSize={12}
              fontFamily="sans-serif"
            >
              {val.toFixed(1)}
            </text>
          </g>
        );
      })}
    </g>
  );
}

const TITLE = "lollipop-basic · javascript · muix · anyplot.ai";
const TITLE_HEIGHT = 70;
const MARGIN = { top: 10, right: 85, bottom: 62, left: 168 };

export default function Chart() {
  const chartWidth = window.ANYPLOT_SIZE.width;
  const chartHeight = window.ANYPLOT_SIZE.height - TITLE_HEIGHT;

  return (
    <Box
      sx={{
        width: chartWidth,
        height: window.ANYPLOT_SIZE.height,
        display: "flex",
        flexDirection: "column",
      }}
    >
      <Box
        sx={{
          height: TITLE_HEIGHT,
          display: "flex",
          alignItems: "center",
          justifyContent: "center",
          flexShrink: 0,
        }}
      >
        <Typography sx={{ color: t.ink, fontSize: 22, fontWeight: 500 }}>
          {TITLE}
        </Typography>
      </Box>

      <ChartContainer
        skipAnimation
        width={chartWidth}
        height={chartHeight}
        margin={MARGIN}
        series={[{
          type: "bar",
          data: salesData,
          layout: "horizontal",
        }]}
        xAxis={[{
          scaleType: "linear",
          min: 0,
          max: MAX_VAL * 1.1,
          label: "Annual Sales (millions of units)",
          labelStyle: { fontSize: 15, fill: t.ink },
          tickLabelStyle: { fontSize: 13, fill: t.inkSoft },
        }]}
        yAxis={[{
          scaleType: "band",
          data: genres,
          tickLabelStyle: { fontSize: 14, fill: t.inkSoft },
        }]}
        sx={{
          "& .MuiChartsGrid-line": { stroke: t.grid, strokeOpacity: 0.5 },
        }}
      >
        <ChartsGrid vertical />
        <LollipopPlot />
        <ChartsYAxis />
        <ChartsXAxis />
      </ChartContainer>
    </Box>
  );
}
Runnable source as JSON, for any HTTP client: https://api.anyplot.ai/specs/lollipop-basic/muix/code. Any spec id and library id listed in llms-full.txt fit the same URL shape; every URL below is complete and callable.
{
  "spec_id": "lollipop-basic",
  "language": "javascript",
  "library": "muix",
  "page": "https://anyplot.ai/lollipop-basic/javascript/muix",
  "hub": "https://anyplot.ai/lollipop-basic",
  "code_json": "https://api.anyplot.ai/specs/lollipop-basic/muix/code",
  "spec_json": "https://api.anyplot.ai/specs/lollipop-basic",
  "render_light_png": "https://storage.googleapis.com/anyplot-images/plots/lollipop-basic/javascript/muix/plot-light.png",
  "render_dark_png": "https://storage.googleapis.com/anyplot-images/plots/lollipop-basic/javascript/muix/plot-dark.png",
  "interactive_light_html": "https://storage.googleapis.com/anyplot-images/plots/lollipop-basic/javascript/muix/plot-light.html",
  "interactive_dark_html": "https://storage.googleapis.com/anyplot-images/plots/lollipop-basic/javascript/muix/plot-dark.html",
  "quality_score": 90.0,
  "license": "MIT",
  "guide": "https://anyplot.ai/llms.txt"
}
Part of Basic Lollipop Chart on anyplot.ai.