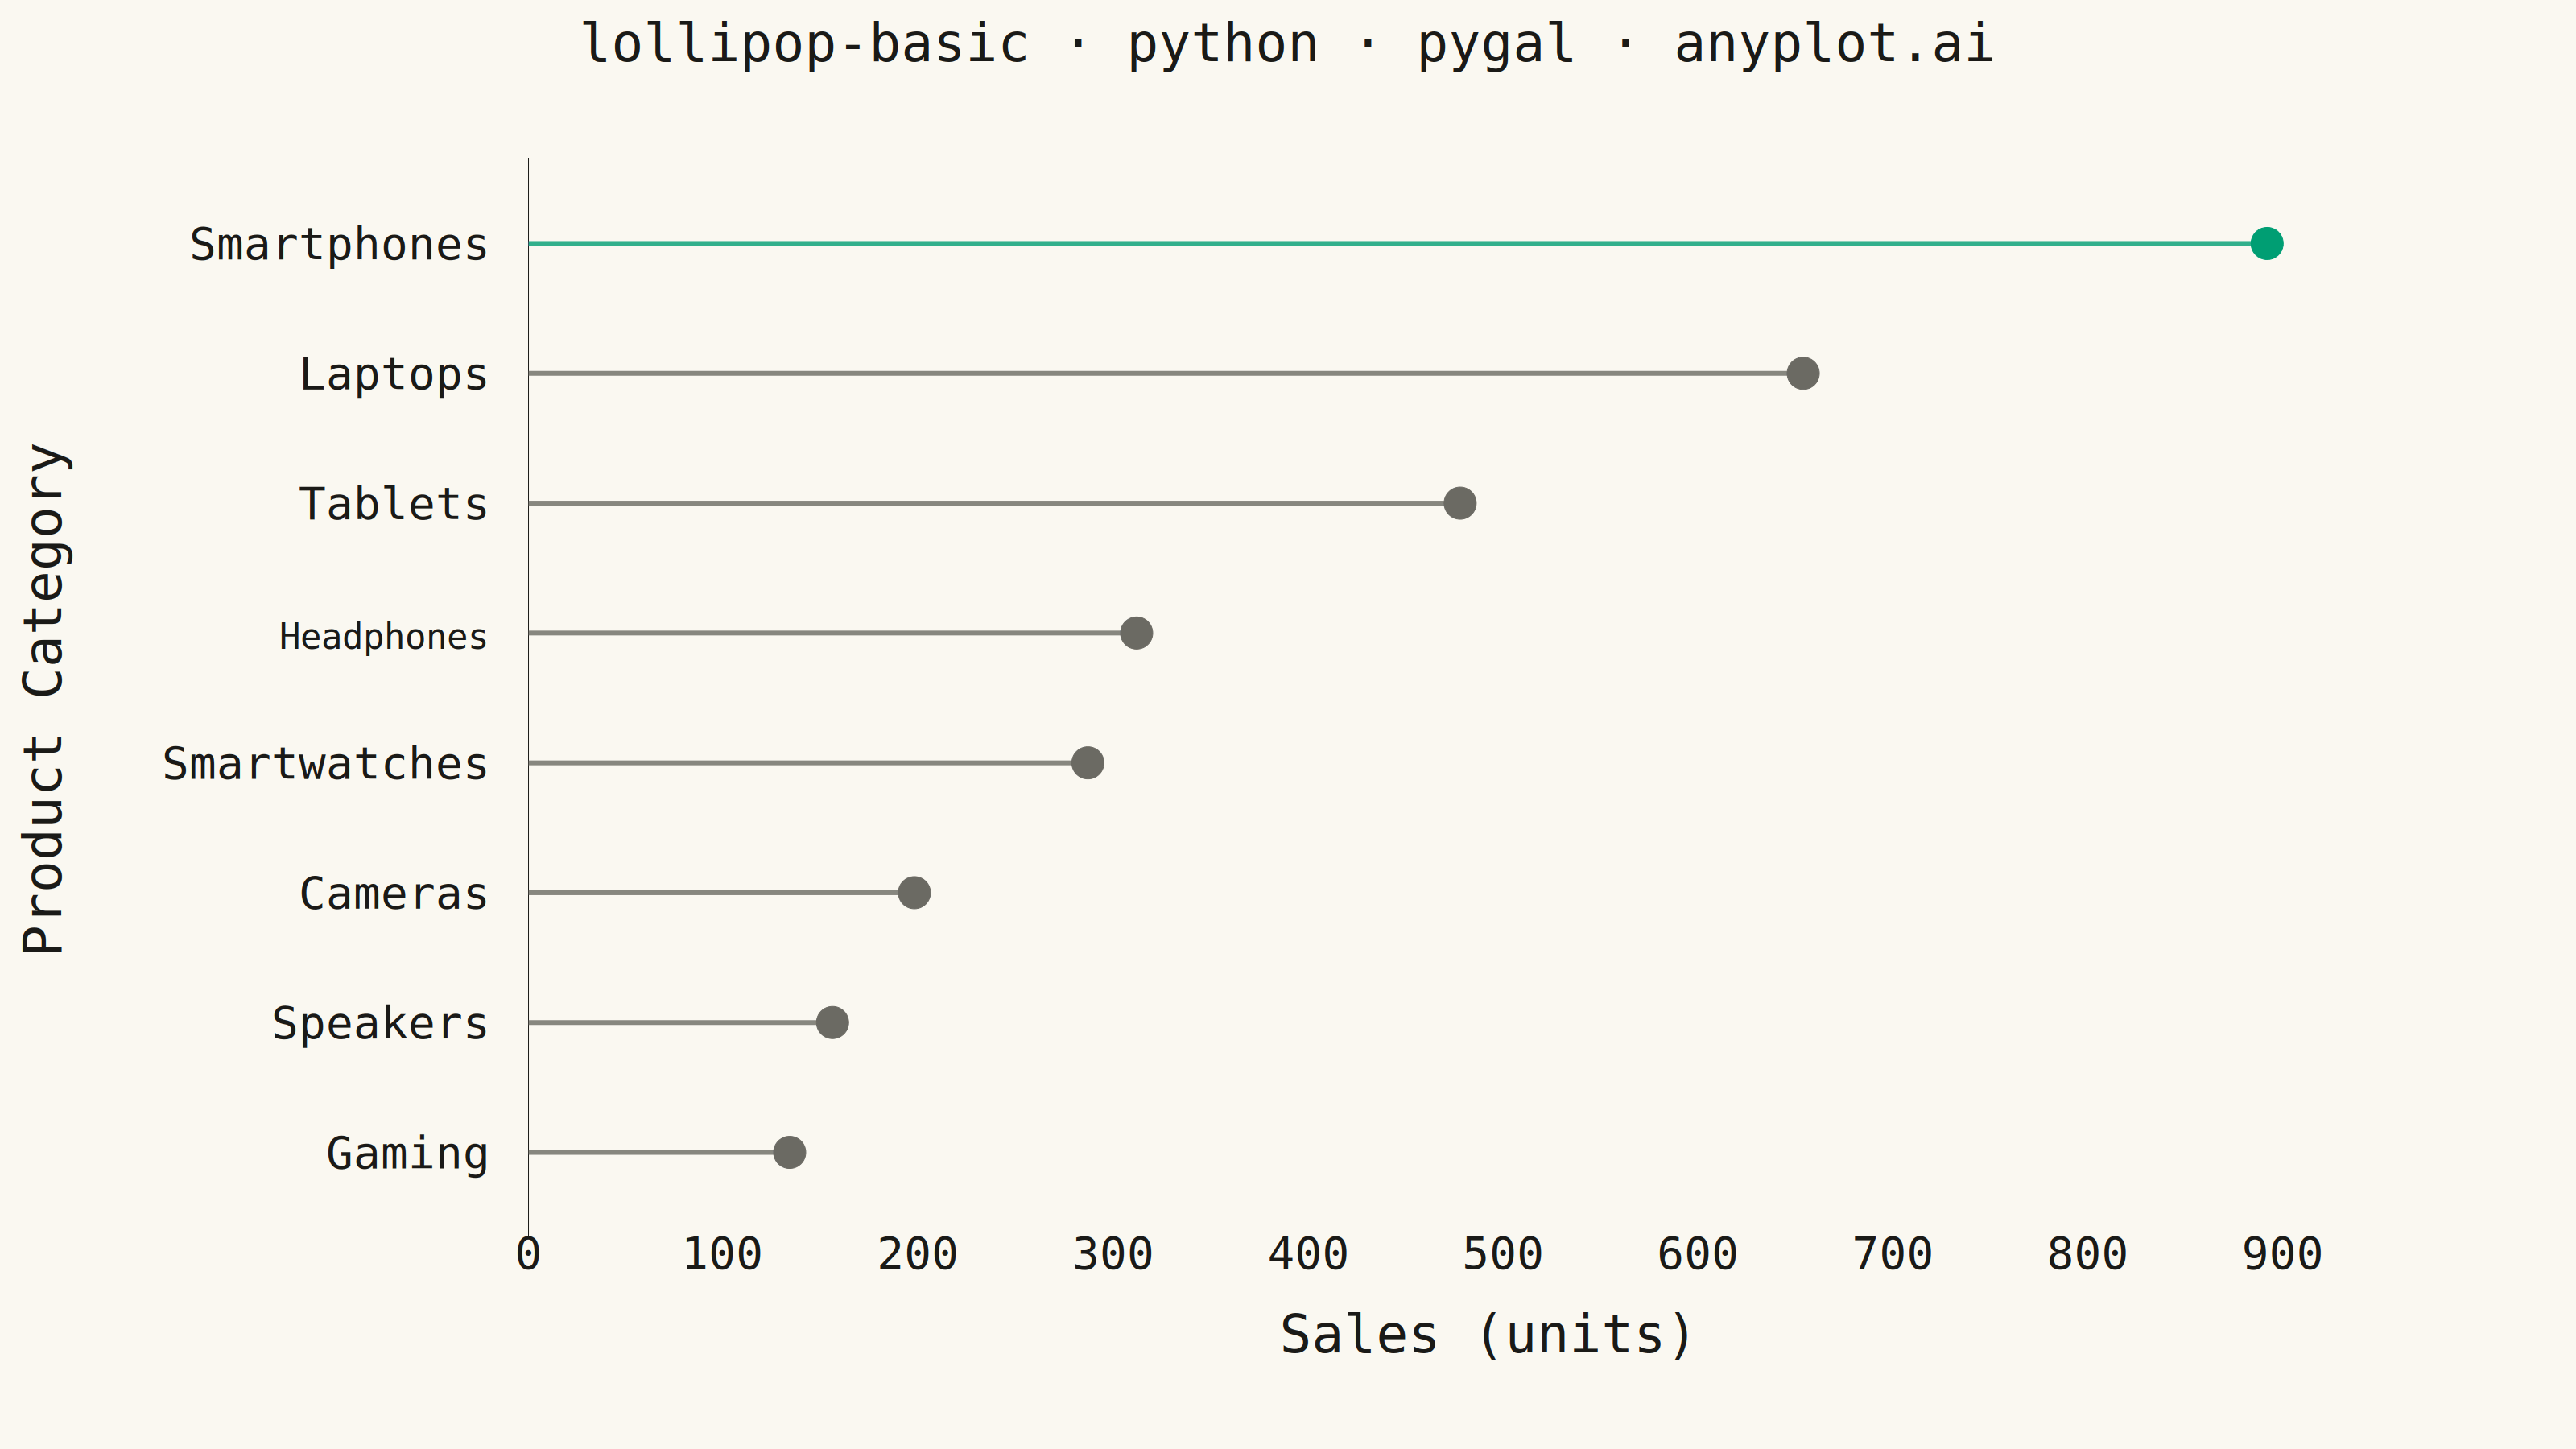
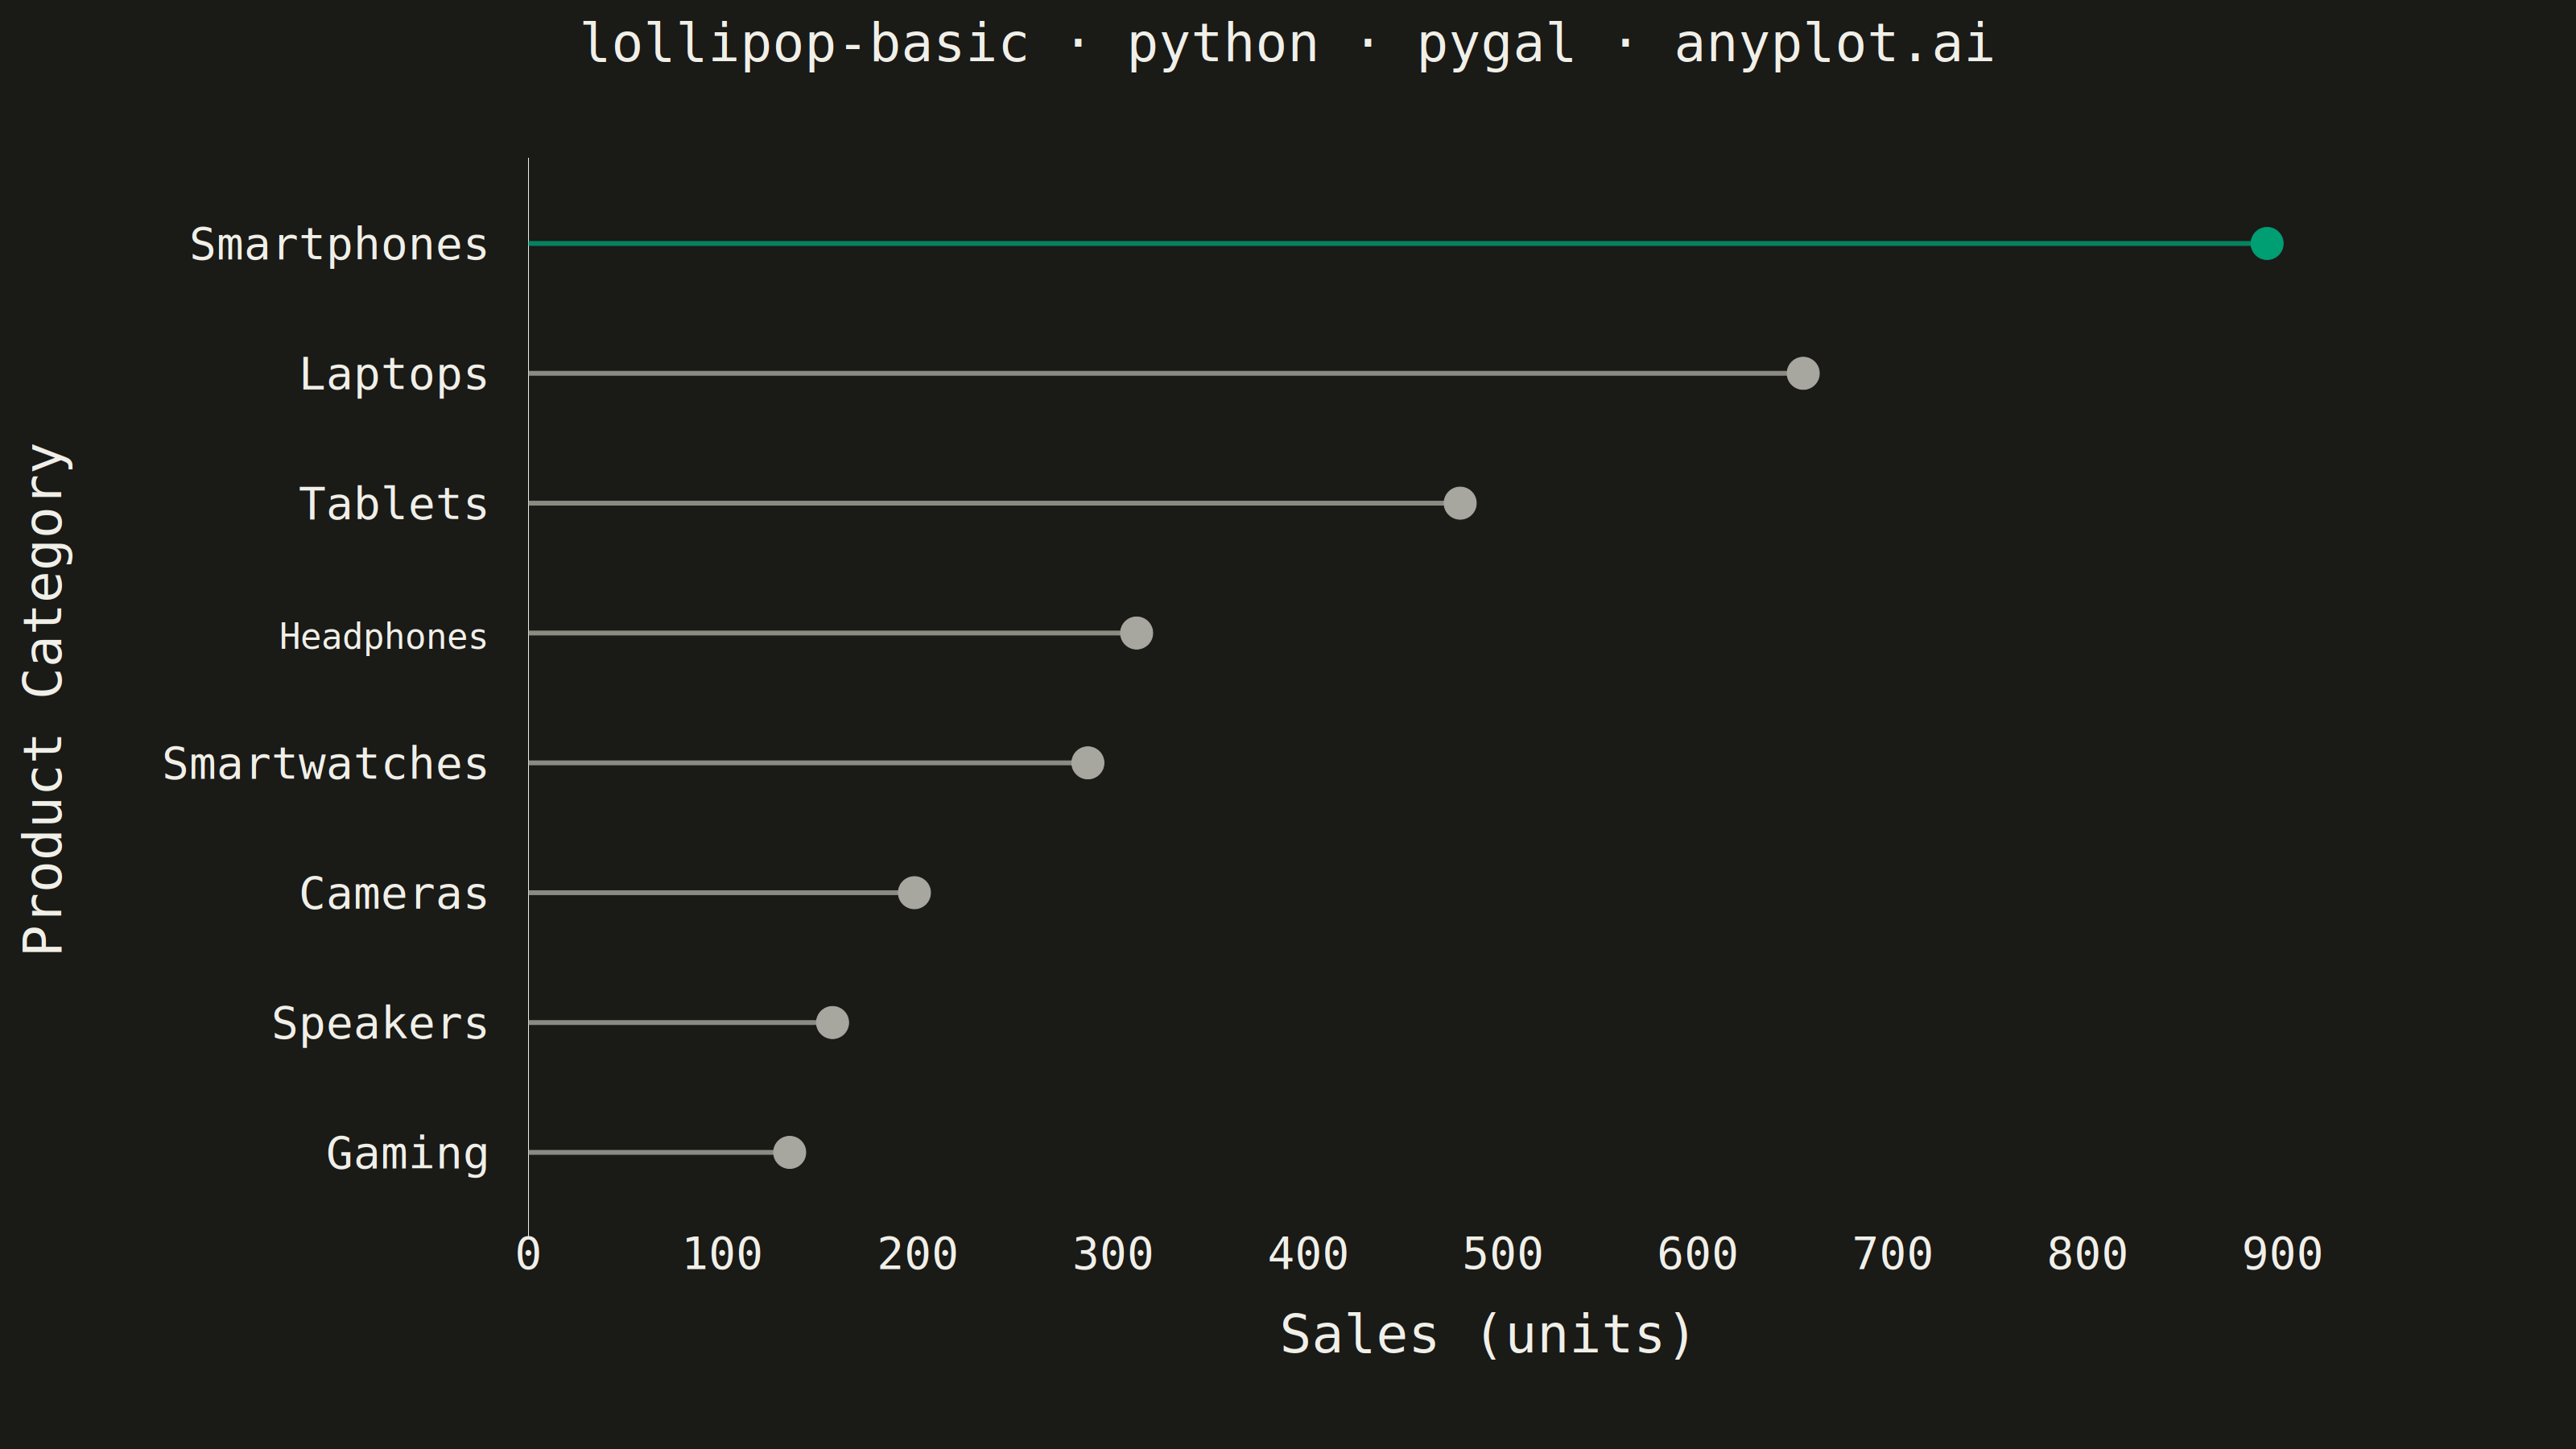
A lollipop chart displays categorical data with thin lines (stems) extending from a baseline to circular markers (dots) at each data point. It presents the same information as a bar chart but with a cleaner, more minimalist aesthetic that reduces visual clutter while maintaining clear value comparisons.
""" anyplot.ai
lollipop-basic: Basic Lollipop Chart
Library: pygal 3.1.3 | Python 3.13.14
Quality: 90/100 | Updated: 2026-07-01
"""

import os
import sys
from pathlib import Path


# Remove script directory from path to avoid name collision with pygal package
_script_dir = str(Path(__file__).parent)
sys.path = [p for p in sys.path if p != _script_dir]

import pygal
from pygal.style import Style


# Theme tokens
THEME = os.getenv("ANYPLOT_THEME", "light")
PAGE_BG = "#FAF8F1" if THEME == "light" else "#1A1A17"
INK = "#1A1A17" if THEME == "light" else "#F0EFE8"
INK_MUTED = "#6B6A63" if THEME == "light" else "#A8A79F"

BRAND = "#009E73"  # Imprint palette position 1

# Data — product sales by consumer electronics category (sorted descending)
categories = ["Smartphones", "Laptops", "Tablets", "Headphones", "Smartwatches", "Cameras", "Speakers", "Gaming"]
values = [892, 654, 478, 312, 287, 198, 156, 134]

sorted_data = sorted(zip(categories, values, strict=True), key=lambda x: x[1], reverse=True)
categories = [item[0] for item in sorted_data]
values = [item[1] for item in sorted_data]

n = len(categories)

# Colors — top-ranked item in brand green, rest in Imprint muted anchor for visual hierarchy
colors = (BRAND,) + (INK_MUTED,) * (n - 1)

# Style — theme-adaptive chrome, Imprint palette hierarchy
custom_style = Style(
    background=PAGE_BG,
    plot_background=PAGE_BG,
    foreground=INK,
    foreground_strong=INK,
    foreground_subtle=INK_MUTED,
    colors=colors,
    title_font_size=66,
    label_font_size=56,
    major_label_font_size=44,
    legend_font_size=44,
    value_font_size=36,
    value_label_font_size=36,
    stroke_width=6,
    opacity=1,
    opacity_hover=0.9,
)

# Plot — horizontal lollipop via XY: stem from x=0 to value, baseline node hidden
chart = pygal.XY(
    width=3200,
    height=1800,
    title="lollipop-basic · python · pygal · anyplot.ai",
    x_title="Sales (units)",
    y_title="Product Category",
    style=custom_style,
    show_legend=False,
    dots_size=20,
    stroke=True,
    show_x_guides=False,
    show_y_guides=False,
    margin=120,
    xrange=(0, max(values) * 1.1),
    range=(0.5, n + 0.5),
    y_labels=[{"label": cat, "value": n - i} for i, cat in enumerate(categories)],
)

for i, (cat, val) in enumerate(zip(categories, values, strict=True)):
    y_pos = n - i
    chart.add(cat, [{"value": (0, y_pos), "node": {"r": 0}}, {"value": (val, y_pos)}])

# Save
chart.render_to_png(f"plot-{THEME}.png")
with open(f"plot-{THEME}.html", "wb") as f:
    f.write(chart.render())
Runnable source as JSON, for any HTTP client: https://api.anyplot.ai/specs/lollipop-basic/pygal/code. Any spec id and library id listed in llms-full.txt fit the same URL shape; every URL below is complete and callable.
{
  "spec_id": "lollipop-basic",
  "language": "python",
  "library": "pygal",
  "page": "https://anyplot.ai/lollipop-basic/python/pygal",
  "hub": "https://anyplot.ai/lollipop-basic",
  "code_json": "https://api.anyplot.ai/specs/lollipop-basic/pygal/code",
  "spec_json": "https://api.anyplot.ai/specs/lollipop-basic",
  "render_light_png": "https://storage.googleapis.com/anyplot-images/plots/lollipop-basic/python/pygal/plot-light.png",
  "render_dark_png": "https://storage.googleapis.com/anyplot-images/plots/lollipop-basic/python/pygal/plot-dark.png",
  "interactive_light_html": "https://storage.googleapis.com/anyplot-images/plots/lollipop-basic/python/pygal/plot-light.html",
  "interactive_dark_html": "https://storage.googleapis.com/anyplot-images/plots/lollipop-basic/python/pygal/plot-dark.html",
  "quality_score": 90.0,
  "license": "MIT",
  "guide": "https://anyplot.ai/llms.txt"
}
Part of Basic Lollipop Chart on anyplot.ai.