Source code in 15 libraries — Python: Altair, Bokeh, lets-plot, Matplotlib, Plotly, plotnine, Pygal, Seaborn; R: ggplot2; Julia: Makie.jl; JavaScript: Chart.js, D3.js, Apache ECharts, Highcharts, MUI X Charts.
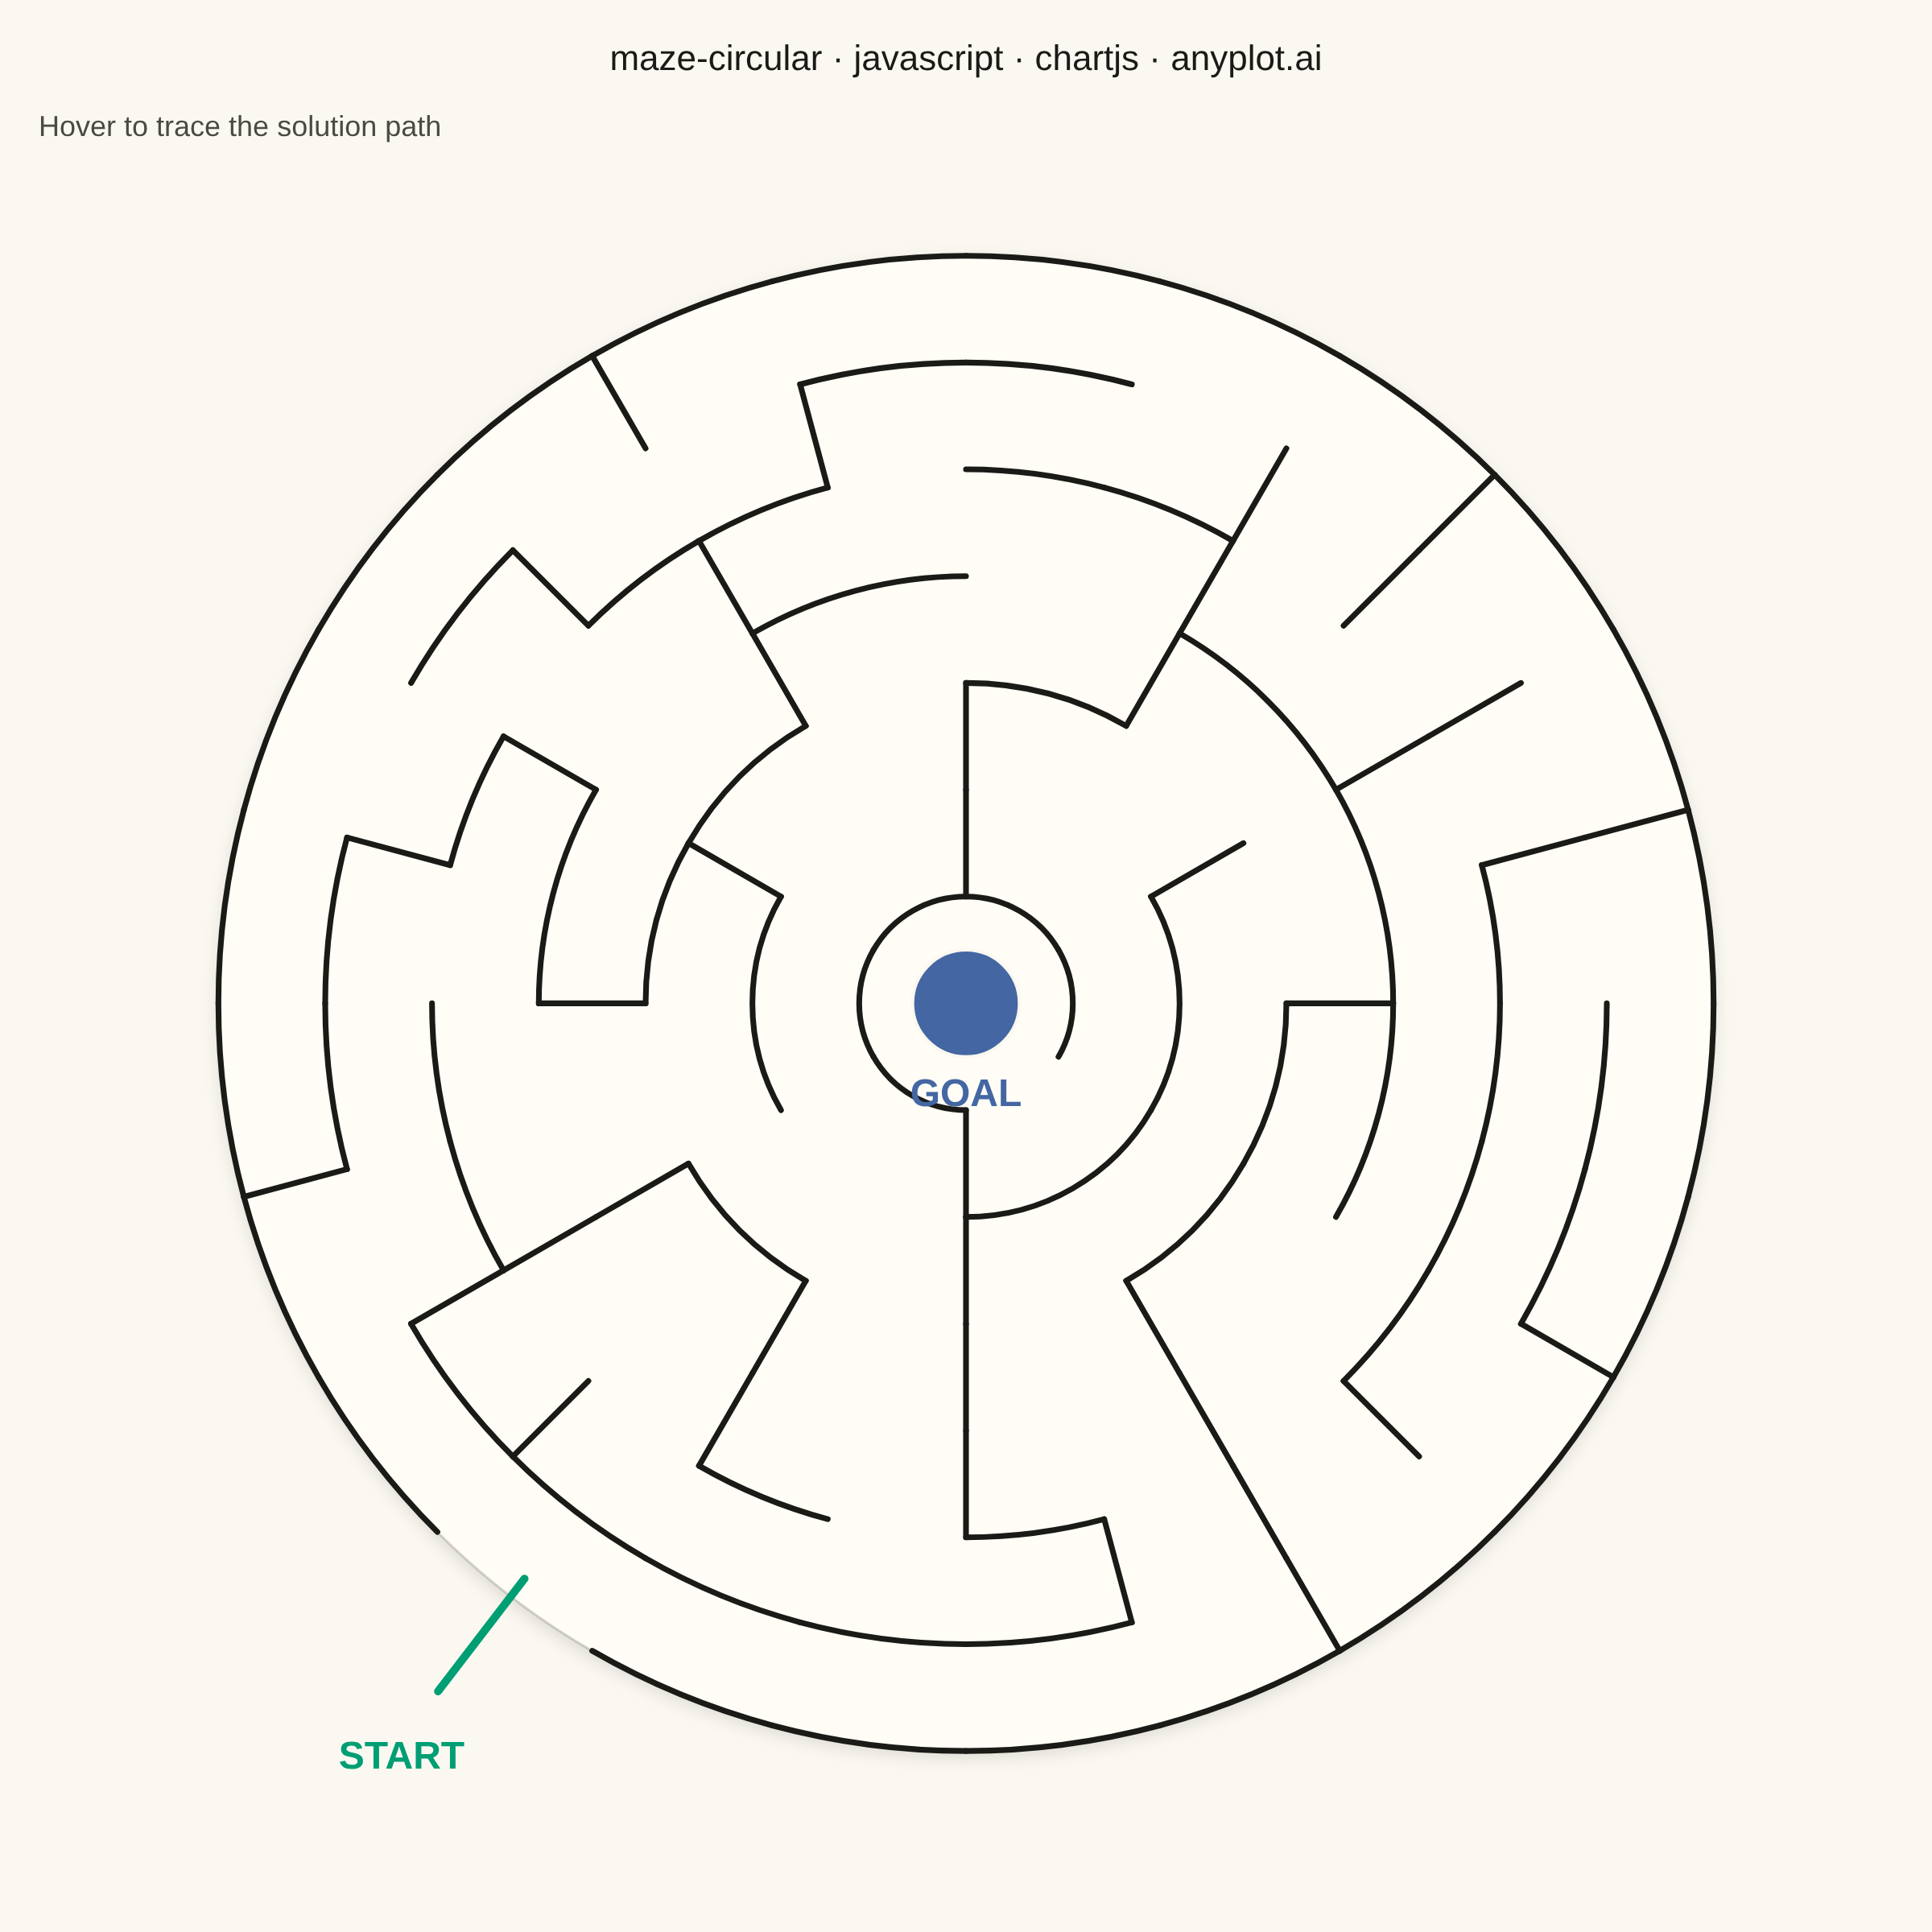
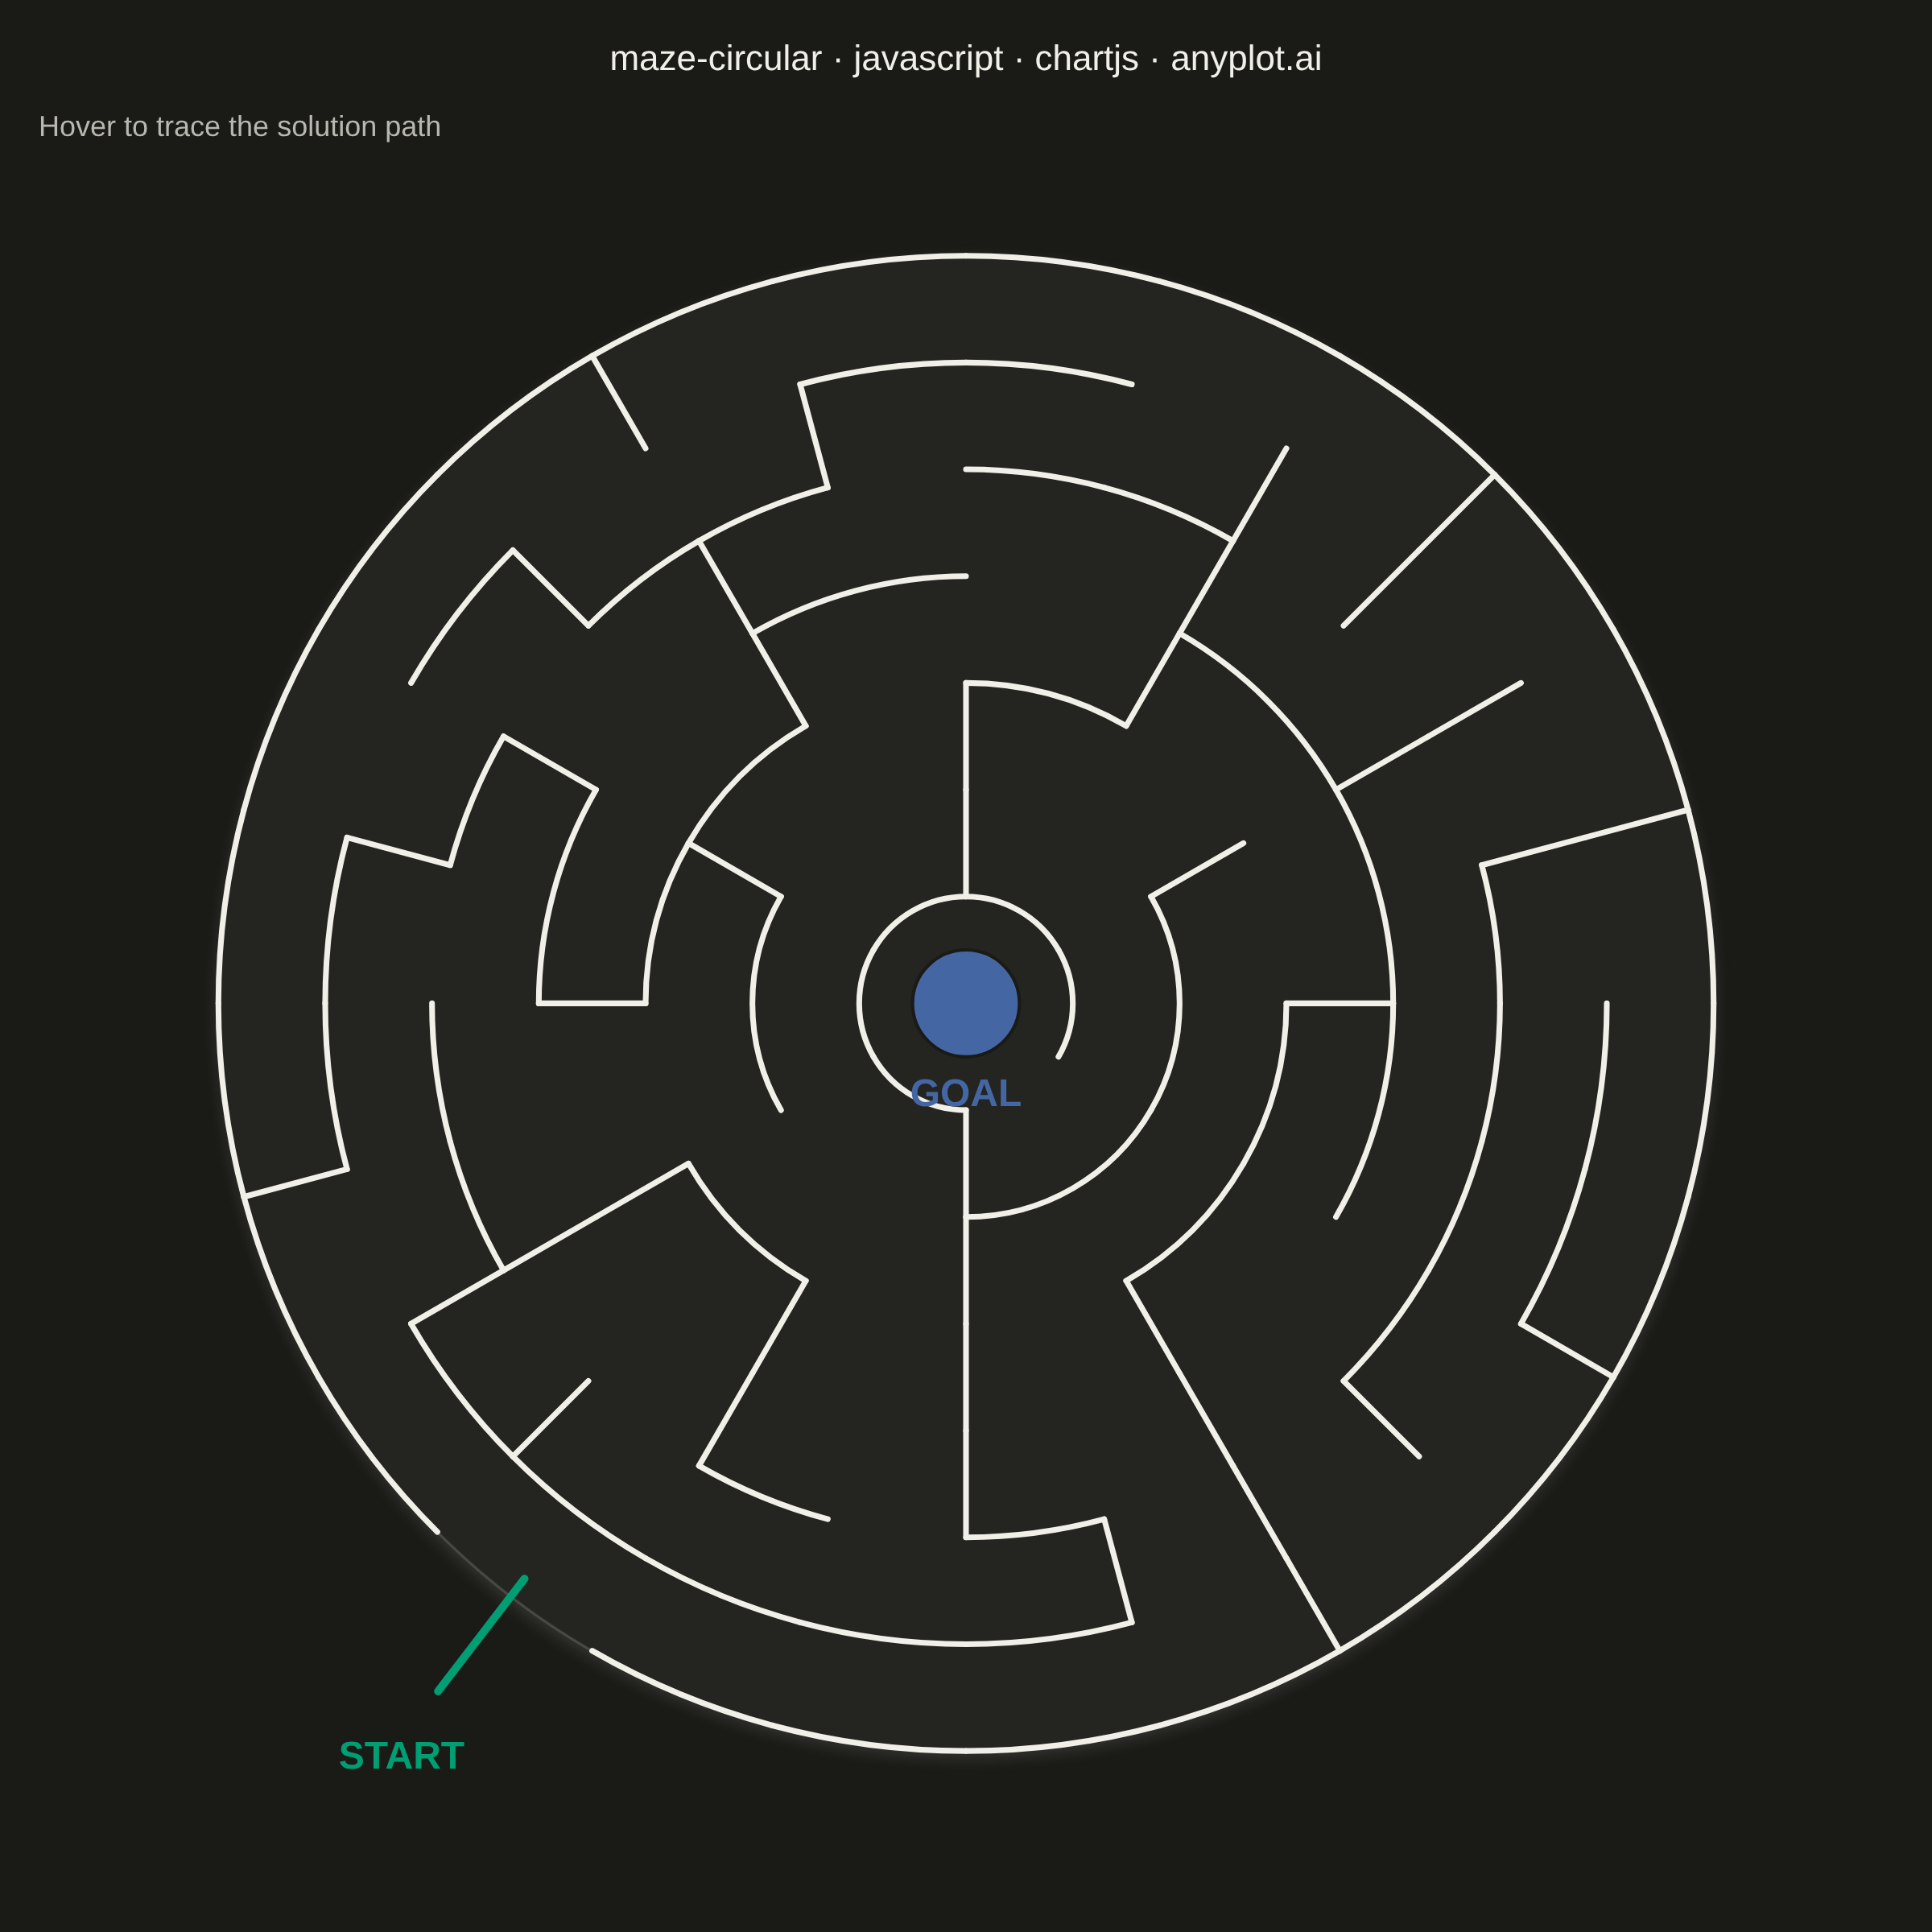
A circular maze puzzle visualization featuring concentric rings connected by radial passages. Unlike rectangular mazes, this design creates a unique solving experience where the player navigates inward through ring-shaped corridors. The maze has an entry point on the outer edge and a goal at the center, with algorithmically generated walls ensuring exactly one solvable path.
Preview render from the Chart.js implementation.