The same plot in 14 other libraries — JavaScript: D3.js, Apache ECharts, Highcharts, MUI X Charts; Python: Altair, Bokeh, lets-plot, Matplotlib, Plotly, plotnine, Pygal, Seaborn; R: ggplot2; Julia: Makie.jl. Compare all 15 side by side: Circular Maze Puzzle in Python, R, Julia and JavaScript.
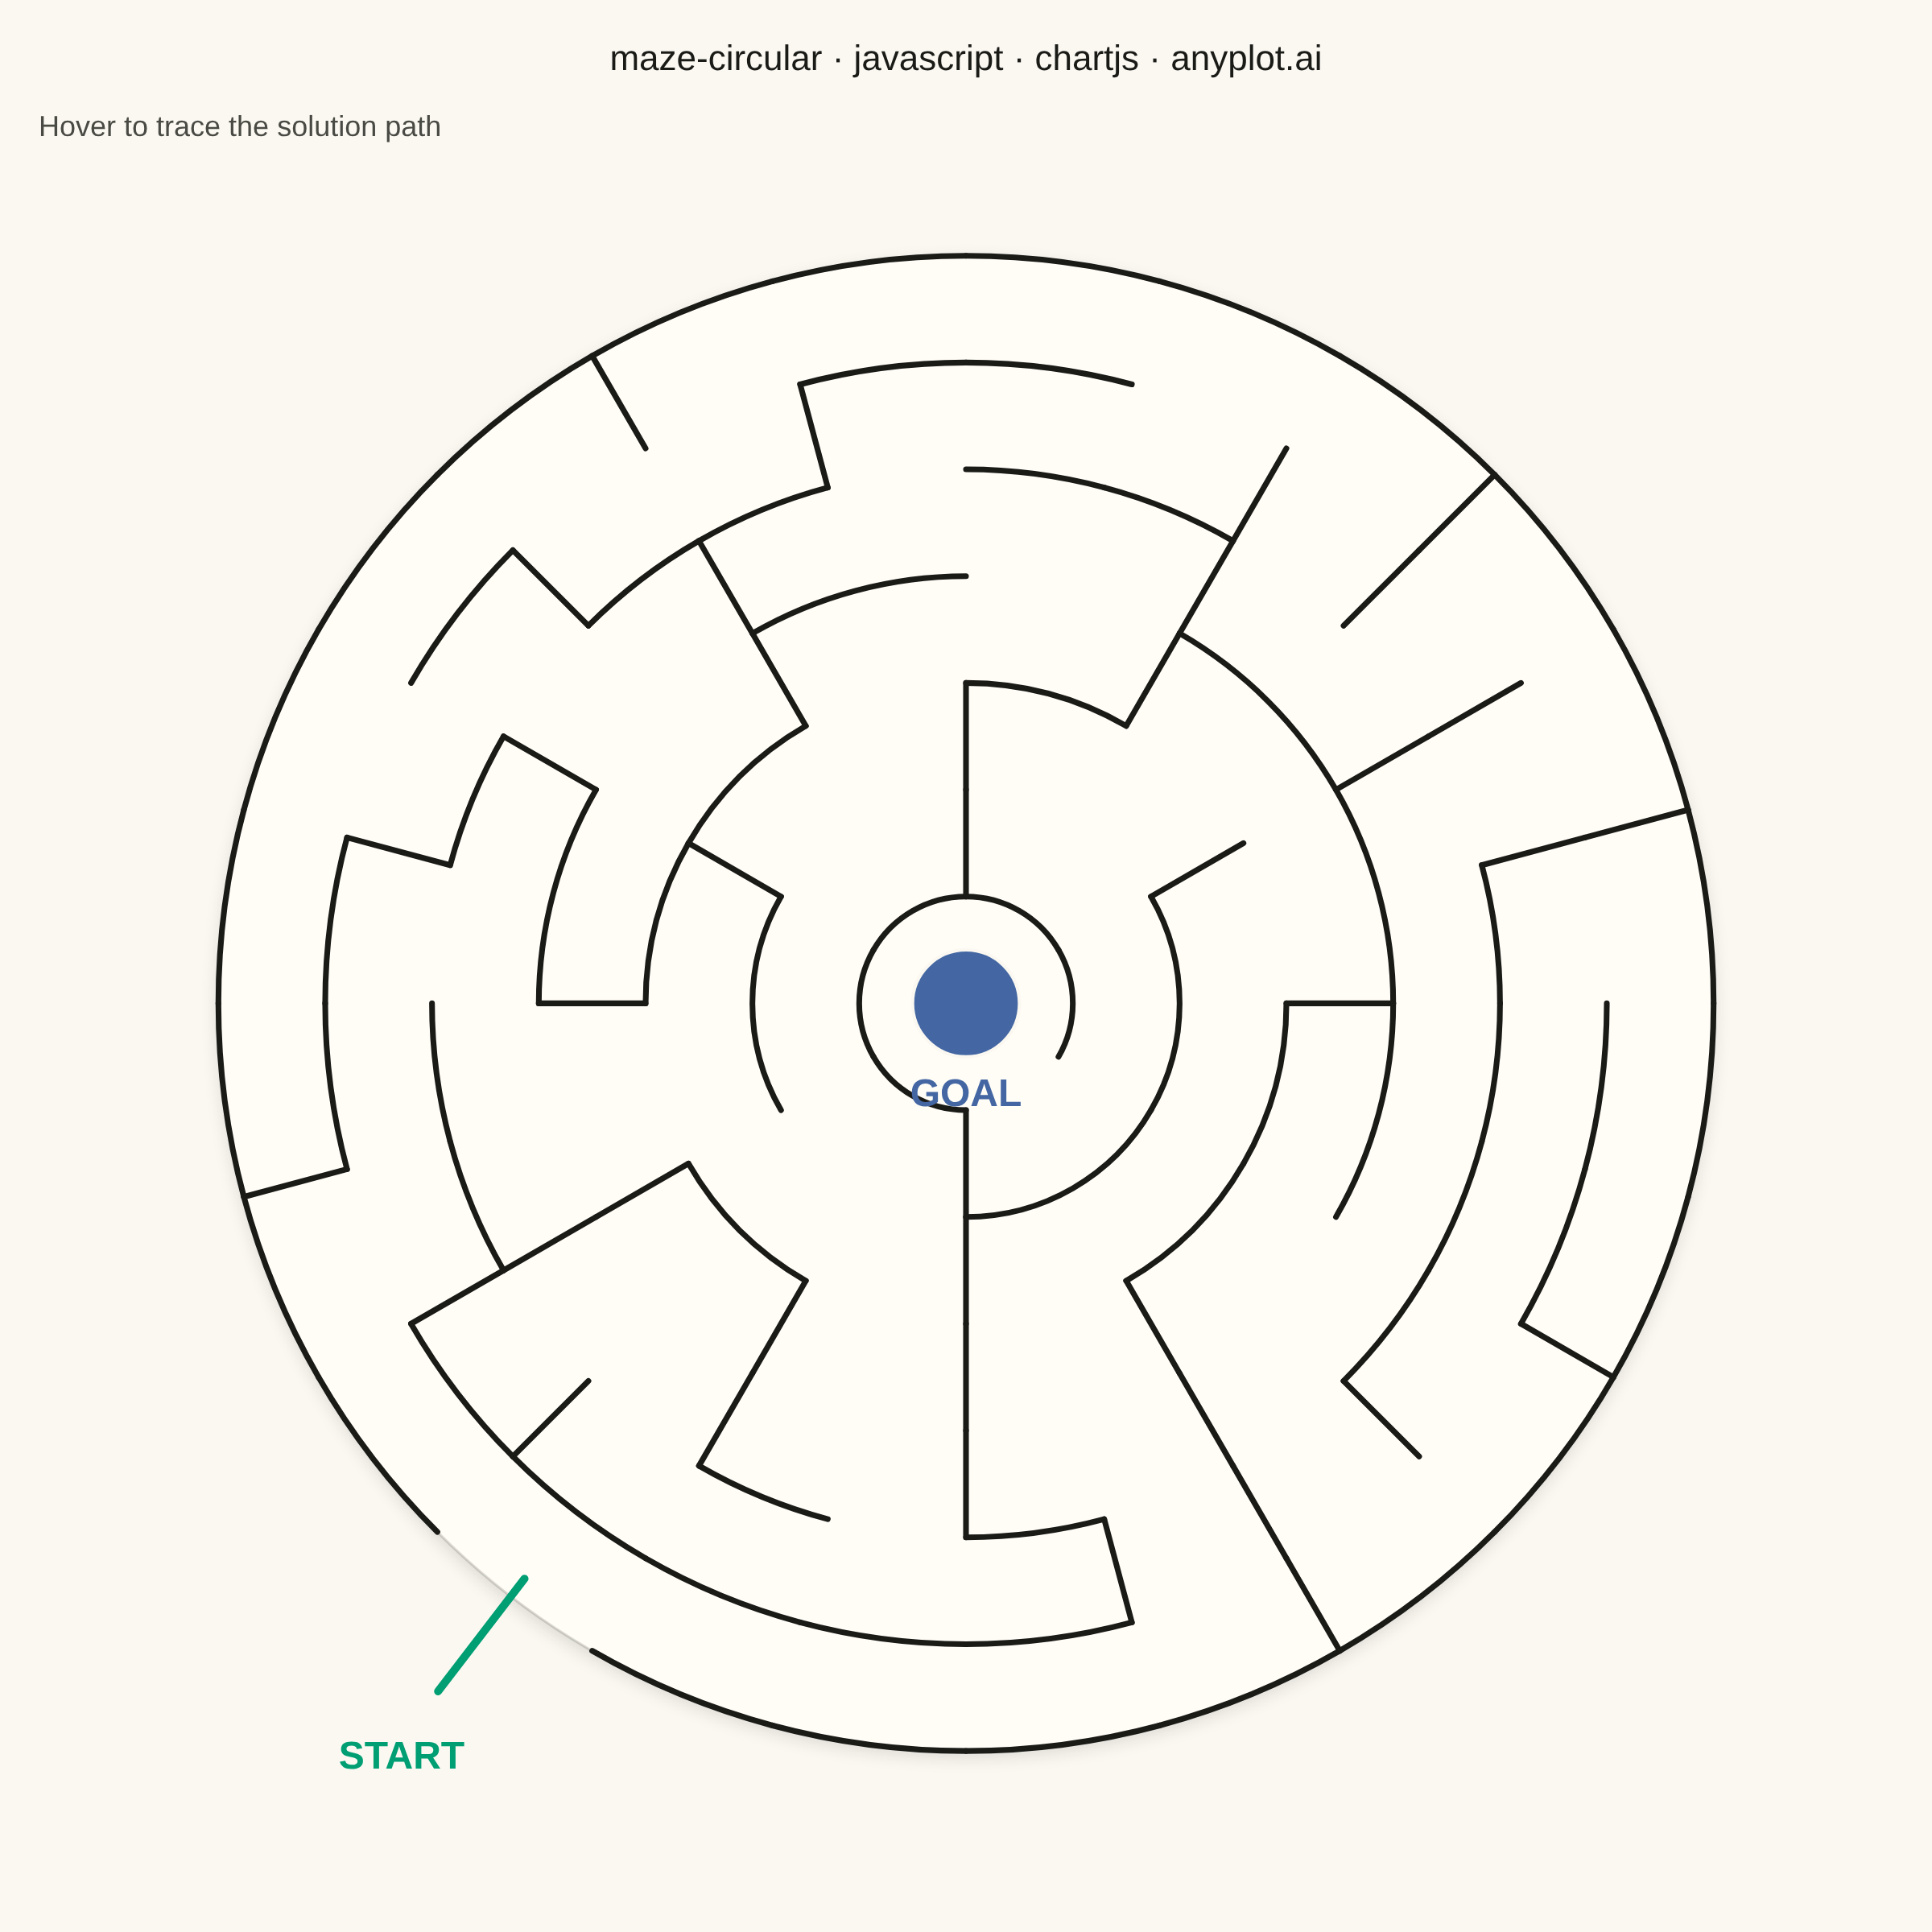
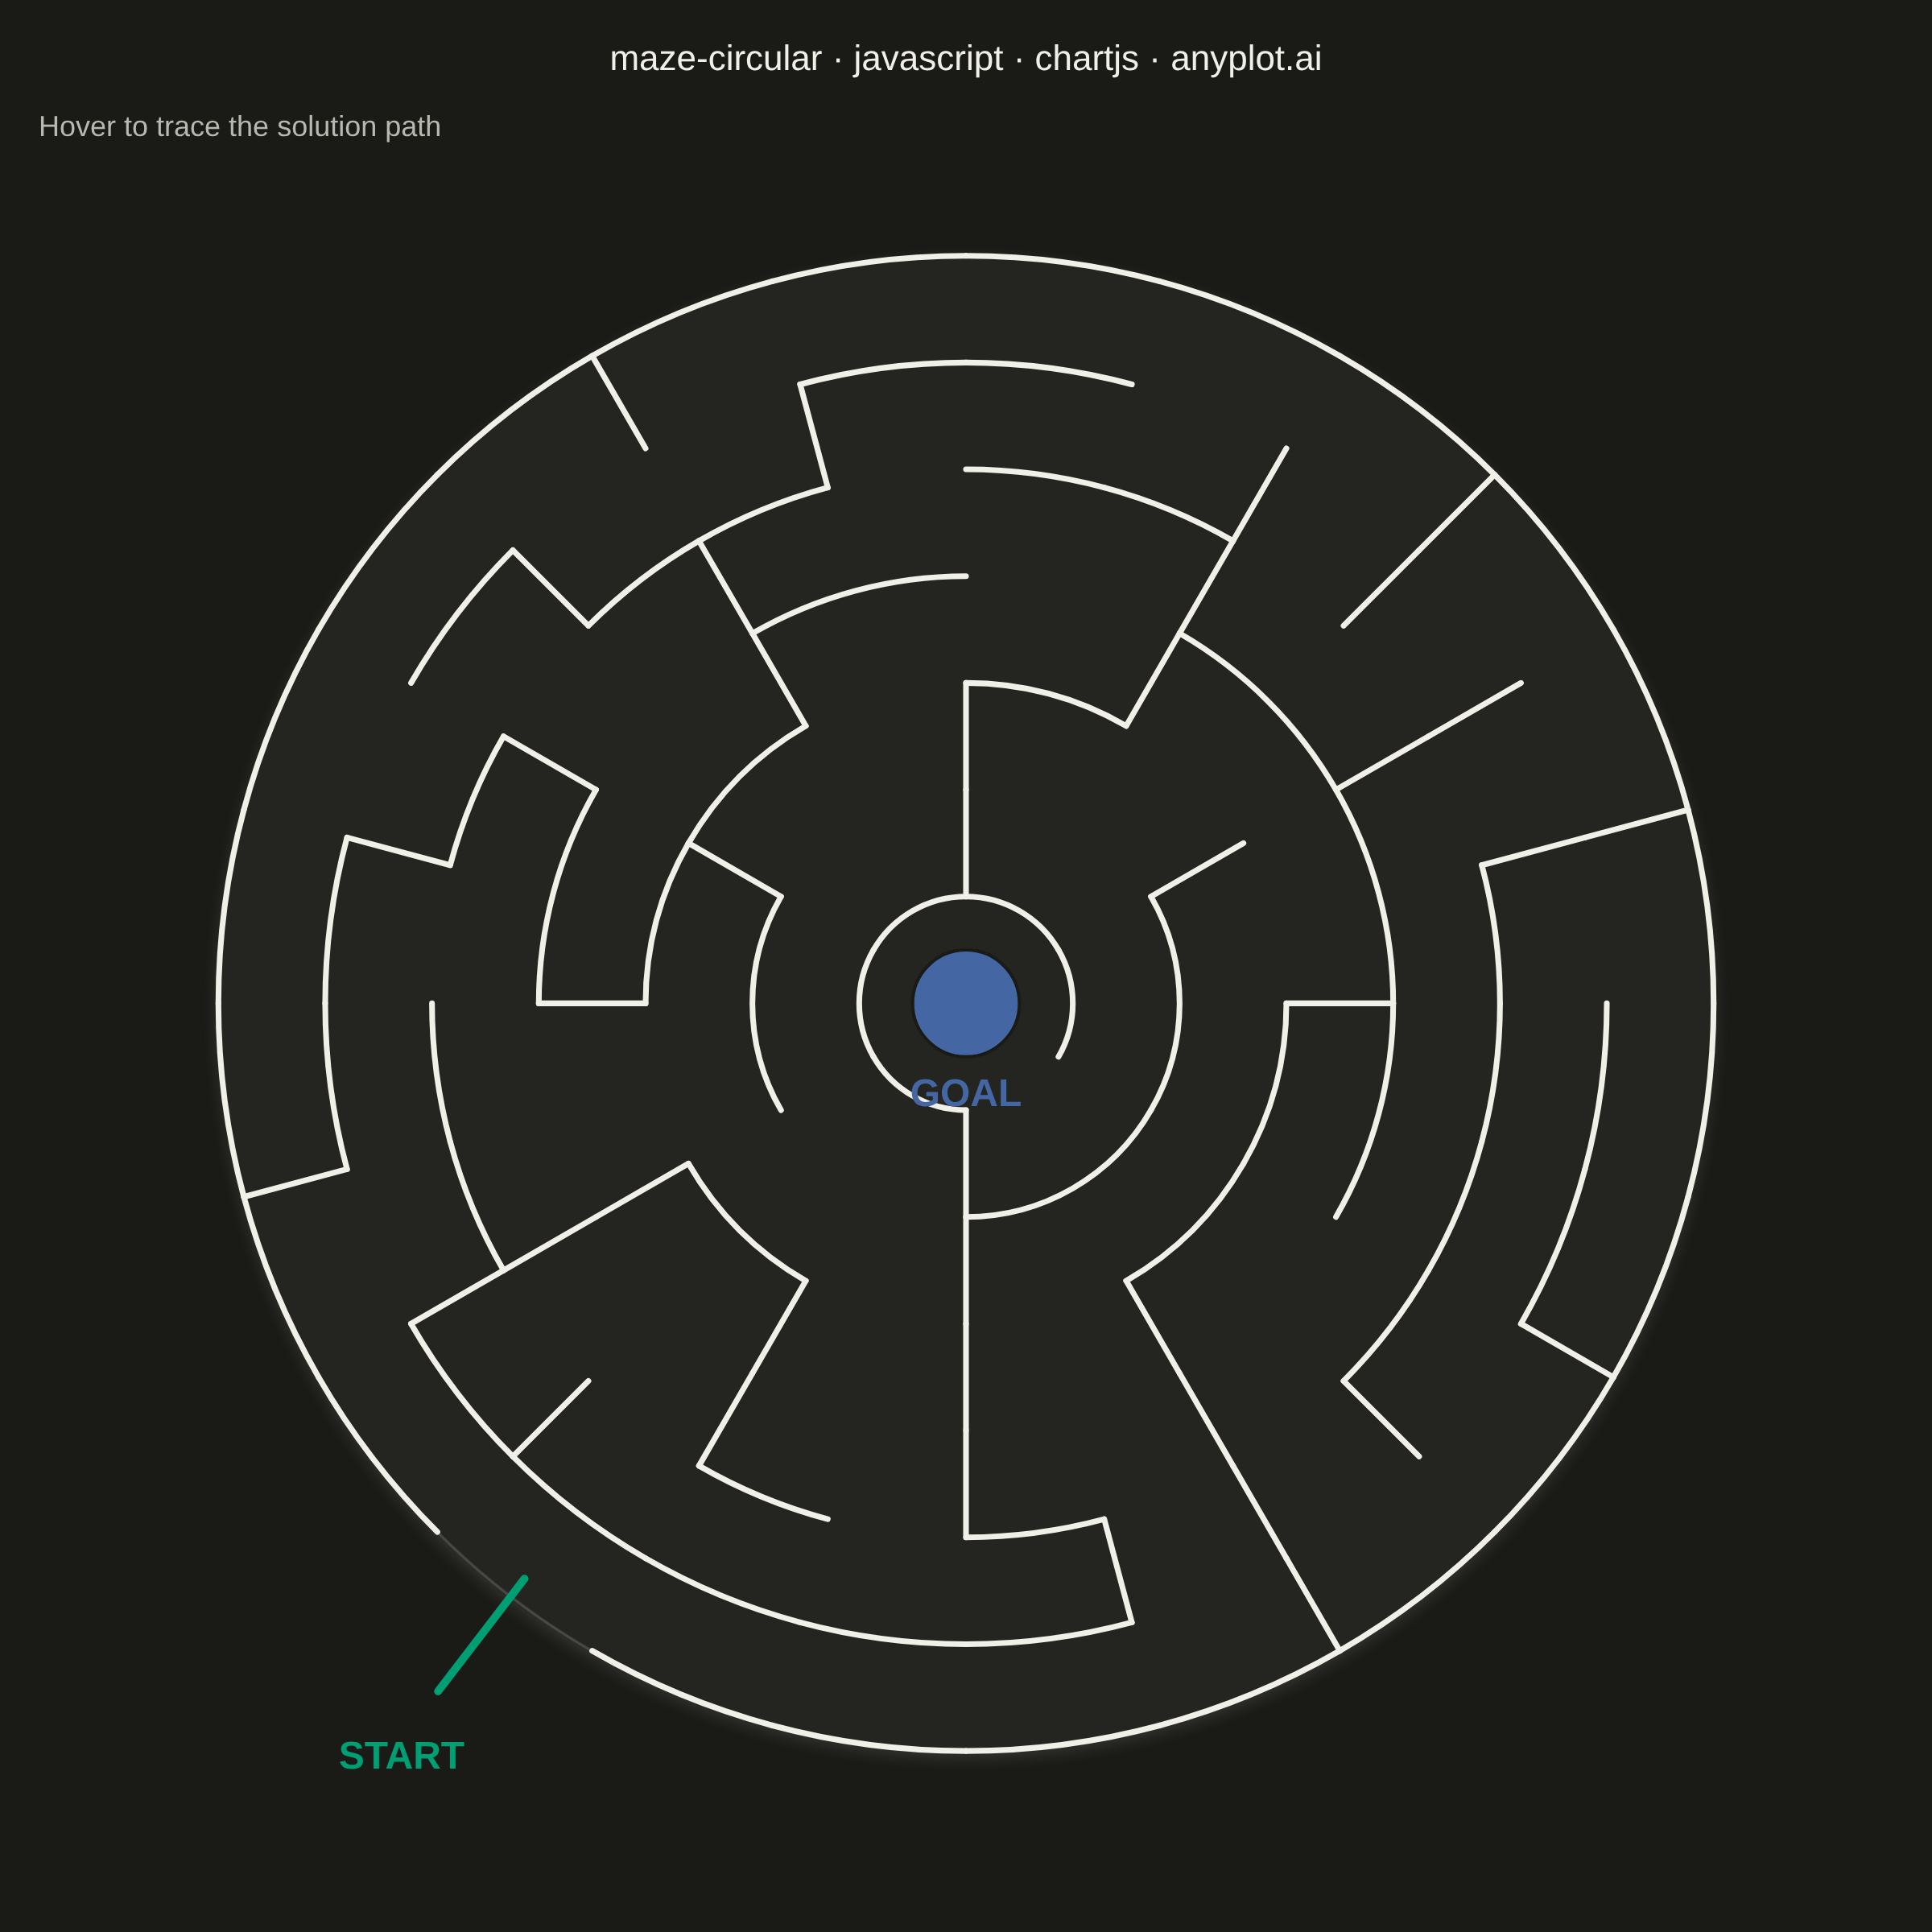
A circular maze puzzle visualization featuring concentric rings connected by radial passages. Unlike rectangular mazes, this design creates a unique solving experience where the player navigates inward through ring-shaped corridors. The maze has an entry point on the outer edge and a goal at the center, with algorithmically generated walls ensuring exactly one solvable path.
// anyplot.ai
// maze-circular: Circular Maze Puzzle
// Library: chartjs 4.4.7 | JavaScript 22.23.2
// Quality: 93/100 | Created: 2026-09-02
//# anyplot-orientation: square

const t = window.ANYPLOT_TOKENS;

// --- Data: circular-maze generation (in-memory, deterministic) -------------
// rings=7, difficulty="medium" (sector density below), seed=20260902.
// Ring 0 is a single central cell; sector count doubles every other ring so
// corridor width stays roughly constant as the circumference grows.
const RINGS = 7;
const sectorsPerRing = [1];
let sectorCount = 6;
for (let r = 1; r < RINGS; r++) {
  sectorsPerRing.push(sectorCount);
  if (r % 2 === 0) sectorCount *= 2;
}

// Tiny fixed-seed LCG — the browser has no seeded RNG, and Math.random() is
// not reproducible across runs.
const makeRng = (seed) => {
  let state = seed >>> 0;
  return () => {
    state = (state * 1664525 + 1013904223) >>> 0;
    return state / 4294967296;
  };
};
const rng = makeRng(20260902);

// Neighbor edges of cell (r, s), each tagged with the wall key it would carve.
// A radial edge is keyed by the lower-index sector on its clockwise side; an
// edge to the ring below is keyed by the outer cell's own inner wall — both
// keys are reached identically from either direction, so no edge is double-
// counted.
const neighborsOf = (r, s) => {
  const n = sectorsPerRing[r];
  const list = [];
  if (n > 1) {
    const next = (s + 1) % n;
    const prev = (s - 1 + n) % n;
    list.push({ cell: [r, next], key: `radial:${r}:${s}` });
    list.push({ cell: [r, prev], key: `radial:${r}:${prev}` });
  }
  if (r > 0) {
    const ratioIn = n / sectorsPerRing[r - 1];
    list.push({ cell: [r - 1, Math.floor(s / ratioIn)], key: `inner:${r}:${s}` });
  }
  if (r < RINGS - 1) {
    const ratioOut = sectorsPerRing[r + 1] / n;
    for (let k = 0; k < ratioOut; k++) {
      const outerSector = s * ratioOut + k;
      list.push({ cell: [r + 1, outerSector], key: `inner:${r + 1}:${outerSector}` });
    }
  }
  return list;
};

// Iterative recursive-backtracker: carves a spanning tree over every cell, so
// exactly one path connects any two cells — the puzzle has exactly one
// solution, as required.
const visited = sectorsPerRing.map((n) => new Array(n).fill(false));
visited[0][0] = true;
const removedWalls = new Set();
const stack = [[0, 0]];
while (stack.length > 0) {
  const [r, s] = stack[stack.length - 1];
  const options = neighborsOf(r, s).filter(({ cell }) => !visited[cell[0]][cell[1]]);
  if (options.length === 0) {
    stack.pop();
    continue;
  }
  const pick = options[Math.floor(rng() * options.length)];
  removedWalls.add(pick.key);
  visited[pick.cell[0]][pick.cell[1]] = true;
  stack.push(pick.cell);
}

const entrySector = Math.floor(rng() * sectorsPerRing[RINGS - 1]);

// Ring boundary radii, in abstract units (boundary[r] is the inner edge of
// ring r; boundary[RINGS] is the outer edge of the whole maze).
const boundary = Array.from({ length: RINGS + 1 }, (_, r) => r);
const maxRadius = boundary[RINGS];

// Solution path (entry -> center) through the spanning tree, reconstructed
// from removedWalls via BFS. Used to power a hover-reveal interaction below.
const cellKey = (r, s) => `${r}:${s}`;
const adjacency = new Map();
for (let r = 0; r < RINGS; r++) {
  for (let s = 0; s < sectorsPerRing[r]; s++) {
    const key = cellKey(r, s);
    const carved = neighborsOf(r, s)
      .filter(({ key: edgeKey }) => removedWalls.has(edgeKey))
      .map(({ cell }) => cell);
    adjacency.set(key, carved);
  }
}
const startCell = [RINGS - 1, entrySector];
const cameFrom = new Map([[cellKey(...startCell), null]]);
const queue = [startCell];
while (queue.length > 0) {
  const cur = queue.shift();
  if (cur[0] === 0 && cur[1] === 0) break;
  for (const next of adjacency.get(cellKey(...cur))) {
    const nk = cellKey(...next);
    if (!cameFrom.has(nk)) {
      cameFrom.set(nk, cur);
      queue.push(next);
    }
  }
}
const solutionPath = [[0, 0]];
while (cellKey(...solutionPath[solutionPath.length - 1]) !== cellKey(...startCell)) {
  solutionPath.push(cameFrom.get(cellKey(...solutionPath[solutionPath.length - 1])));
}
solutionPath.reverse();

// --- Mount -------------------------------------------------------------------
const canvas = document.createElement("canvas");
document.getElementById("container").appendChild(canvas);

// --- Maze rendering plugin ---------------------------------------------------
// Chart.js has no native maze/board chart type; a "scatter" chart with an
// empty dataset supplies the canvas lifecycle, theming and title plugin,
// while this plugin draws the rings, radial walls and start/goal markers
// directly against chart.chartArea — Chart.js's own plugin API, no external
// chartjs-chart-* package involved.
// Hover state for the solution-path reveal — driven by Chart.js's own
// afterEvent hook (native event lifecycle, not a DOM listener bolted on).
let pathHovered = false;

const circularMazePlugin = {
  id: "circularMaze",
  afterEvent(chart, args) {
    const { type } = args.event;
    const next = type === "mouseout" ? false : type === "mousemove" || type === "mouseenter" ? true : pathHovered;
    if (next !== pathHovered) {
      pathHovered = next;
      args.changed = true;
    }
  },
  afterDatasetsDraw(chart) {
    const { ctx, chartArea } = chart;
    const minDim = Math.min(chartArea.width, chartArea.height);
    const cx = (chartArea.left + chartArea.right) / 2;
    const cy = (chartArea.top + chartArea.bottom) / 2;
    const outerRadiusPx = minDim * 0.42;
    const pxScale = outerRadiusPx / maxRadius;
    const angleAt = (frac) => -Math.PI / 2 + frac * 2 * Math.PI;
    const pointAt = (radiusUnits, angleRad) => ({
      x: cx + radiusUnits * pxScale * Math.cos(angleRad),
      y: cy + radiusUnits * pxScale * Math.sin(angleRad),
    });

    ctx.save();

    // Maze disc — distinguishes corridor space from the page background, with
    // a soft drop shadow and a hairline border for a finished, print-ready edge.
    ctx.save();
    ctx.shadowColor = t.grid;
    ctx.shadowBlur = minDim * 0.02;
    ctx.shadowOffsetY = minDim * 0.006;
    ctx.beginPath();
    ctx.arc(cx, cy, outerRadiusPx, 0, Math.PI * 2);
    ctx.fillStyle = t.elevatedBg;
    ctx.fill();
    ctx.restore();
    ctx.beginPath();
    ctx.arc(cx, cy, outerRadiusPx, 0, Math.PI * 2);
    ctx.strokeStyle = t.grid;
    ctx.lineWidth = Math.max(1.5, minDim * 0.0015);
    ctx.stroke();

    const wallWidth = Math.max(2.5, minDim * 0.0032);
    ctx.strokeStyle = t.ink;
    ctx.lineWidth = wallWidth;
    ctx.lineCap = "round";
    ctx.lineJoin = "round";

    // Ring-boundary arcs — one per sector, skipped where a passage was carved.
    for (let r = 1; r < RINGS; r++) {
      const n = sectorsPerRing[r];
      const radiusPx = boundary[r] * pxScale;
      for (let s = 0; s < n; s++) {
        if (removedWalls.has(`inner:${r}:${s}`)) continue;
        ctx.beginPath();
        ctx.arc(cx, cy, radiusPx, angleAt(s / n), angleAt((s + 1) / n));
        ctx.stroke();
      }
    }

    // Outer perimeter — full circle except the entry gap.
    {
      const outerRing = RINGS - 1;
      const n = sectorsPerRing[outerRing];
      const radiusPx = boundary[RINGS] * pxScale;
      for (let s = 0; s < n; s++) {
        if (s === entrySector) continue;
        ctx.beginPath();
        ctx.arc(cx, cy, radiusPx, angleAt(s / n), angleAt((s + 1) / n));
        ctx.stroke();
      }
    }

    // Radial walls — straight segments between adjacent sectors in a ring.
    for (let r = 1; r < RINGS; r++) {
      const n = sectorsPerRing[r];
      if (n <= 1) continue;
      const rInnerPx = boundary[r] * pxScale;
      const rOuterPx = boundary[r + 1] * pxScale;
      for (let s = 0; s < n; s++) {
        if (removedWalls.has(`radial:${r}:${s}`)) continue;
        const theta = angleAt((s + 1) / n);
        ctx.beginPath();
        ctx.moveTo(cx + rInnerPx * Math.cos(theta), cy + rInnerPx * Math.sin(theta));
        ctx.lineTo(cx + rOuterPx * Math.cos(theta), cy + rOuterPx * Math.sin(theta));
        ctx.stroke();
      }
    }

    // Entry marker — brand green, points inward through the perimeter gap.
    const entryN = sectorsPerRing[RINGS - 1];
    const entryAngle = angleAt((entrySector + 0.5) / entryN);
    const entryOuter = pointAt(maxRadius * 1.16, entryAngle);
    const entryInner = pointAt(maxRadius * 0.97, entryAngle);
    ctx.strokeStyle = t.palette[0];
    ctx.lineWidth = wallWidth * 1.4;
    ctx.beginPath();
    ctx.moveTo(entryOuter.x, entryOuter.y);
    ctx.lineTo(entryInner.x, entryInner.y);
    ctx.stroke();

    const labelSize = Math.round(minDim * 0.022);
    ctx.fillStyle = t.palette[0];
    ctx.font = `600 ${labelSize}px sans-serif`;
    ctx.textAlign = "center";
    ctx.textBaseline = Math.sin(entryAngle) > 0 ? "top" : "bottom";
    const entryLabel = pointAt(maxRadius * 1.24, entryAngle);
    ctx.fillText("START", entryLabel.x, entryLabel.y);

    // Goal marker — brand blue, filled disc at the true center.
    const goalRadiusPx = pxScale * 0.5;
    ctx.beginPath();
    ctx.arc(cx, cy, goalRadiusPx, 0, Math.PI * 2);
    ctx.fillStyle = t.palette[2];
    ctx.fill();
    ctx.strokeStyle = t.pageBg;
    ctx.lineWidth = 2;
    ctx.stroke();
    ctx.fillStyle = t.palette[2];
    ctx.font = `600 ${labelSize}px sans-serif`;
    ctx.textAlign = "center";
    ctx.textBaseline = "top";
    ctx.fillText("GOAL", cx, cy + goalRadiusPx + labelSize * 0.5);

    // Hover-reveal solution path — genuine chart.js interactivity (driven by
    // the afterEvent hook above), only ever visible in the interactive HTML
    // view; the static PNG screenshot never carries a hover state.
    if (pathHovered) {
      ctx.beginPath();
      solutionPath.forEach(([r, s], i) => {
        const n = sectorsPerRing[r];
        const radiusUnits = (boundary[r] + boundary[r + 1]) / 2;
        const p = pointAt(radiusUnits, angleAt((s + 0.5) / n));
        if (i === 0) ctx.moveTo(p.x, p.y);
        else ctx.lineTo(p.x, p.y);
      });
      ctx.strokeStyle = t.palette[0];
      ctx.globalAlpha = 0.55;
      ctx.lineWidth = wallWidth * 2.2;
      ctx.lineJoin = "round";
      ctx.stroke();
      ctx.globalAlpha = 1;
    }

    // Hint chrome — tells viewers of the interactive HTML view that hovering
    // reveals the solution; harmless static text in the static PNG.
    ctx.fillStyle = t.inkSoft;
    ctx.font = `400 ${Math.round(labelSize * 0.75)}px sans-serif`;
    ctx.textAlign = "left";
    ctx.textBaseline = "top";
    ctx.fillText("Hover to trace the solution path", chartArea.left, chartArea.top);

    ctx.restore();
    window.__anyplotReady = true;
  },
};

// --- Title (scale fontsize to the rendered length, see plot-generator.md) --
const title = "maze-circular · javascript · chartjs · anyplot.ai";
const titleFontSize = Math.round(22 * Math.min(1, 67 / title.length));

// --- Chart -------------------------------------------------------------------
new Chart(canvas, {
  type: "scatter",
  data: { datasets: [{ data: [] }] },
  plugins: [circularMazePlugin],
  options: {
    responsive: true,
    maintainAspectRatio: false,
    animation: false,
    layout: { padding: 24 },
    plugins: {
      title: {
        display: true,
        text: title,
        color: t.ink,
        font: { size: titleFontSize, weight: "500" },
        padding: { bottom: 20 },
      },
      legend: { display: false },
      tooltip: { enabled: false },
    },
    scales: {
      x: { display: false, min: -1, max: 1 },
      y: { display: false, min: -1, max: 1 },
    },
  },
});
Runnable source as JSON, for any HTTP client: https://api.anyplot.ai/specs/maze-circular/chartjs/code. Any spec id and library id listed in llms-full.txt fit the same URL shape; every URL below is complete and callable.
{
  "spec_id": "maze-circular",
  "language": "javascript",
  "library": "chartjs",
  "page": "https://anyplot.ai/maze-circular/javascript/chartjs",
  "hub": "https://anyplot.ai/maze-circular",
  "code_json": "https://api.anyplot.ai/specs/maze-circular/chartjs/code",
  "spec_json": "https://api.anyplot.ai/specs/maze-circular",
  "render_light_png": "https://storage.googleapis.com/anyplot-images/plots/maze-circular/javascript/chartjs/plot-light.png",
  "render_dark_png": "https://storage.googleapis.com/anyplot-images/plots/maze-circular/javascript/chartjs/plot-dark.png",
  "interactive_light_html": "https://storage.googleapis.com/anyplot-images/plots/maze-circular/javascript/chartjs/plot-light.html",
  "interactive_dark_html": "https://storage.googleapis.com/anyplot-images/plots/maze-circular/javascript/chartjs/plot-dark.html",
  "quality_score": 93.0,
  "license": "MIT",
  "guide": "https://anyplot.ai/llms.txt"
}
Part of Circular Maze Puzzle on anyplot.ai.