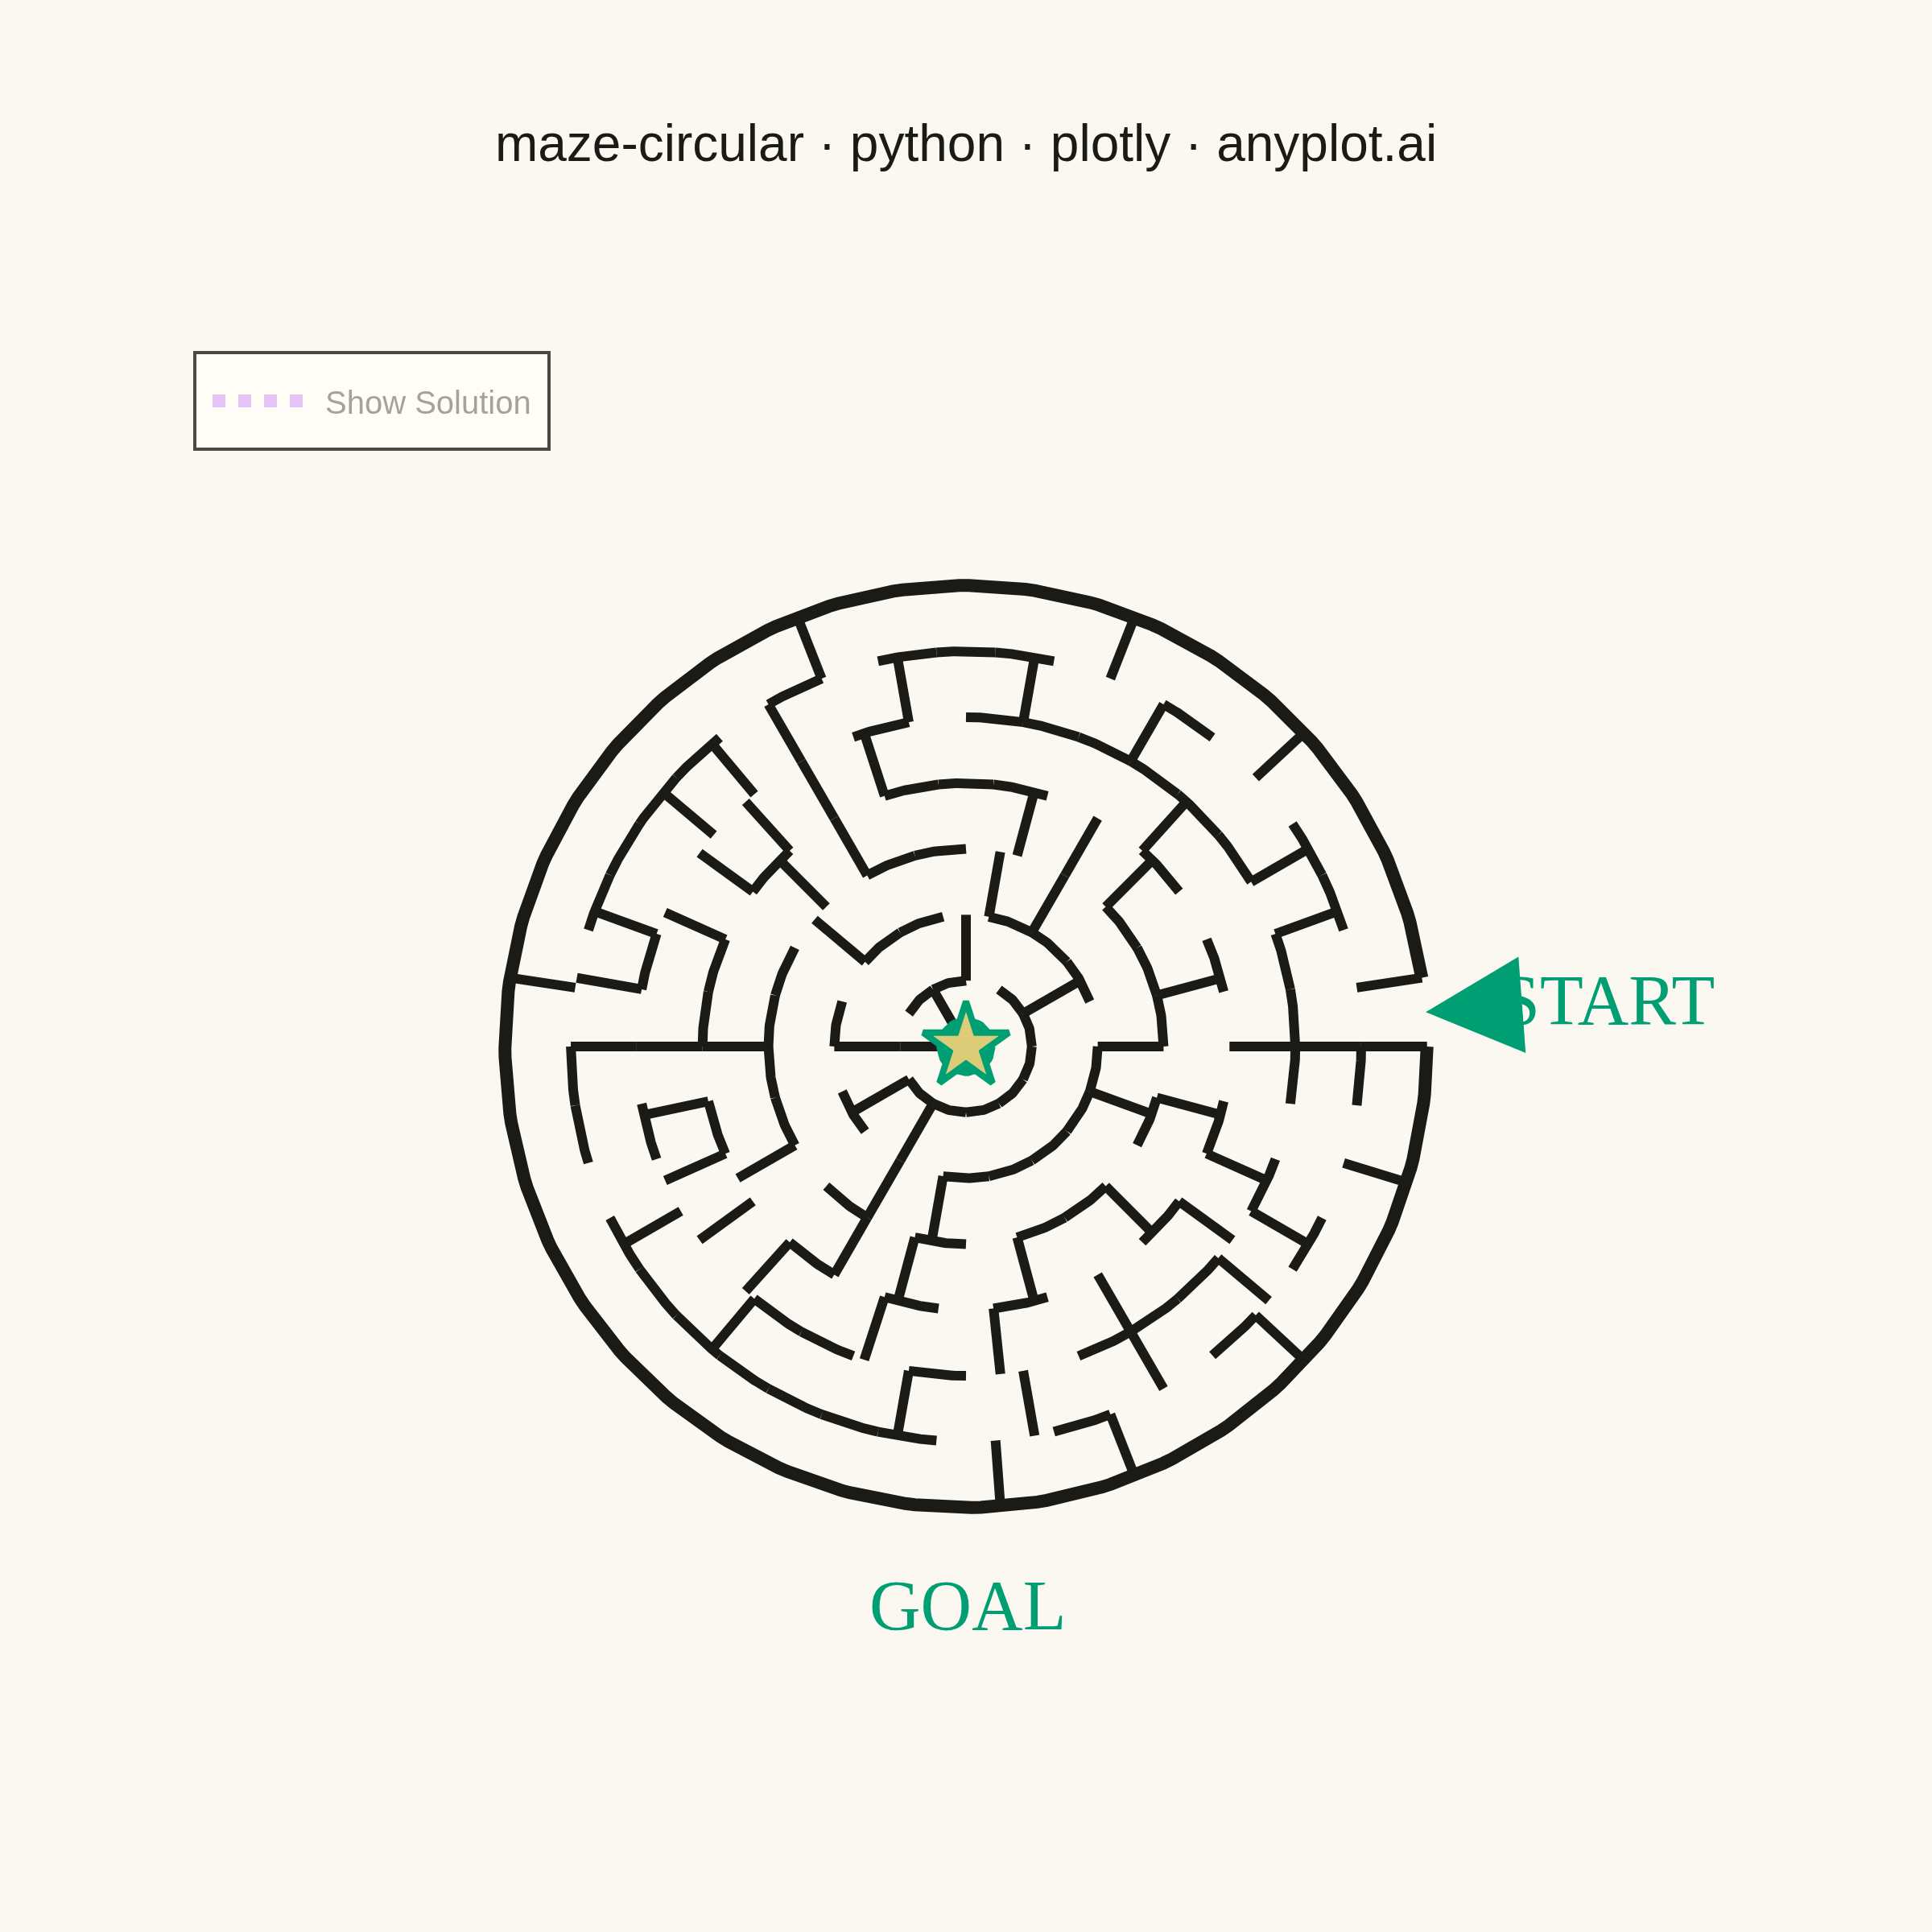
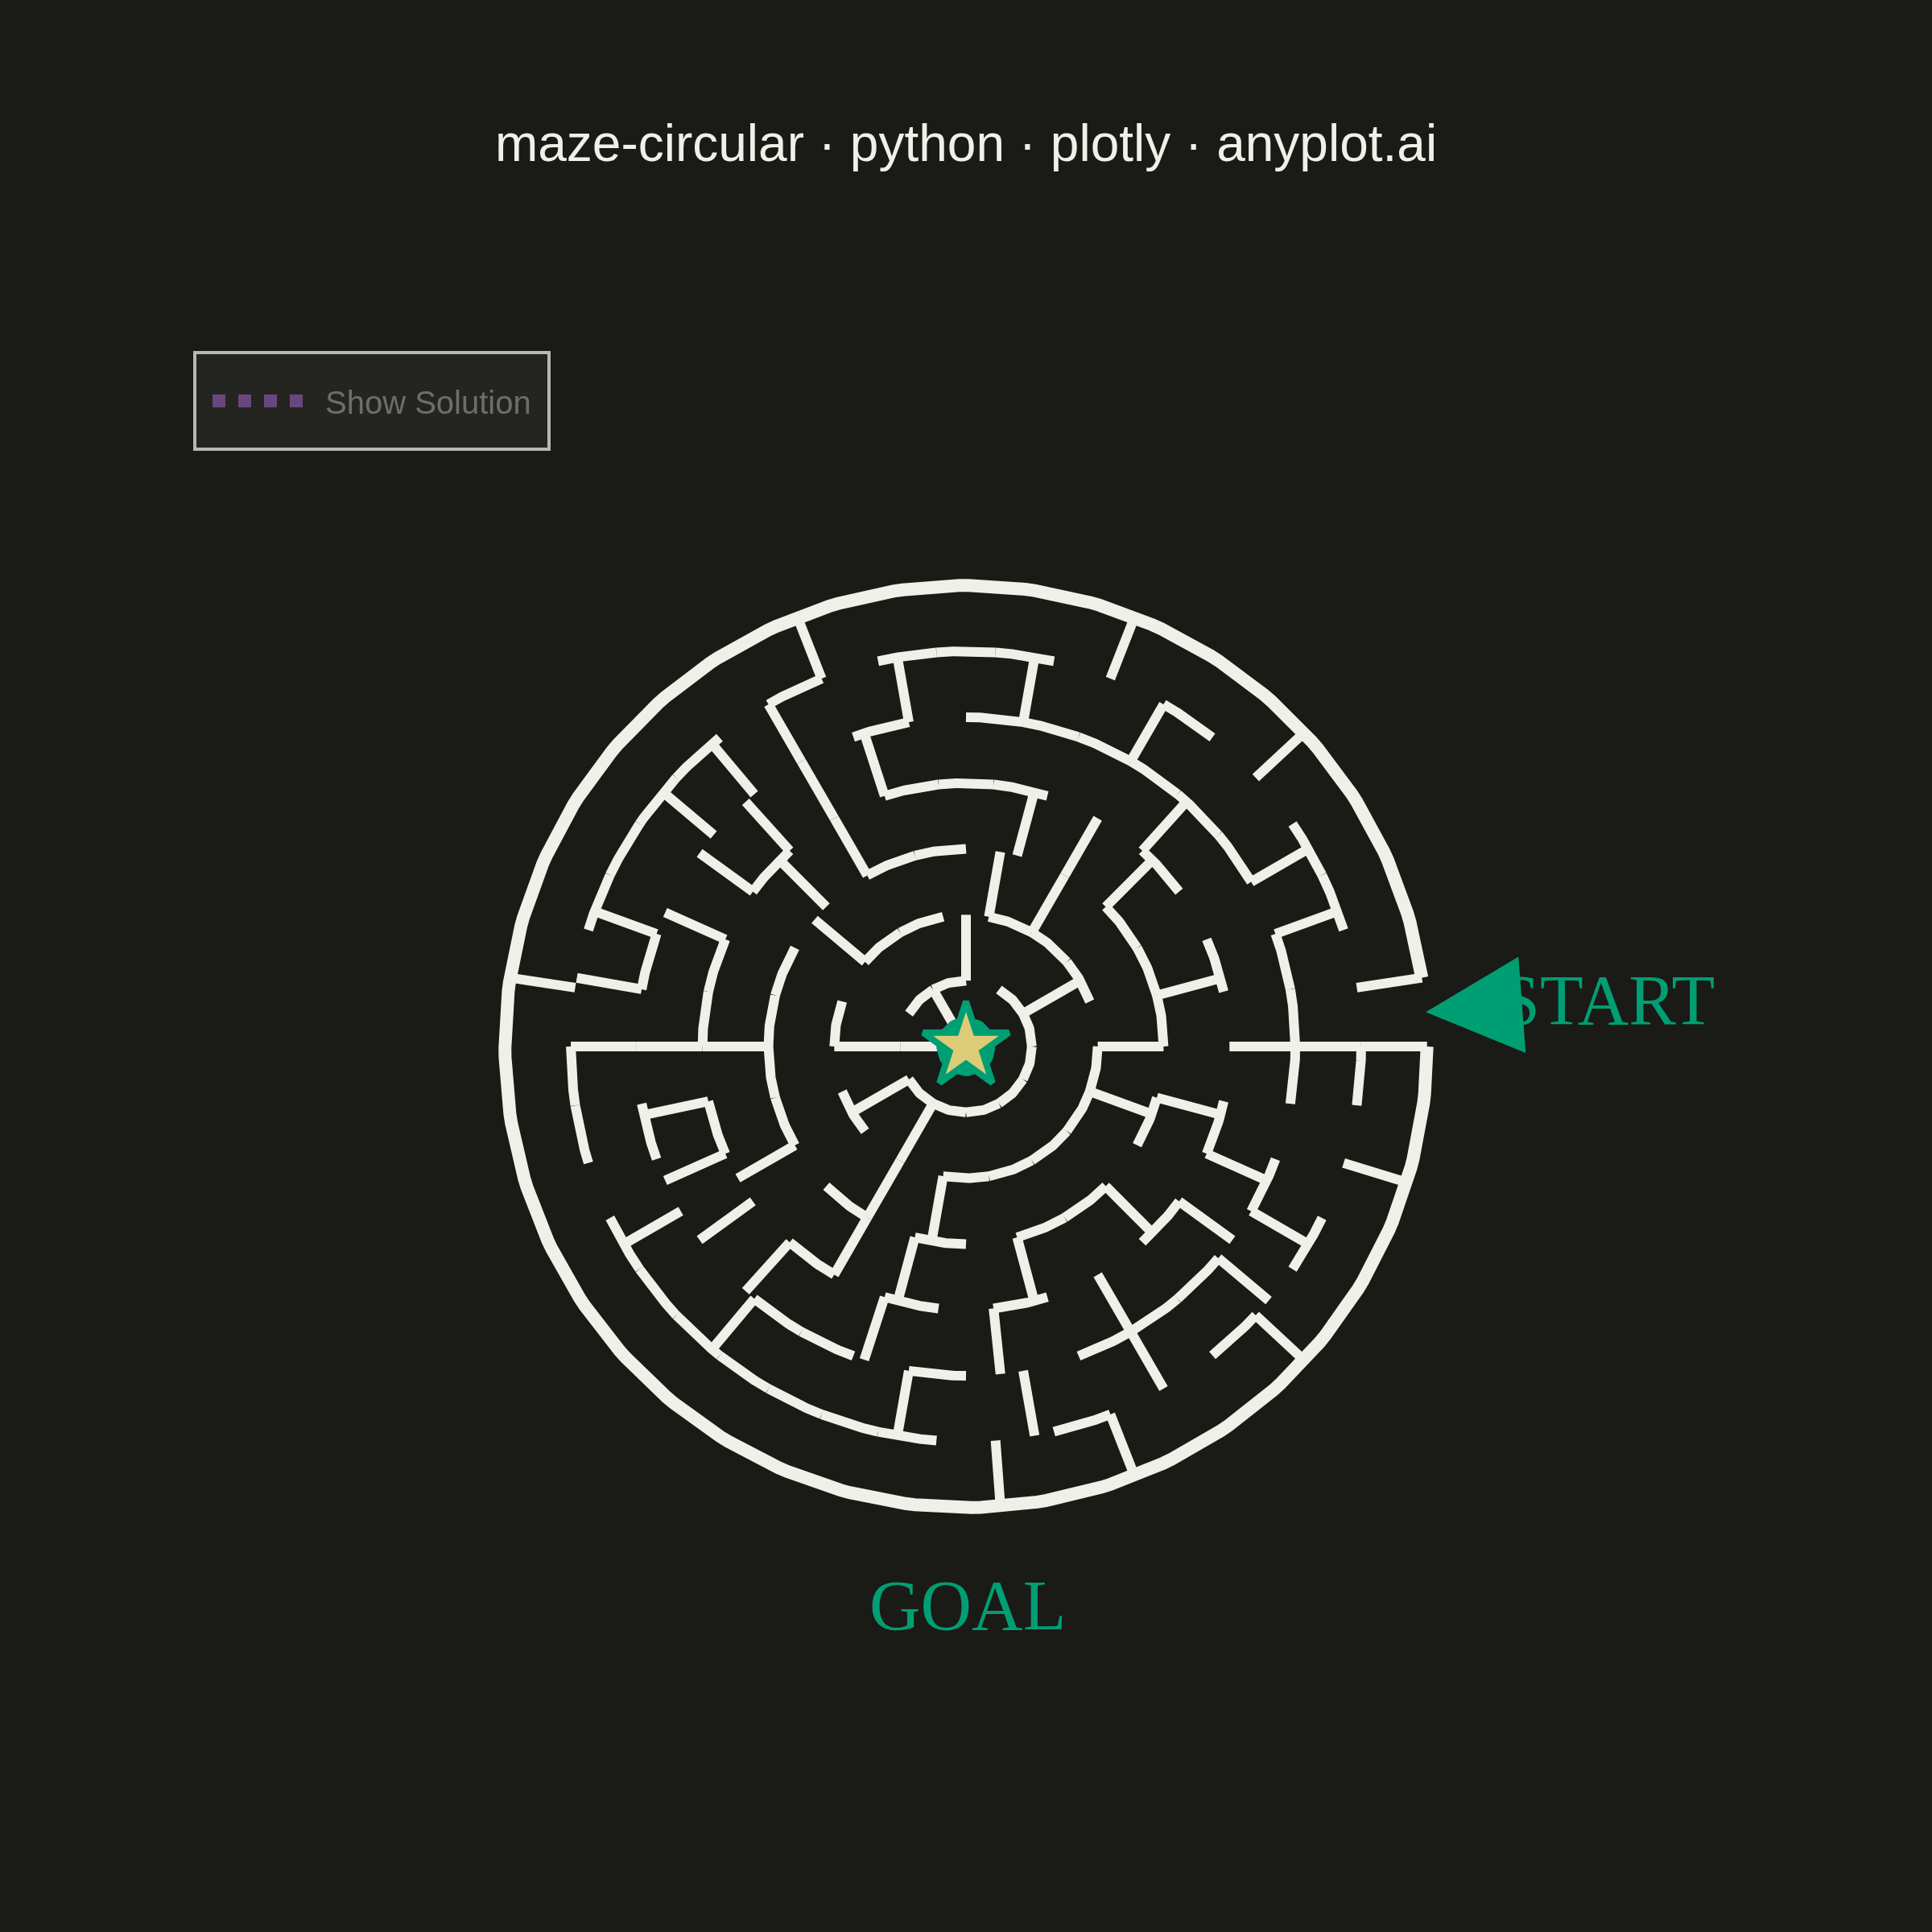
A circular maze puzzle visualization featuring concentric rings connected by radial passages. Unlike rectangular mazes, this design creates a unique solving experience where the player navigates inward through ring-shaped corridors. The maze has an entry point on the outer edge and a goal at the center, with algorithmically generated walls ensuring exactly one solvable path.
""" anyplot.ai
maze-circular: Circular Maze Puzzle
Library: plotly 6.7.0 | Python 3.13.13
Quality: 88/100 | Updated: 2026-05-20
"""

import os
import sys
from collections import deque


# Remove current directory from path to avoid importing local plotly.py
sys.path = [p for p in sys.path if p not in ("", ".", os.path.dirname(__file__))]

import numpy as np
import plotly.graph_objects as go


# Theme
THEME = os.getenv("ANYPLOT_THEME", "light")
PAGE_BG = "#FAF8F1" if THEME == "light" else "#1A1A17"
ELEVATED_BG = "#FFFDF6" if THEME == "light" else "#242420"
INK = "#1A1A17" if THEME == "light" else "#F0EFE8"
INK_SOFT = "#4A4A44" if THEME == "light" else "#B8B7B0"
ACCENT = "#009E73"  # Okabe-Ito position 1

# Maze parameters — outer rings have more sectors than inner rings
np.random.seed(42)
NUM_RINGS = 7
SECTORS = [42, 36, 30, 24, 18, 12, 6]

# Wall arrays: radial_walls[r][s] = wall clockwise from sector s in ring r
#              ring_walls[r][s]   = wall between ring r and ring r+1 at sector s
radial_walls = [[True] * SECTORS[r] for r in range(NUM_RINGS)]
ring_walls = [[True] * SECTORS[r] for r in range(NUM_RINGS - 1)]

# Depth-first search maze generation — guarantees exactly one solution
visited = {(0, 0)}
dfs_stack = [(0, 0)]

while dfs_stack:
    cr, cs = dfs_stack[-1]
    n = SECTORS[cr]

    neighbors = [(cr, (cs + 1) % n, "cw"), (cr, (cs - 1) % n, "ccw")]
    if cr < NUM_RINGS - 1:
        neighbors.append((cr + 1, int(cs * SECTORS[cr + 1] / n), "in"))
    if cr > 0:
        neighbors.append((cr - 1, int(cs * SECTORS[cr - 1] / n), "out"))

    unvisited = [(r, s, d) for r, s, d in neighbors if (r, s) not in visited]

    if unvisited:
        nr, ns, d = unvisited[np.random.randint(len(unvisited))]
        if d == "cw":
            radial_walls[cr][cs] = False
        elif d == "ccw":
            radial_walls[cr][ns] = False
        elif d == "in":
            ring_walls[cr][cs] = False
        else:
            ring_walls[nr][ns] = False
        visited.add((nr, ns))
        dfs_stack.append((nr, ns))
    else:
        dfs_stack.pop()

# Build undirected passage graph for BFS
graph = {}

for r in range(NUM_RINGS):
    for s in range(SECTORS[r]):
        if not radial_walls[r][s]:
            a, b = (r, s), (r, (s + 1) % SECTORS[r])
            graph.setdefault(a, []).append(b)
            graph.setdefault(b, []).append(a)

for r in range(NUM_RINGS - 1):
    for s in range(SECTORS[r]):
        if not ring_walls[r][s]:
            inner_s = int(s * SECTORS[r + 1] / SECTORS[r])
            a, b = (r, s), (r + 1, inner_s)
            graph.setdefault(a, []).append(b)
            graph.setdefault(b, []).append(a)

# BFS to find the unique solution path to the innermost ring
bfs_queue = deque([((0, 0), [(0, 0)])])
bfs_seen = {(0, 0)}
solution = []

while bfs_queue:
    cell, path = bfs_queue.popleft()
    if cell[0] == NUM_RINGS - 1:
        solution = path
        break
    for nb in graph.get(cell, []):
        if nb not in bfs_seen:
            bfs_seen.add(nb)
            bfs_queue.append((nb, path + [nb]))

sol_x, sol_y = [], []
for r, s in solution:
    r_mid = NUM_RINGS - r - 0.5
    angle = (s + 0.5) * 2 * np.pi / SECTORS[r]
    sol_x.append(r_mid * np.cos(angle))
    sol_y.append(r_mid * np.sin(angle))
sol_x.append(0.0)
sol_y.append(0.0)

# Drawing constants
OUTER_R = NUM_RINGS
WALL_W = 3

fig = go.Figure()

# Ring arc walls — inner boundary arcs where wall exists
for r in range(NUM_RINGS - 1):
    n = SECTORS[r]
    inner_r = NUM_RINGS - r - 1
    sa = 2 * np.pi / n
    for s in range(n):
        if ring_walls[r][s]:
            theta = np.linspace(s * sa, (s + 1) * sa, 30)
            fig.add_trace(
                go.Scatter(
                    x=inner_r * np.cos(theta),
                    y=inner_r * np.sin(theta),
                    mode="lines",
                    line={"color": INK, "width": WALL_W},
                    showlegend=False,
                    hoverinfo="skip",
                )
            )

# Outer boundary circle with entry gap at sector 0
gap_start = 0.0
gap_end = 2 * np.pi / SECTORS[0]
theta_outer = np.linspace(gap_end, gap_start + 2 * np.pi, 300)
fig.add_trace(
    go.Scatter(
        x=OUTER_R * np.cos(theta_outer),
        y=OUTER_R * np.sin(theta_outer),
        mode="lines",
        line={"color": INK, "width": WALL_W + 1},
        showlegend=False,
        hoverinfo="skip",
    )
)

# Radial walls — spokes between ring boundaries
for r in range(NUM_RINGS):
    r_out = NUM_RINGS - r
    r_in = NUM_RINGS - r - 1
    n = SECTORS[r]
    for s in range(n):
        if radial_walls[r][s]:
            theta = (s + 1) * 2 * np.pi / n
            fig.add_trace(
                go.Scatter(
                    x=[r_in * np.cos(theta), r_out * np.cos(theta)],
                    y=[r_in * np.sin(theta), r_out * np.sin(theta)],
                    mode="lines",
                    line={"color": INK, "width": WALL_W},
                    showlegend=False,
                    hoverinfo="skip",
                )
            )

# Solution path — hidden by default; click legend entry to reveal
fig.add_trace(
    go.Scatter(
        x=sol_x,
        y=sol_y,
        mode="lines",
        name="Show Solution",
        line={"color": "#C475FD", "width": 4, "dash": "dot"},
        opacity=0.85,
        visible="legendonly",
    )
)

# Center goal circle
goal_r = 0.4
theta_g = np.linspace(0, 2 * np.pi, 60)
fig.add_trace(
    go.Scatter(
        x=goal_r * np.cos(theta_g),
        y=goal_r * np.sin(theta_g),
        fill="toself",
        fillcolor=ACCENT,
        line={"color": ACCENT, "width": 2},
        showlegend=False,
        hoverinfo="skip",
    )
)
fig.add_trace(
    go.Scatter(
        x=[0.0],
        y=[0.0],
        mode="markers",
        marker={"symbol": "star", "size": 20, "color": "#DDCC77", "line": {"color": ACCENT, "width": 2}},
        showlegend=False,
        hoverinfo="skip",
    )
)

# Entry arrow and labels
entry_angle = 0.5 * 2 * np.pi / SECTORS[0]
fig.add_annotation(
    x=OUTER_R * np.cos(entry_angle),
    y=OUTER_R * np.sin(entry_angle),
    ax=(OUTER_R + 1.5) * np.cos(entry_angle),
    ay=(OUTER_R + 1.5) * np.sin(entry_angle),
    xref="x",
    yref="y",
    axref="x",
    ayref="y",
    showarrow=True,
    arrowhead=2,
    arrowsize=2,
    arrowwidth=3,
    arrowcolor=ACCENT,
)
fig.add_annotation(
    x=(OUTER_R + 2.8) * np.cos(entry_angle),
    y=(OUTER_R + 2.8) * np.sin(entry_angle),
    text="START",
    showarrow=False,
    xref="x",
    yref="y",
    font={"size": 22, "color": ACCENT, "family": "Arial Black"},
)
fig.add_annotation(
    x=0.0,
    y=-(OUTER_R + 1.5),
    text="GOAL",
    showarrow=False,
    xref="x",
    yref="y",
    font={"size": 22, "color": ACCENT, "family": "Arial Black"},
)

# Layout
fig.update_layout(
    title={
        "text": "maze-circular · python · plotly · anyplot.ai",
        "font": {"size": 16, "color": INK},
        "x": 0.5,
        "xanchor": "center",
    },
    xaxis={
        "showgrid": False,
        "zeroline": False,
        "showticklabels": False,
        "scaleanchor": "y",
        "scaleratio": 1,
        "range": [-(OUTER_R + 4.0), OUTER_R + 4.0],
    },
    yaxis={"showgrid": False, "zeroline": False, "showticklabels": False, "range": [-(OUTER_R + 4.0), OUTER_R + 4.0]},
    paper_bgcolor=PAGE_BG,
    plot_bgcolor=PAGE_BG,
    showlegend=True,
    legend={
        "bgcolor": ELEVATED_BG,
        "bordercolor": INK_SOFT,
        "borderwidth": 1,
        "font": {"color": INK_SOFT, "size": 10},
        "x": 0.02,
        "y": 0.98,
        "xanchor": "left",
        "yanchor": "top",
    },
    margin={"l": 50, "r": 50, "t": 100, "b": 50},
)

# Save
fig.write_image(f"plot-{THEME}.png", width=600, height=600, scale=4)
fig.write_html(f"plot-{THEME}.html", include_plotlyjs="cdn")
Runnable source as JSON, for any HTTP client: https://api.anyplot.ai/specs/maze-circular/plotly/code. Any spec id and library id listed in llms-full.txt fit the same URL shape; every URL below is complete and callable.
{
  "spec_id": "maze-circular",
  "language": "python",
  "library": "plotly",
  "page": "https://anyplot.ai/maze-circular/python/plotly",
  "hub": "https://anyplot.ai/maze-circular",
  "code_json": "https://api.anyplot.ai/specs/maze-circular/plotly/code",
  "spec_json": "https://api.anyplot.ai/specs/maze-circular",
  "render_light_png": "https://storage.googleapis.com/anyplot-images/plots/maze-circular/python/plotly/plot-light.png",
  "render_dark_png": "https://storage.googleapis.com/anyplot-images/plots/maze-circular/python/plotly/plot-dark.png",
  "interactive_light_html": "https://storage.googleapis.com/anyplot-images/plots/maze-circular/python/plotly/plot-light.html",
  "interactive_dark_html": "https://storage.googleapis.com/anyplot-images/plots/maze-circular/python/plotly/plot-dark.html",
  "quality_score": 88.0,
  "license": "MIT",
  "guide": "https://anyplot.ai/llms.txt"
}
Part of Circular Maze Puzzle on anyplot.ai.