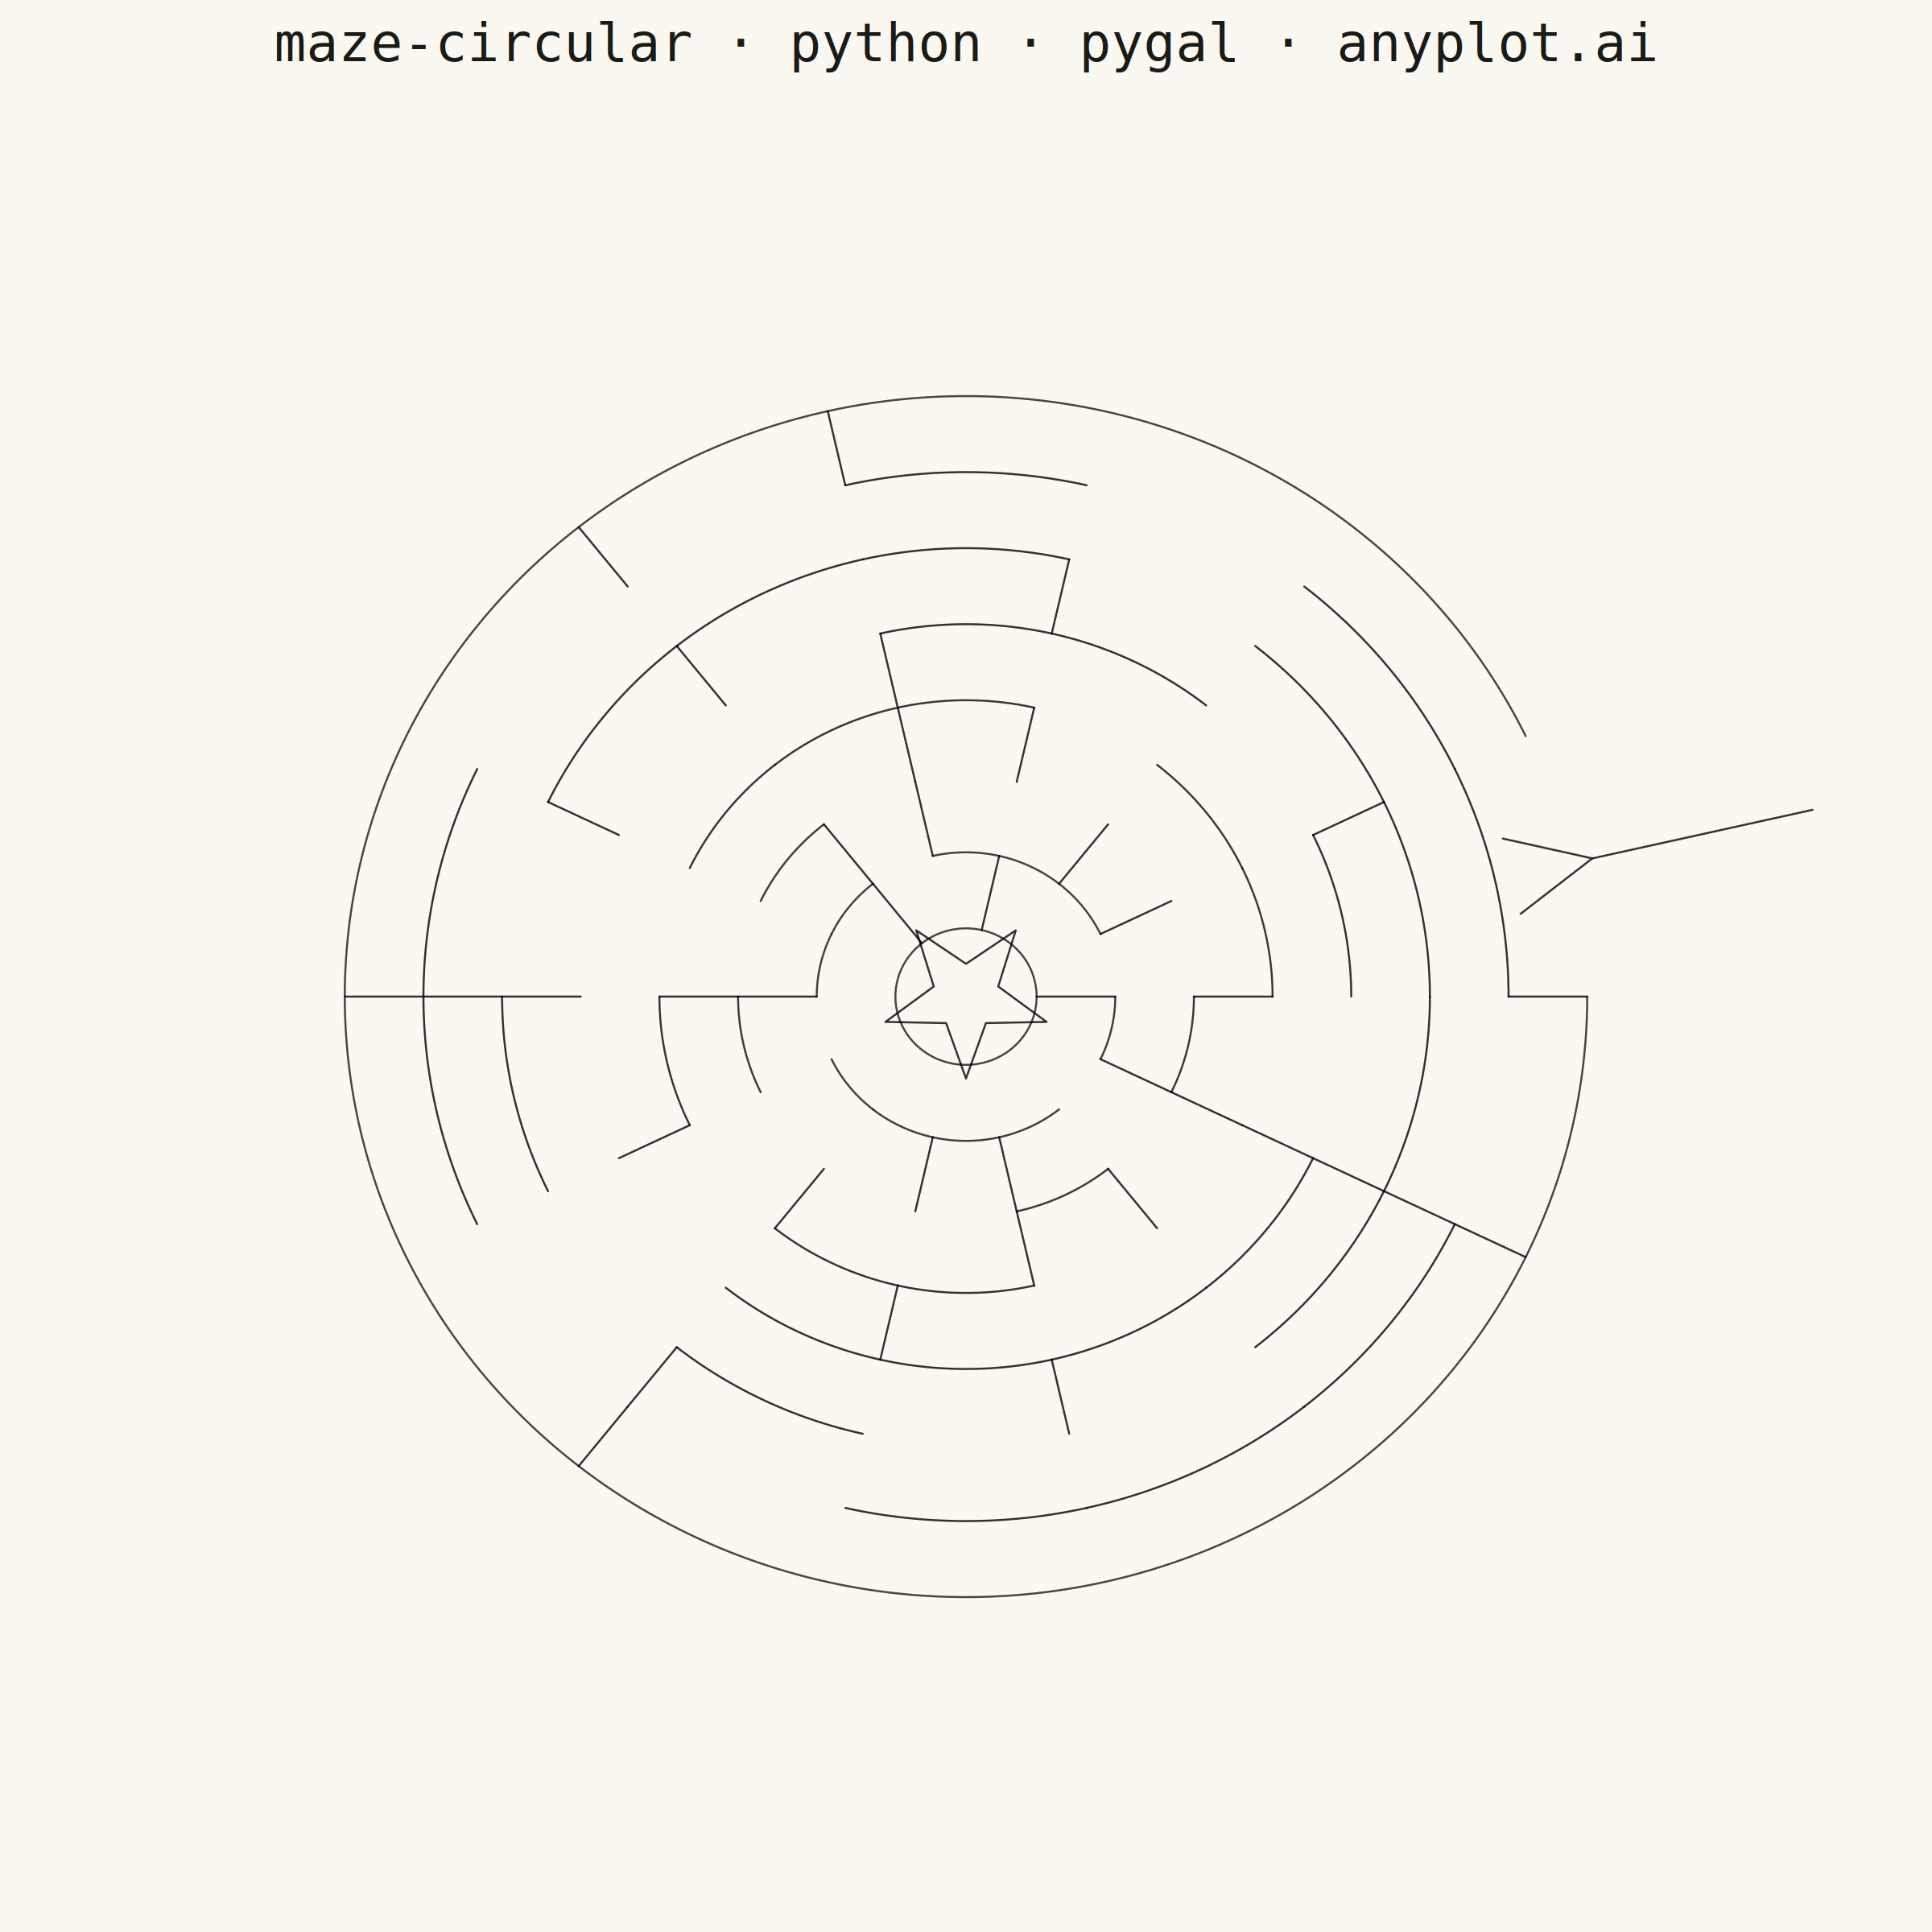
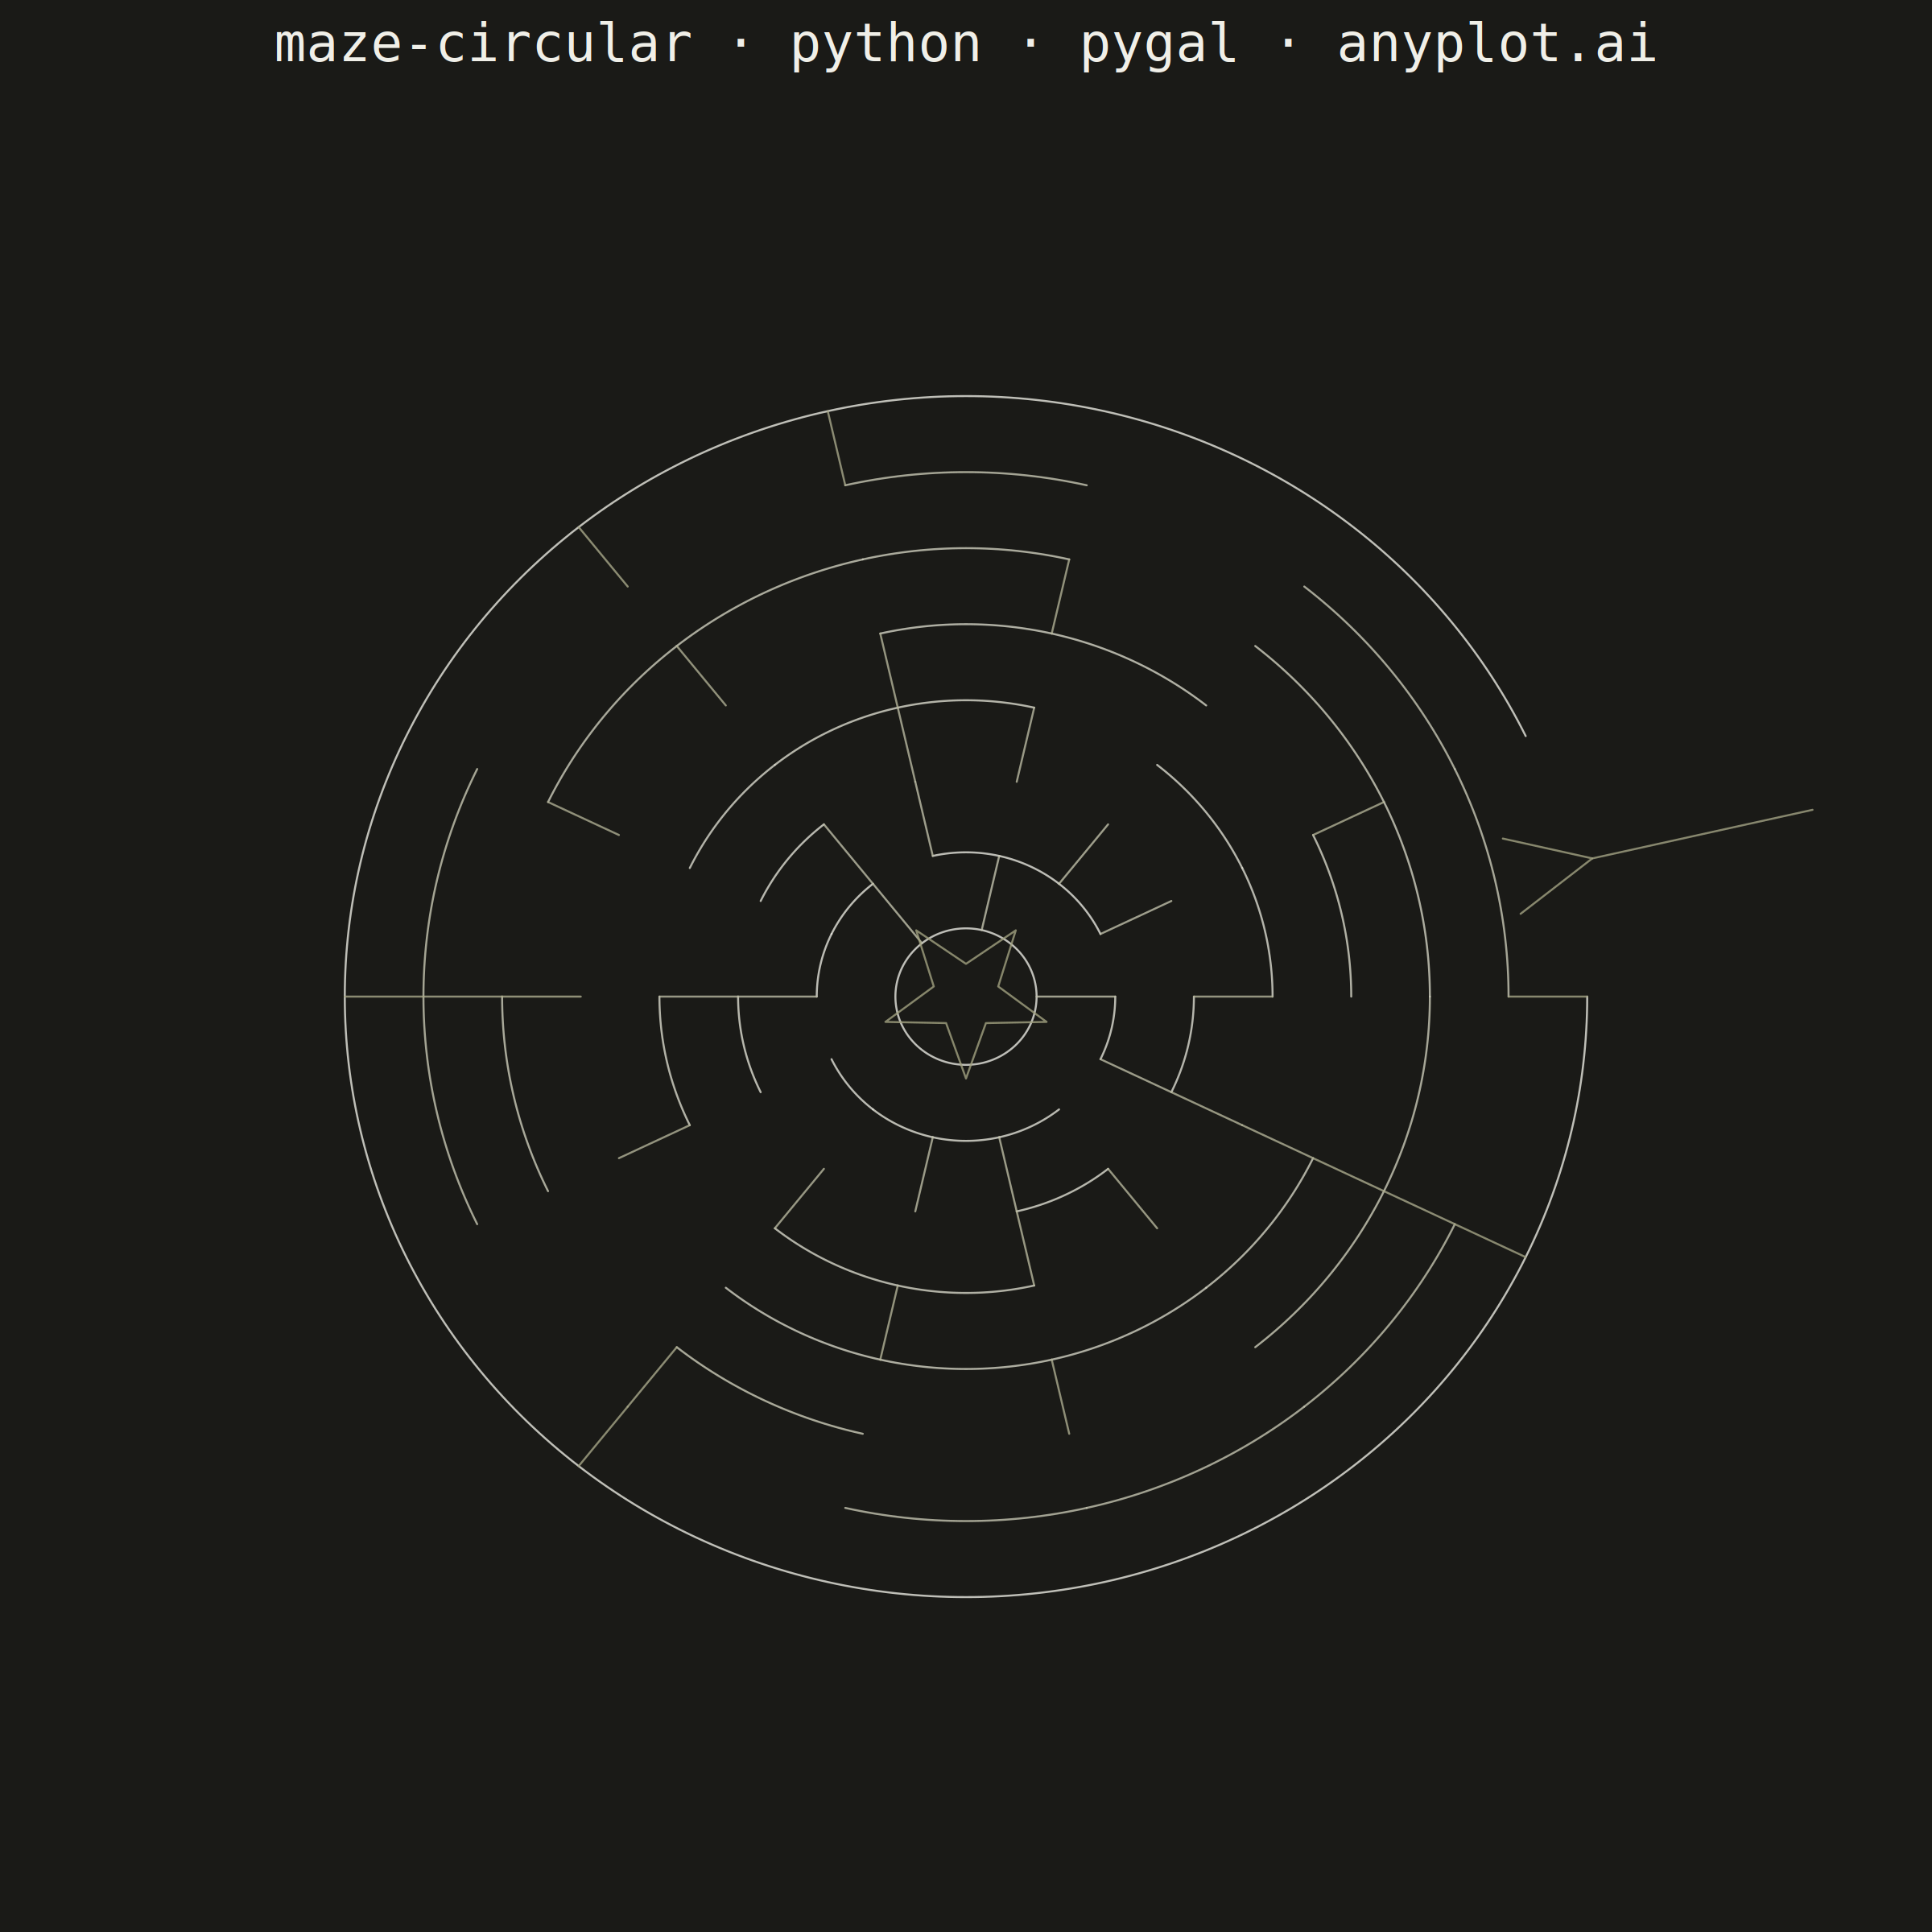
A circular maze puzzle visualization featuring concentric rings connected by radial passages. Unlike rectangular mazes, this design creates a unique solving experience where the player navigates inward through ring-shaped corridors. The maze has an entry point on the outer edge and a goal at the center, with algorithmically generated walls ensuring exactly one solvable path.
""" anyplot.ai
maze-circular: Circular Maze Puzzle
Library: pygal 3.1.0 | Python 3.13.13
Quality: 86/100 | Updated: 2026-05-20
"""

import os
import sys


# Drop script dir so `import pygal` resolves to the installed library, not this file
sys.path[:] = [p for p in sys.path if p not in ("", ".", os.path.dirname(os.path.abspath(__file__)))]

import numpy as np
import pygal
from pygal.style import Style


# Theme tokens
THEME = os.getenv("ANYPLOT_THEME", "light")
PAGE_BG = "#FAF8F1" if THEME == "light" else "#1A1A17"
INK = "#1A1A17" if THEME == "light" else "#F0EFE8"
INK_MUTED = "#6B6A63" if THEME == "light" else "#A8A79F"
WALL_COLOR = "#1A1A17" if THEME == "light" else "#E8E8E0"

# Data
np.random.seed(42)
num_rings = 7
num_sectors = 14
inner_r = 0.10
outer_r = 0.88
radii = np.linspace(inner_r, outer_r, num_rings + 1)[1:]
entry_sector = 0

# Maze graph edges
all_cells = [(r, s) for r in range(num_rings) for s in range(num_sectors)]
edges = []
for ring in range(num_rings):
    for sector in range(num_sectors):
        edges.append(frozenset([(ring, sector), (ring, (sector + 1) % num_sectors)]))
        if ring < num_rings - 1:
            edges.append(frozenset([(ring, sector), (ring + 1, sector)]))
edges = list(set(edges))
np.random.shuffle(edges)

# Kruskal's maze generation (inline union-find with path halving)
parent = {cell: cell for cell in all_cells}
uf_rank = dict.fromkeys(all_cells, 0)
passages = set()
for edge in edges:
    cells = list(edge)
    a = cells[0]
    while parent[a] != a:
        parent[a] = parent[parent[a]]
        a = parent[a]
    b = cells[1]
    while parent[b] != b:
        parent[b] = parent[parent[b]]
        b = parent[b]
    if a != b:
        if uf_rank[a] < uf_rank[b]:
            a, b = b, a
        parent[b] = a
        if uf_rank[a] == uf_rank[b]:
            uf_rank[a] += 1
        passages.add(edge)

# Plot
custom_style = Style(
    background=PAGE_BG,
    plot_background=PAGE_BG,
    foreground=INK,
    foreground_strong=INK,
    foreground_subtle=INK_MUTED,
    colors=(WALL_COLOR,),
    title_font_size=66,
    label_font_size=56,
    major_label_font_size=44,
    legend_font_size=44,
    value_font_size=36,
    stroke_width=2.5,
)

chart = pygal.XY(
    width=2400,
    height=2400,
    style=custom_style,
    title="maze-circular · python · pygal · anyplot.ai",
    show_legend=False,
    show_dots=False,
    stroke=True,
    show_x_guides=False,
    show_y_guides=False,
    show_x_labels=False,
    show_y_labels=False,
    xrange=(-1.25, 1.25),
    range=(-1.25, 1.25),
    explicit_size=True,
    fill=False,
    margin=60,
)

PTS = 32  # arc sample points per sector — smooth curves at 2400 px canvas
wall_stroke = {"width": 10, "linecap": "round", "linejoin": "round", "color": WALL_COLOR}

# Outer boundary with entry gap at sector 0
entry_a1 = 2 * np.pi * entry_sector / num_sectors
entry_a2 = 2 * np.pi * (entry_sector + 1) / num_sectors
angles_outer = np.linspace(entry_a2, entry_a1 + 2 * np.pi, PTS * (num_sectors - 1) + 1)
outer_arc = [(outer_r * np.cos(a), outer_r * np.sin(a)) for a in angles_outer]
chart.add("", outer_arc, stroke_style=wall_stroke)

# Inner circle (goal area boundary)
angles_inner = np.linspace(0, 2 * np.pi, PTS * num_sectors + 1)
inner_arc = [(inner_r * np.cos(a), inner_r * np.sin(a)) for a in angles_inner]
chart.add("", inner_arc, stroke_style=wall_stroke)

# Ring walls (circular arc segments along ring boundaries)
for ring in range(num_rings - 1):
    r = radii[ring]
    for sector in range(num_sectors):
        if frozenset([(ring, sector), (ring + 1, sector)]) not in passages:
            a1 = 2 * np.pi * sector / num_sectors
            a2 = 2 * np.pi * (sector + 1) / num_sectors
            angles = np.linspace(a1, a2, PTS + 1)
            pts = [(r * np.cos(a), r * np.sin(a)) for a in angles]
            chart.add("", pts, stroke_style=wall_stroke)

# Radial walls (straight lines between sector boundaries)
for ring in range(num_rings):
    r_in = radii[ring - 1] if ring > 0 else inner_r
    r_out = radii[ring]
    for sector in range(num_sectors):
        next_s = (sector + 1) % num_sectors
        if frozenset([(ring, sector), (ring, next_s)]) not in passages:
            angle = 2 * np.pi * next_s / num_sectors
            x1, y1 = r_in * np.cos(angle), r_in * np.sin(angle)
            x2, y2 = r_out * np.cos(angle), r_out * np.sin(angle)
            chart.add("", [(x1, y1), (x2, y2)], stroke_style=wall_stroke)

# Entry arrow (Okabe-Ito green #009E73) pointing inward — named for pygal interactive HTML tooltips
mid_angle = (entry_a1 + entry_a2) / 2
tip_x = (outer_r + 0.03) * np.cos(mid_angle)
tip_y = (outer_r + 0.03) * np.sin(mid_angle)
base_x = (outer_r + 0.35) * np.cos(mid_angle)
base_y = (outer_r + 0.35) * np.sin(mid_angle)
entry_stroke = {"width": 20, "linecap": "round", "linejoin": "round", "color": "#009E73"}
chart.add("Entry →", [(base_x, base_y), (tip_x, tip_y)], stroke_style=entry_stroke)
wing1_x = tip_x + 0.13 * np.cos(mid_angle + np.pi - 0.45)
wing1_y = tip_y + 0.13 * np.sin(mid_angle + np.pi - 0.45)
wing2_x = tip_x + 0.13 * np.cos(mid_angle + np.pi + 0.45)
wing2_y = tip_y + 0.13 * np.sin(mid_angle + np.pi + 0.45)
chart.add("", [(wing1_x, wing1_y), (tip_x, tip_y), (wing2_x, wing2_y)], stroke_style=entry_stroke)

# Goal star (Okabe-Ito vermillion #C475FD) at center — named for pygal interactive HTML tooltips
star_pts = []
for i in range(10):
    a_s = i * np.pi / 5 - np.pi / 2
    r_s = 0.12 if i % 2 == 0 else 0.048
    star_pts.append((r_s * np.cos(a_s), r_s * np.sin(a_s)))
star_pts.append(star_pts[0])
chart.add("Goal ★", star_pts, stroke_style={"width": 10, "linecap": "round", "linejoin": "round", "color": "#C475FD"})

# Save
chart.render_to_png(f"plot-{THEME}.png")
with open(f"plot-{THEME}.html", "wb") as f:
    f.write(chart.render())
Runnable source as JSON, for any HTTP client: https://api.anyplot.ai/specs/maze-circular/pygal/code. Any spec id and library id listed in llms-full.txt fit the same URL shape; every URL below is complete and callable.
{
  "spec_id": "maze-circular",
  "language": "python",
  "library": "pygal",
  "page": "https://anyplot.ai/maze-circular/python/pygal",
  "hub": "https://anyplot.ai/maze-circular",
  "code_json": "https://api.anyplot.ai/specs/maze-circular/pygal/code",
  "spec_json": "https://api.anyplot.ai/specs/maze-circular",
  "render_light_png": "https://storage.googleapis.com/anyplot-images/plots/maze-circular/python/pygal/plot-light.png",
  "render_dark_png": "https://storage.googleapis.com/anyplot-images/plots/maze-circular/python/pygal/plot-dark.png",
  "interactive_light_html": "https://storage.googleapis.com/anyplot-images/plots/maze-circular/python/pygal/plot-light.html",
  "interactive_dark_html": "https://storage.googleapis.com/anyplot-images/plots/maze-circular/python/pygal/plot-dark.html",
  "quality_score": 86.0,
  "license": "MIT",
  "guide": "https://anyplot.ai/llms.txt"
}
Part of Circular Maze Puzzle on anyplot.ai.