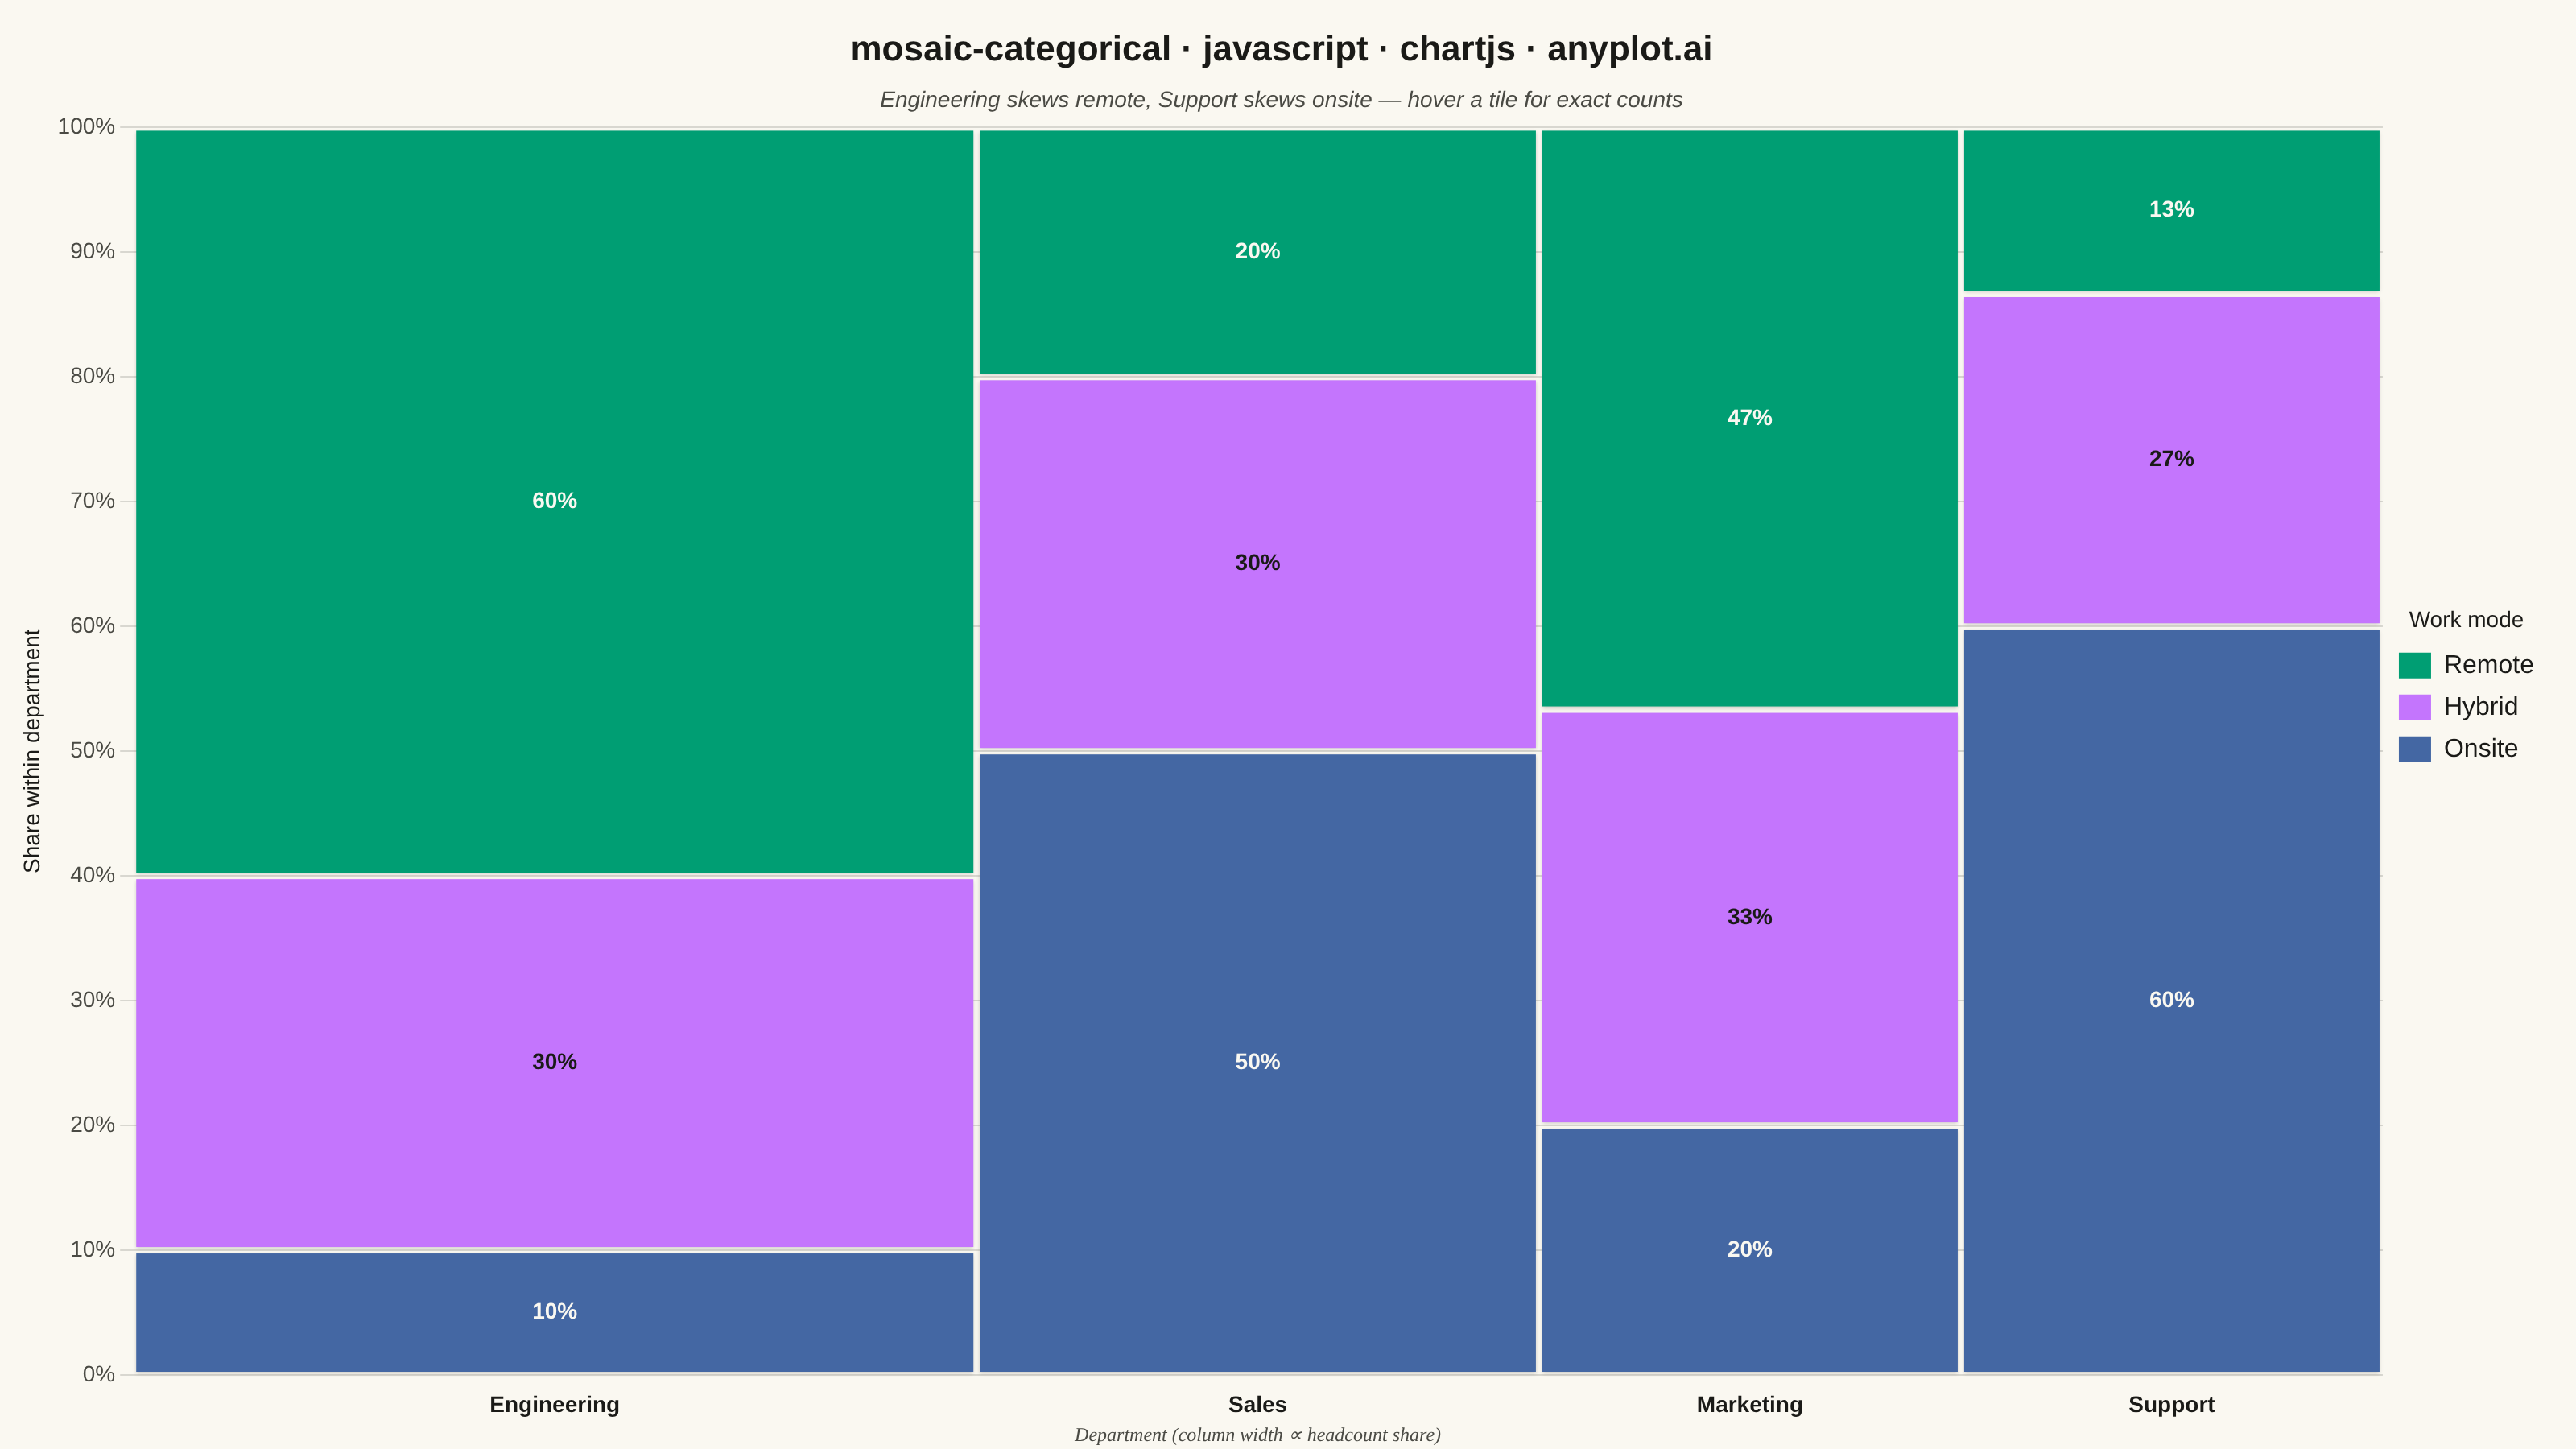
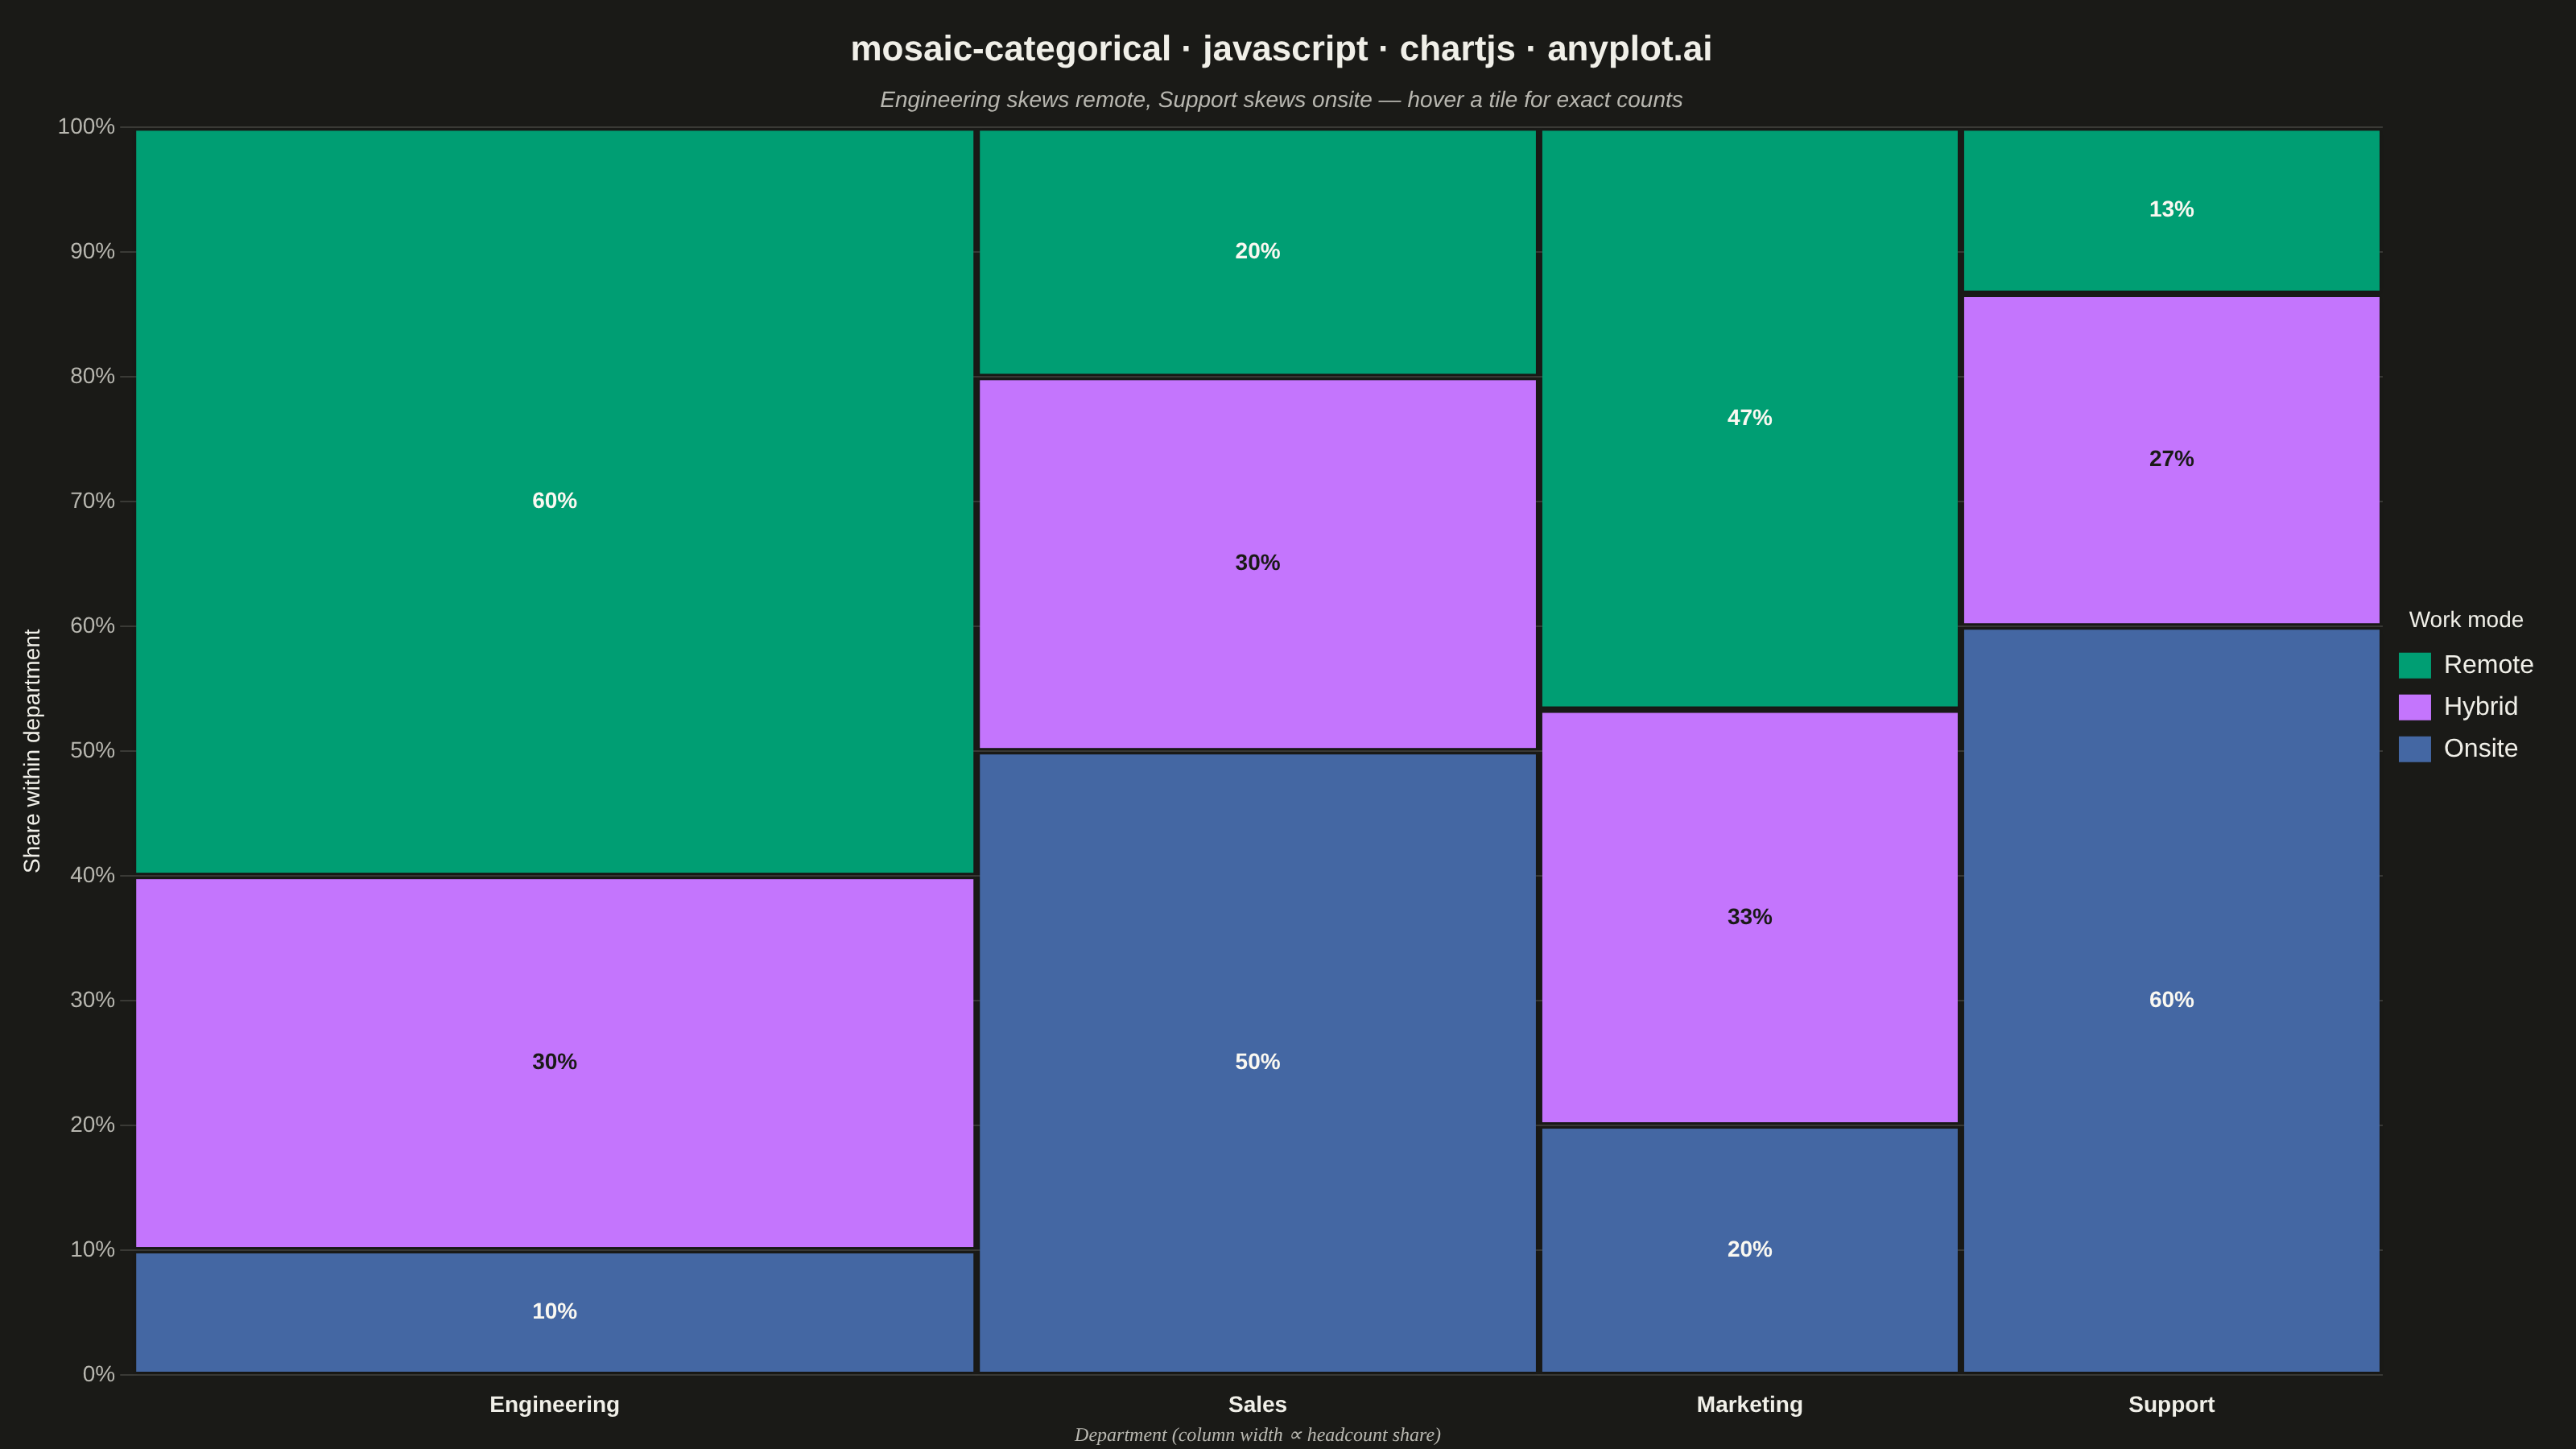
The same plot in 14 other libraries — JavaScript: D3.js, Apache ECharts, Highcharts, MUI X Charts; Python: Altair, Bokeh, lets-plot, Matplotlib, Plotly, plotnine, Pygal, Seaborn; R: ggplot2; Julia: Makie.jl. Compare all 15 side by side: Mosaic Plot for Categorical Association Analysis in Python, R, Julia and JavaScript.
A mosaic plot visualizes contingency tables by dividing a rectangular area into smaller rectangles whose areas are proportional to cell frequencies. This statistical visualization technique effectively shows relationships and associations between two categorical variables, making it easy to identify patterns, dependencies, and deviations from expected frequencies in cross-tabulated data.
// anyplot.ai
// mosaic-categorical: Mosaic Plot for Categorical Association Analysis
// Library: chartjs 4.4.7 | JavaScript 22.23.2
// Quality: 90/100 | Created: 2026-09-02

const t = window.ANYPLOT_TOKENS;

// --- Data (in-memory, deterministic) ----------------------------------------
// Survey of employees: department (category_1, column width) vs. work mode
// (category_2, stacked row height) — a classic contingency-table scenario.
const departments = ["Engineering", "Sales", "Marketing", "Support"];
const workModes = ["Remote", "Hybrid", "Onsite"];
const counts = [
  [180, 90, 30], // Engineering
  [40, 60, 100], // Sales
  [70, 50, 30], // Marketing
  [20, 40, 90], // Support
];

const rowTotals = counts.map((row) => row.reduce((sum, n) => sum + n, 0));
const grandTotal = rowTotals.reduce((sum, n) => sum + n, 0);

// Column edges as fractions of [0, 1] — width encodes the marginal share of
// each department among all employees.
const colEdges = [0];
rowTotals.forEach((total) =>
  colEdges.push(colEdges[colEdges.length - 1] + total / grandTotal),
);

// Stacked segment heights as fractions of [0, 1] within a column — height
// encodes the conditional share of each work mode within that department.
const segmentFractions = workModes.map((_, modeIndex) =>
  counts.map((row, deptIndex) => row[modeIndex] / rowTotals[deptIndex]),
);

// --- Mount -------------------------------------------------------------------
const canvas = document.createElement("canvas");
document.getElementById("container").appendChild(canvas);

// Relative luminance (WCAG-style) so a tile's value label always contrasts
// against that tile's own fill color, independent of the active theme.
function readableTextColor(hex) {
  const r = parseInt(hex.slice(1, 3), 16);
  const g = parseInt(hex.slice(3, 5), 16);
  const b = parseInt(hex.slice(5, 7), 16);
  const luminance = (0.299 * r + 0.587 * g + 0.114 * b) / 255;
  return luminance > 0.5 ? "#1A1A17" : "#FAF8F1";
}

// Hover state for the canvas hit-tested tooltip (populated by the mousemove
// listener below, consumed by mosaicPlugin's afterDraw).
let hoverTile = null;
let tileRects = [];

function pickTile(offsetX, offsetY, chartArea) {
  const { left, top, width, height } = chartArea;
  const xFrac = (offsetX - left) / width;
  const yFrac = (offsetY - top) / height;
  if (xFrac < 0 || xFrac > 1 || yFrac < 0 || yFrac > 1) return null;
  const colIndex = colEdges.findIndex(
    (edge, i) =>
      i < colEdges.length - 1 && xFrac >= edge && xFrac < colEdges[i + 1],
  );
  if (colIndex === -1) return null;
  let cursor = 0;
  for (let modeIndex = 0; modeIndex < workModes.length; modeIndex++) {
    const frac = segmentFractions[modeIndex][colIndex];
    if (yFrac >= cursor && yFrac < cursor + frac)
      return { colIndex, modeIndex };
    cursor += frac;
  }
  return null;
}

function drawTooltip(ctx, anchorX, anchorY, lines) {
  ctx.font = "bold 13px sans-serif";
  const headWidth = ctx.measureText(lines[0]).width;
  ctx.font = "12px sans-serif";
  const bodyWidth = Math.max(
    ...lines.slice(1).map((line) => ctx.measureText(line).width),
  );
  const boxWidth = Math.max(headWidth, bodyWidth) + 24;
  const lineHeight = 18;
  const boxHeight = lineHeight * lines.length + 16;
  const boxX = Math.min(anchorX + 14, canvas.clientWidth - boxWidth - 8);
  const boxY = Math.max(anchorY - boxHeight - 14, 8);

  ctx.save();
  ctx.shadowColor = "rgba(0, 0, 0, 0.25)";
  ctx.shadowBlur = 10;
  ctx.shadowOffsetY = 3;
  ctx.fillStyle = t.elevatedBg;
  const radius = 6;
  ctx.beginPath();
  ctx.roundRect(boxX, boxY, boxWidth, boxHeight, radius);
  ctx.fill();
  ctx.shadowColor = "transparent";
  ctx.strokeStyle = t.grid;
  ctx.lineWidth = 1;
  ctx.stroke();

  ctx.textAlign = "left";
  ctx.textBaseline = "top";
  ctx.fillStyle = t.ink;
  ctx.font = "bold 13px sans-serif";
  ctx.fillText(lines[0], boxX + 12, boxY + 8);
  ctx.fillStyle = t.inkSoft;
  ctx.font = "12px sans-serif";
  lines.slice(1).forEach((line, i) => {
    ctx.fillText(line, boxX + 12, boxY + 8 + lineHeight * (i + 1));
  });
  ctx.restore();
}

// --- Plugin: draw the mosaic tiles + department labels + hover tooltip -------
// Chart.js has no native mosaic/variable-width-bar controller, so the tiles are
// drawn directly onto the chart's own canvas from the finalized chartArea —
// this uses only core Chart.js plugin hooks (no external plugin package).
const tileGap = 4;
const mosaicPlugin = {
  id: "mosaicTiles",
  afterDraw(chart) {
    const { ctx, chartArea } = chart;
    const { left, top, width, height, bottom } = chartArea;

    tileRects = departments.map(() => []);
    ctx.save();
    departments.forEach((dept, colIndex) => {
      const xStart = left + colEdges[colIndex] * width;
      const xEnd = left + colEdges[colIndex + 1] * width;
      const colWidth = xEnd - xStart;

      let yCursor = top;
      workModes.forEach((mode, modeIndex) => {
        const segHeight = segmentFractions[modeIndex][colIndex] * height;
        const x = xStart + tileGap / 2;
        const y = yCursor + tileGap / 2;
        const w = Math.max(0, colWidth - tileGap);
        const h = Math.max(0, segHeight - tileGap);
        tileRects[colIndex][modeIndex] = { x, y, w, h };

        ctx.save();
        ctx.shadowColor = "rgba(0, 0, 0, 0.18)";
        ctx.shadowBlur = 5;
        ctx.shadowOffsetY = 2;
        ctx.fillStyle = t.palette[modeIndex];
        ctx.fillRect(x, y, w, h);
        ctx.restore();

        // Value label on tiles large enough to hold text without crowding.
        const sharePct = segmentFractions[modeIndex][colIndex] * 100;
        if (w > 64 && h > 32) {
          ctx.fillStyle = readableTextColor(t.palette[modeIndex]);
          ctx.font = "bold 14px sans-serif";
          ctx.textAlign = "center";
          ctx.textBaseline = "middle";
          ctx.fillText(`${Math.round(sharePct)}%`, x + w / 2, y + h / 2);
        }
        yCursor += segHeight;
      });
    });
    ctx.restore();

    // Department labels (category_1) directly below their column.
    ctx.save();
    ctx.fillStyle = t.ink;
    ctx.font = "bold 14px sans-serif";
    ctx.textAlign = "center";
    ctx.textBaseline = "top";
    departments.forEach((dept, colIndex) => {
      const xCenter =
        left + ((colEdges[colIndex] + colEdges[colIndex + 1]) / 2) * width;
      ctx.fillText(dept, xCenter, bottom + 12);
    });
    ctx.font = "italic 12px Georgia, serif";
    ctx.fillStyle = t.inkSoft;
    ctx.fillText(
      "Department (column width ∝ headcount share)",
      left + width / 2,
      bottom + 32,
    );
    ctx.restore();

    // Hover tooltip — real canvas hit-testing driven by native mouse events
    // (see the mousemove/mouseleave listeners below), not a static overlay.
    if (hoverTile) {
      const { colIndex, modeIndex } = hoverTile;
      const rect = tileRects[colIndex][modeIndex];
      const dept = departments[colIndex];
      const mode = workModes[modeIndex];
      const count = counts[colIndex][modeIndex];
      const deptShare = segmentFractions[modeIndex][colIndex] * 100;
      const totalShare = (count / grandTotal) * 100;
      drawTooltip(ctx, rect.x + rect.w / 2, rect.y, [
        `${dept} · ${mode}`,
        `${count} employees`,
        `${deptShare.toFixed(0)}% of ${dept}`,
        `${totalShare.toFixed(1)}% of all employees`,
      ]);
    }
  },
};

// --- Chart ---------------------------------------------------------------
// No dataset elements are rendered — the y scale supplies the percentage
// ruler and reserves layout space, while mosaicPlugin paints the tiles.
const chart = new Chart(canvas, {
  type: "bar",
  data: { labels: departments, datasets: [] },
  plugins: [mosaicPlugin],
  options: {
    responsive: true,
    maintainAspectRatio: false,
    animation: false,
    layout: { padding: { top: 8, right: 16, bottom: 46, left: 8 } },
    plugins: {
      title: {
        display: true,
        text: "mosaic-categorical · javascript · chartjs · anyplot.ai",
        color: t.ink,
        font: { size: 22 },
      },
      subtitle: {
        display: true,
        text: "Engineering skews remote, Support skews onsite — hover a tile for exact counts",
        color: t.inkSoft,
        font: { size: 14, style: "italic" },
        padding: { bottom: 8 },
      },
      legend: {
        position: "right",
        labels: {
          color: t.ink,
          font: { size: 16 },
          boxWidth: 20,
          generateLabels: () =>
            workModes.map((mode, i) => ({
              text: mode,
              fillStyle: t.palette[i],
              strokeStyle: t.palette[i],
              lineWidth: 0,
            })),
        },
        title: {
          display: true,
          text: "Work mode",
          color: t.ink,
          font: { size: 14 },
        },
        onClick: () => {},
      },
      tooltip: { enabled: false },
    },
    scales: {
      x: { display: false },
      y: {
        min: 0,
        max: 1,
        ticks: {
          color: t.inkSoft,
          font: { size: 14 },
          callback: (value) => `${Math.round(value * 100)}%`,
        },
        grid: { color: t.grid },
        border: { display: false },
        title: {
          display: true,
          text: "Share within department",
          color: t.ink,
          font: { size: 14 },
        },
      },
    },
  },
});

// --- Interactivity: canvas hit-tested hover tooltip --------------------------
// Chart.js has no data points to hover (datasets: [] — see mosaicPlugin above),
// so genuine tooltip interactivity is wired by hand: translate mouse position
// into chart-area fractions, resolve the tile under the cursor, and redraw via
// the plugin's afterDraw. Never fires during the static PNG screenshot, since
// no synthetic mouse event is dispatched there — only in the interactive HTML.
canvas.addEventListener("mousemove", (event) => {
  const tile = pickTile(event.offsetX, event.offsetY, chart.chartArea);
  const changed = JSON.stringify(tile) !== JSON.stringify(hoverTile);
  if (changed) {
    hoverTile = tile;
    canvas.style.cursor = tile ? "pointer" : "default";
    chart.draw();
  }
});
canvas.addEventListener("mouseleave", () => {
  if (hoverTile) {
    hoverTile = null;
    canvas.style.cursor = "default";
    chart.draw();
  }
});
Runnable source as JSON, for any HTTP client: https://api.anyplot.ai/specs/mosaic-categorical/chartjs/code. Any spec id and library id listed in llms-full.txt fit the same URL shape; every URL below is complete and callable.
{
  "spec_id": "mosaic-categorical",
  "language": "javascript",
  "library": "chartjs",
  "page": "https://anyplot.ai/mosaic-categorical/javascript/chartjs",
  "hub": "https://anyplot.ai/mosaic-categorical",
  "code_json": "https://api.anyplot.ai/specs/mosaic-categorical/chartjs/code",
  "spec_json": "https://api.anyplot.ai/specs/mosaic-categorical",
  "render_light_png": "https://storage.googleapis.com/anyplot-images/plots/mosaic-categorical/javascript/chartjs/plot-light.png",
  "render_dark_png": "https://storage.googleapis.com/anyplot-images/plots/mosaic-categorical/javascript/chartjs/plot-dark.png",
  "interactive_light_html": "https://storage.googleapis.com/anyplot-images/plots/mosaic-categorical/javascript/chartjs/plot-light.html",
  "interactive_dark_html": "https://storage.googleapis.com/anyplot-images/plots/mosaic-categorical/javascript/chartjs/plot-dark.html",
  "quality_score": 90.0,
  "license": "MIT",
  "guide": "https://anyplot.ai/llms.txt"
}
Part of Mosaic Plot for Categorical Association Analysis on anyplot.ai.