The same plot in 14 other libraries — JavaScript: Chart.js, Apache ECharts, Highcharts, MUI X Charts; Python: Altair, Bokeh, lets-plot, Matplotlib, Plotly, plotnine, Pygal, Seaborn; R: ggplot2; Julia: Makie.jl. Compare all 15 side by side: Mosaic Plot for Categorical Association Analysis in Python, R, Julia and JavaScript.
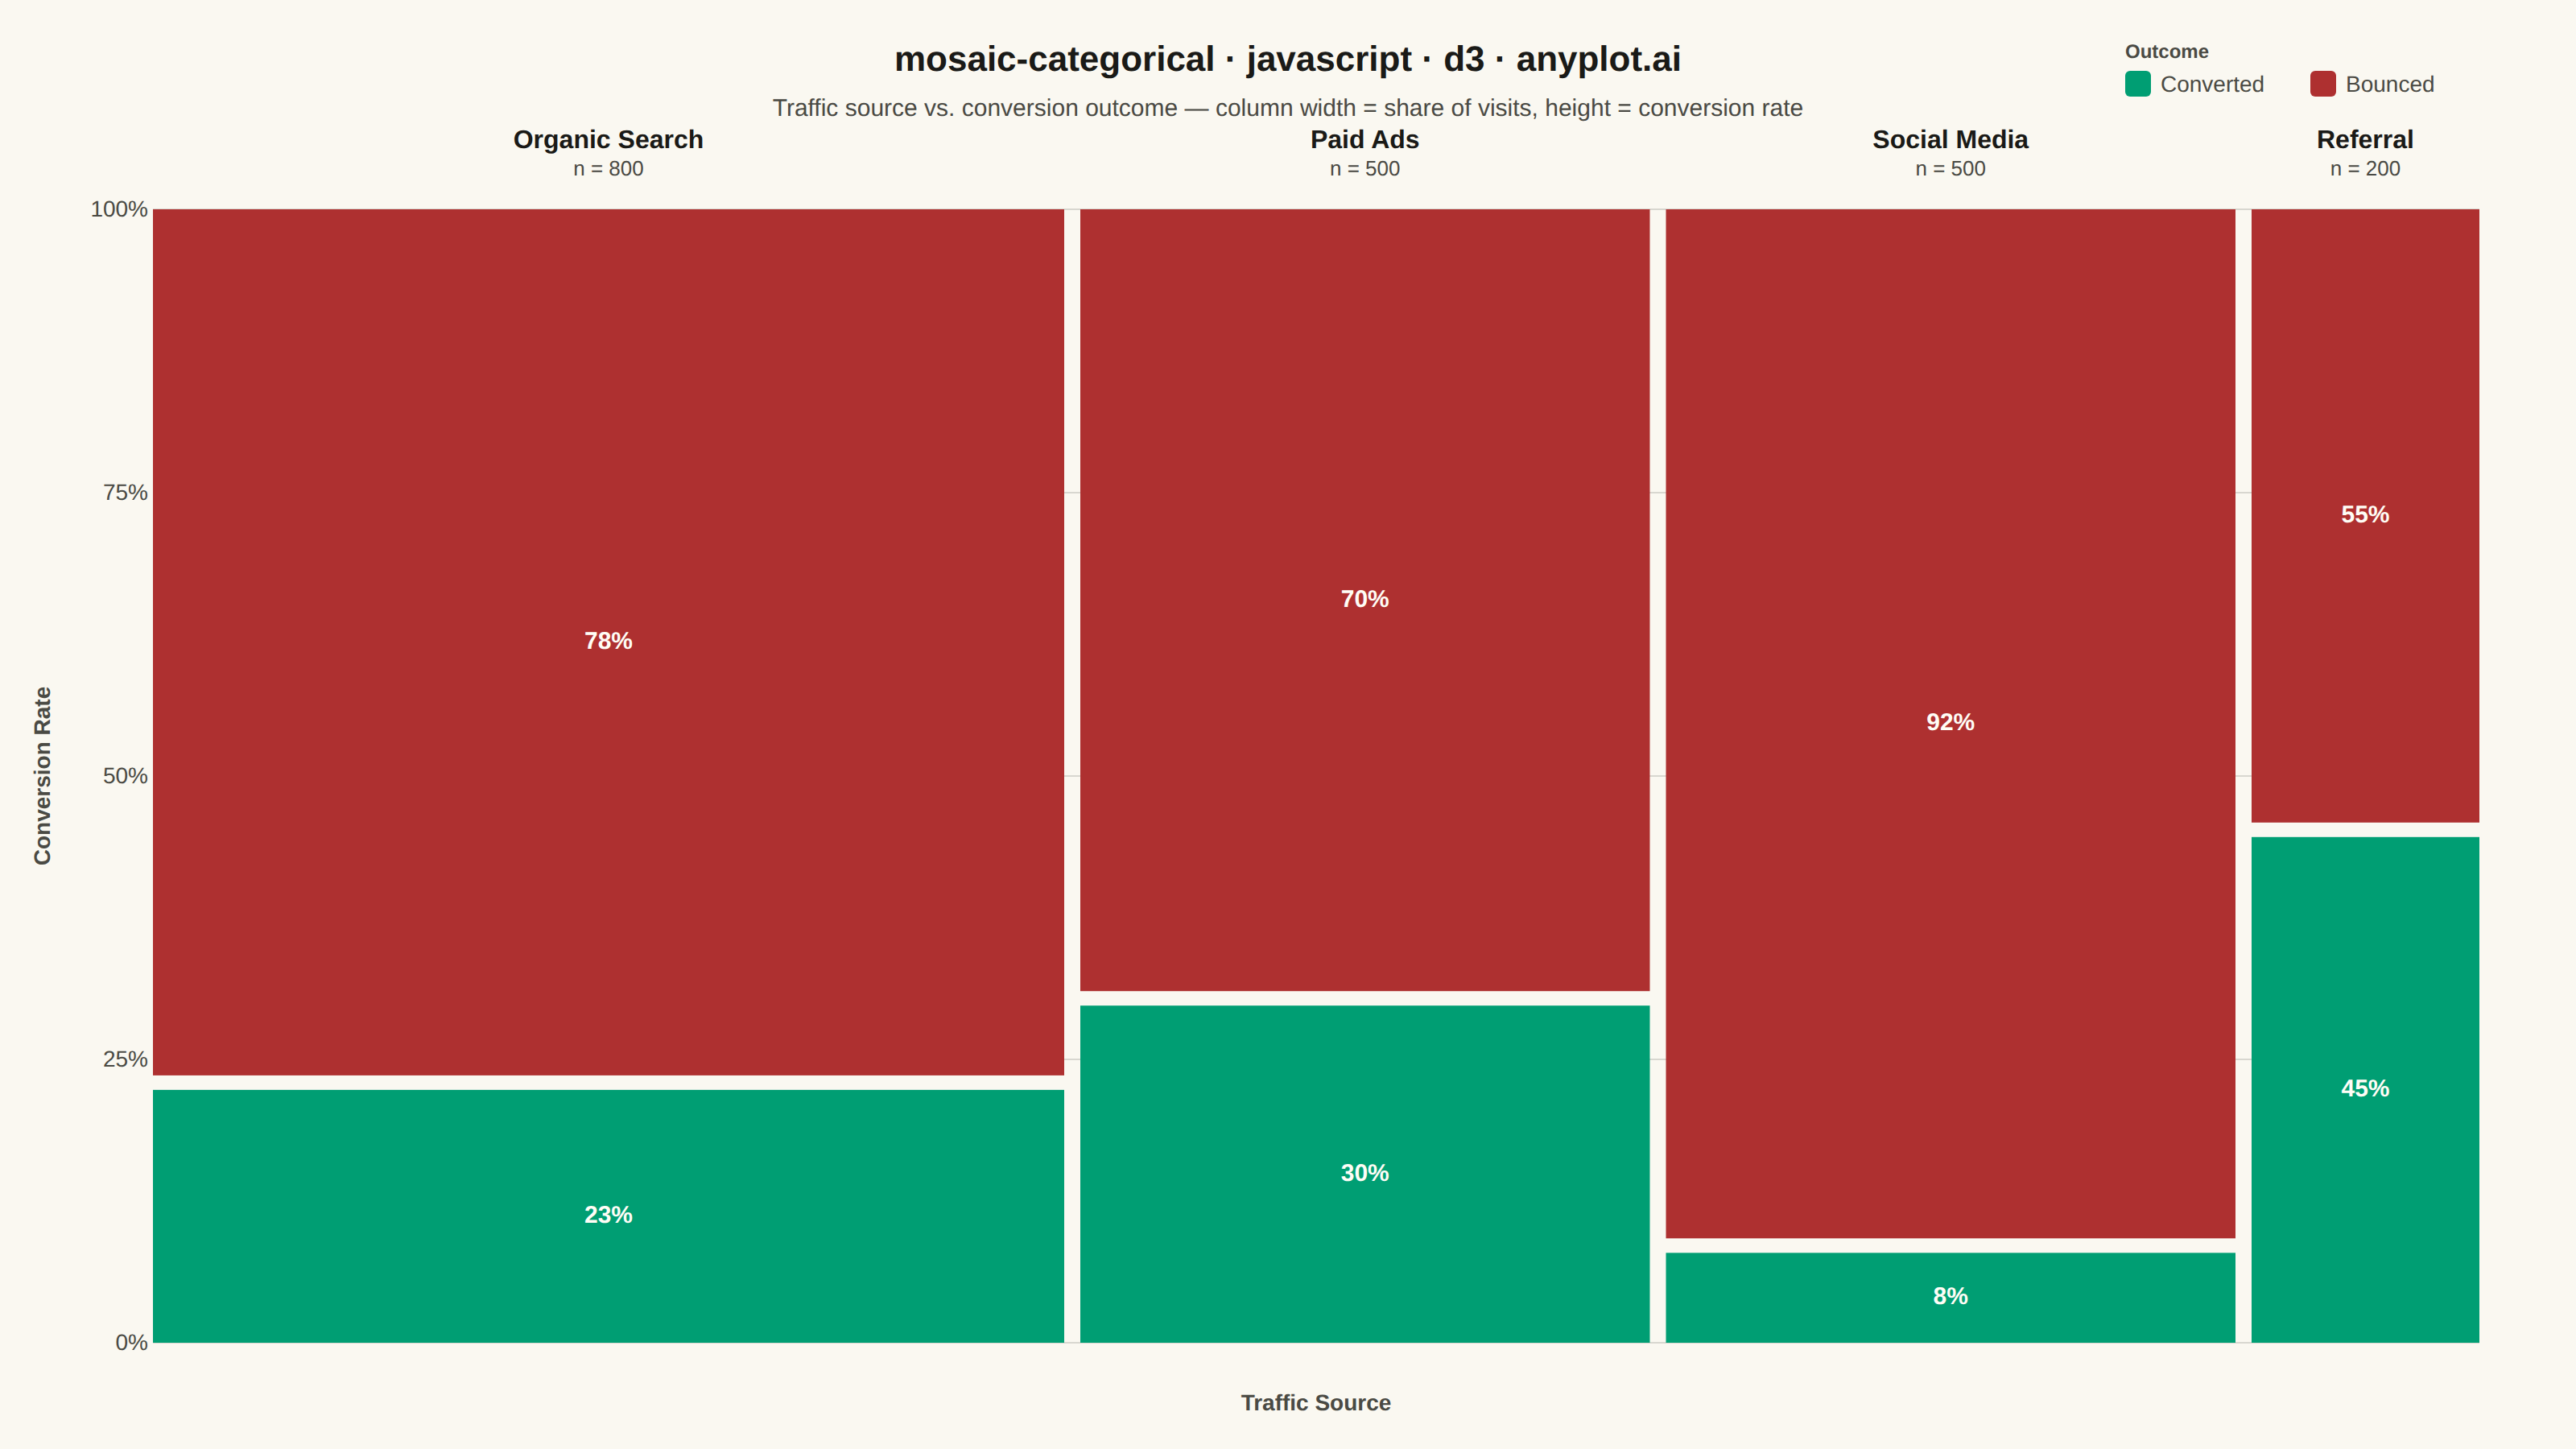
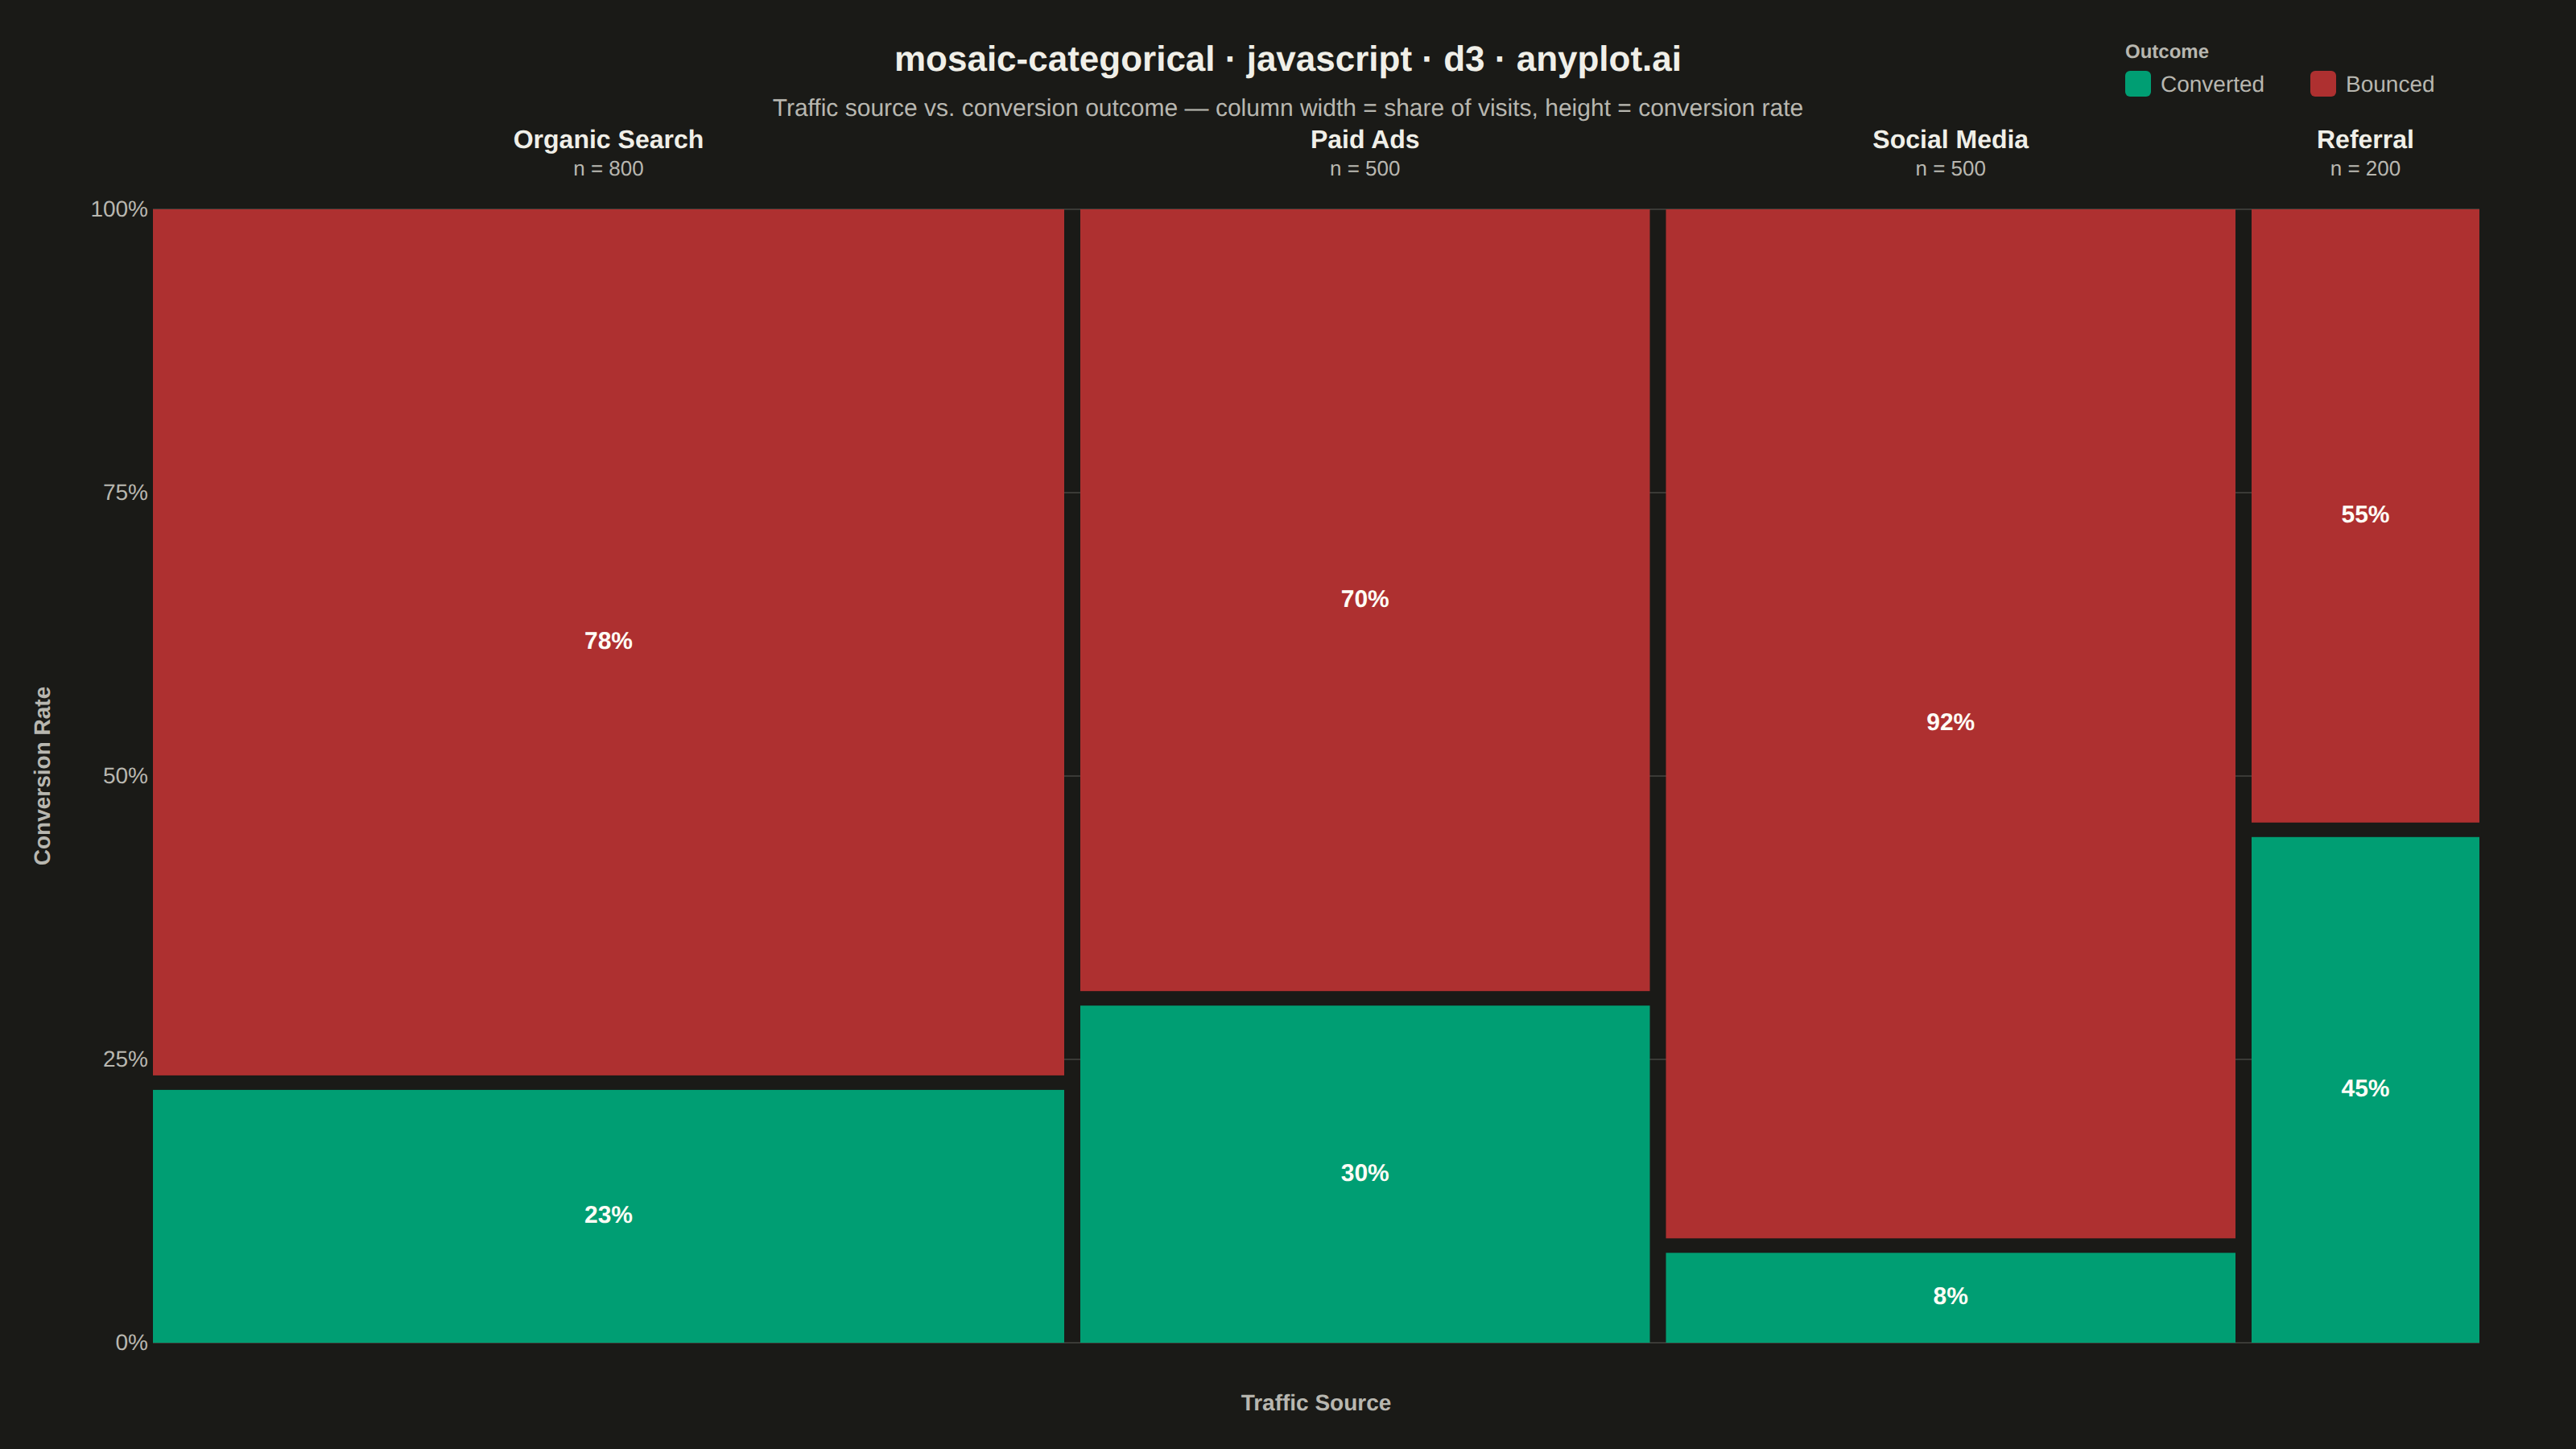
A mosaic plot visualizes contingency tables by dividing a rectangular area into smaller rectangles whose areas are proportional to cell frequencies. This statistical visualization technique effectively shows relationships and associations between two categorical variables, making it easy to identify patterns, dependencies, and deviations from expected frequencies in cross-tabulated data.
// anyplot.ai
// mosaic-categorical: Mosaic Plot for Categorical Association Analysis
// Library: d3 7.9.0 | JavaScript 22.23.2
// Quality: 89/100 | Created: 2026-09-02

const t = window.ANYPLOT_TOKENS;
const { width, height } = window.ANYPLOT_SIZE;
const margin = { top: 130, right: 60, bottom: 66, left: 95 };
const iw = width - margin.left - margin.right;
const ih = height - margin.top - margin.bottom;

// --- Data (in-memory, deterministic) ----------------------------------------
// Web-traffic acquisition: visits by source, cross-tabulated against outcome.
const sources = ["Organic Search", "Paid Ads", "Social Media", "Referral"];
const outcomes = ["Converted", "Bounced"];
const counts = {
  "Organic Search": { Converted: 180, Bounced: 620 },
  "Paid Ads": { Converted: 150, Bounced: 350 },
  "Social Media": { Converted: 40, Bounced: 460 },
  Referral: { Converted: 90, Bounced: 110 },
};

const sourceTotals = sources.map((s) => counts[s].Converted + counts[s].Bounced);
const grandTotal = sourceTotals.reduce((a, b) => a + b, 0);
const color = d3.scaleOrdinal().domain(outcomes).range([t.palette[0], t.palette[4]]);
const LABEL_ON_FILL = "#FFFDF6"; // fixed light label ink for text on saturated data fills, both themes

// --- SVG mount ----------------------------------------------------------------
const svg = d3.select("#container").append("svg").attr("width", width).attr("height", height);
const g = svg.append("g").attr("transform", `translate(${margin.left},${margin.top})`);

// --- Column layout (widths = marginal share of category_1) -------------------
const gapX = 10;
const usableW = iw - gapX * (sources.length - 1);
let xCursor = 0;
const columns = sources.map((source, i) => {
  const colWidth = usableW * (sourceTotals[i] / grandTotal);
  const col = { source, x: xCursor, width: colWidth, total: sourceTotals[i] };
  xCursor += colWidth + gapX;
  return col;
});

// --- Reference y-axis (conditional proportion, shared across columns) --------
const y = d3.scaleLinear().domain([0, 1]).range([ih, 0]);
const yAxis = g.append("g").call(
  d3.axisLeft(y)
    .tickValues([0, 0.25, 0.5, 0.75, 1])
    .tickFormat(d3.format(".0%"))
    .tickSize(-iw)
);
yAxis.selectAll("text").attr("fill", t.inkSoft).style("font-size", "14px");
yAxis.selectAll("line").attr("stroke", t.grid);
yAxis.select(".domain").remove();

// --- Y-axis title (identifies the conditional-proportion encoding) -----------
g.append("text")
  .attr("transform", `translate(${-64},${ih / 2}) rotate(-90)`)
  .attr("text-anchor", "middle")
  .attr("fill", t.inkSoft)
  .style("font-size", "14px")
  .style("font-weight", "600")
  .text("Conversion Rate");

// --- X-axis title (identifies the column-width categorical variable) ---------
g.append("text")
  .attr("x", iw / 2)
  .attr("y", ih + 42)
  .attr("text-anchor", "middle")
  .attr("fill", t.inkSoft)
  .style("font-size", "14px")
  .style("font-weight", "600")
  .text("Traffic Source");

// --- Rectangles (heights = conditional proportion within column) -------------
const gapY = 6;
const usableH = ih - gapY;

for (const col of columns) {
  const convertedFrac = counts[col.source].Converted / col.total;
  const bouncedFrac = 1 - convertedFrac;
  const convertedH = usableH * convertedFrac;
  const bouncedH = usableH * bouncedFrac;

  const cell = g.append("g").attr("transform", `translate(${col.x},0)`);

  // Converted — anchored at the bottom
  cell
    .append("rect")
    .attr("x", 0)
    .attr("y", ih - convertedH)
    .attr("width", col.width)
    .attr("height", convertedH)
    .attr("fill", color("Converted"));

  // Bounced — stacked above, separated by a gap
  cell
    .append("rect")
    .attr("x", 0)
    .attr("y", 0)
    .attr("width", col.width)
    .attr("height", bouncedH - gapY / 2)
    .attr("fill", color("Bounced"));

  // Percentage labels — only where the segment is tall enough to hold text
  if (convertedH > 32) {
    cell
      .append("text")
      .attr("x", col.width / 2)
      .attr("y", ih - convertedH / 2)
      .attr("text-anchor", "middle")
      .attr("dominant-baseline", "middle")
      .attr("fill", LABEL_ON_FILL)
      .style("font-size", "15px")
      .style("font-weight", "600")
      .text(d3.format(".0%")(convertedFrac));
  }
  if (bouncedH - gapY / 2 > 32) {
    cell
      .append("text")
      .attr("x", col.width / 2)
      .attr("y", (bouncedH - gapY / 2) / 2)
      .attr("text-anchor", "middle")
      .attr("dominant-baseline", "middle")
      .attr("fill", LABEL_ON_FILL)
      .style("font-size", "15px")
      .style("font-weight", "600")
      .text(d3.format(".0%")(bouncedFrac));
  }

  // Column header — source name + sample size, wrapped over two lines
  const header = g
    .append("text")
    .attr("x", col.x + col.width / 2)
    .attr("y", -38)
    .attr("text-anchor", "middle")
    .attr("fill", t.ink)
    .style("font-size", "16px")
    .style("font-weight", "600");
  header.append("tspan").attr("x", col.x + col.width / 2).attr("dy", 0).text(col.source);
  header
    .append("tspan")
    .attr("x", col.x + col.width / 2)
    .attr("dy", "1.3em")
    .attr("fill", t.inkSoft)
    .style("font-size", "13px")
    .style("font-weight", "400")
    .text(`n = ${col.total.toLocaleString()}`);
}

// --- Legend --------------------------------------------------------------------
const legend = svg.append("g").attr("transform", `translate(${width - margin.right - 220},44)`);
legend
  .append("text")
  .attr("x", 0)
  .attr("y", -8)
  .attr("fill", t.inkSoft)
  .style("font-size", "12px")
  .style("font-weight", "600")
  .text("Outcome");
outcomes.forEach((outcome, i) => {
  const row = legend.append("g").attr("transform", `translate(${i * 115},0)`);
  row.append("rect").attr("width", 16).attr("height", 16).attr("rx", 3).attr("fill", color(outcome));
  row
    .append("text")
    .attr("x", 22)
    .attr("y", 13)
    .attr("fill", t.inkSoft)
    .style("font-size", "14px")
    .text(outcome);
});

// --- Title -----------------------------------------------------------------
svg
  .append("text")
  .attr("x", width / 2)
  .attr("y", 44)
  .attr("text-anchor", "middle")
  .attr("fill", t.ink)
  .style("font-size", "22px")
  .style("font-weight", "600")
  .text("mosaic-categorical · javascript · d3 · anyplot.ai");

svg
  .append("text")
  .attr("x", width / 2)
  .attr("y", 72)
  .attr("text-anchor", "middle")
  .attr("fill", t.inkSoft)
  .style("font-size", "15px")
  .text("Traffic source vs. conversion outcome — column width = share of visits, height = conversion rate");
Runnable source as JSON, for any HTTP client: https://api.anyplot.ai/specs/mosaic-categorical/d3/code. Any spec id and library id listed in llms-full.txt fit the same URL shape; every URL below is complete and callable.
{
  "spec_id": "mosaic-categorical",
  "language": "javascript",
  "library": "d3",
  "page": "https://anyplot.ai/mosaic-categorical/javascript/d3",
  "hub": "https://anyplot.ai/mosaic-categorical",
  "code_json": "https://api.anyplot.ai/specs/mosaic-categorical/d3/code",
  "spec_json": "https://api.anyplot.ai/specs/mosaic-categorical",
  "render_light_png": "https://storage.googleapis.com/anyplot-images/plots/mosaic-categorical/javascript/d3/plot-light.png",
  "render_dark_png": "https://storage.googleapis.com/anyplot-images/plots/mosaic-categorical/javascript/d3/plot-dark.png",
  "interactive_light_html": "https://storage.googleapis.com/anyplot-images/plots/mosaic-categorical/javascript/d3/plot-light.html",
  "interactive_dark_html": "https://storage.googleapis.com/anyplot-images/plots/mosaic-categorical/javascript/d3/plot-dark.html",
  "quality_score": 89.0,
  "license": "MIT",
  "guide": "https://anyplot.ai/llms.txt"
}
Part of Mosaic Plot for Categorical Association Analysis on anyplot.ai.