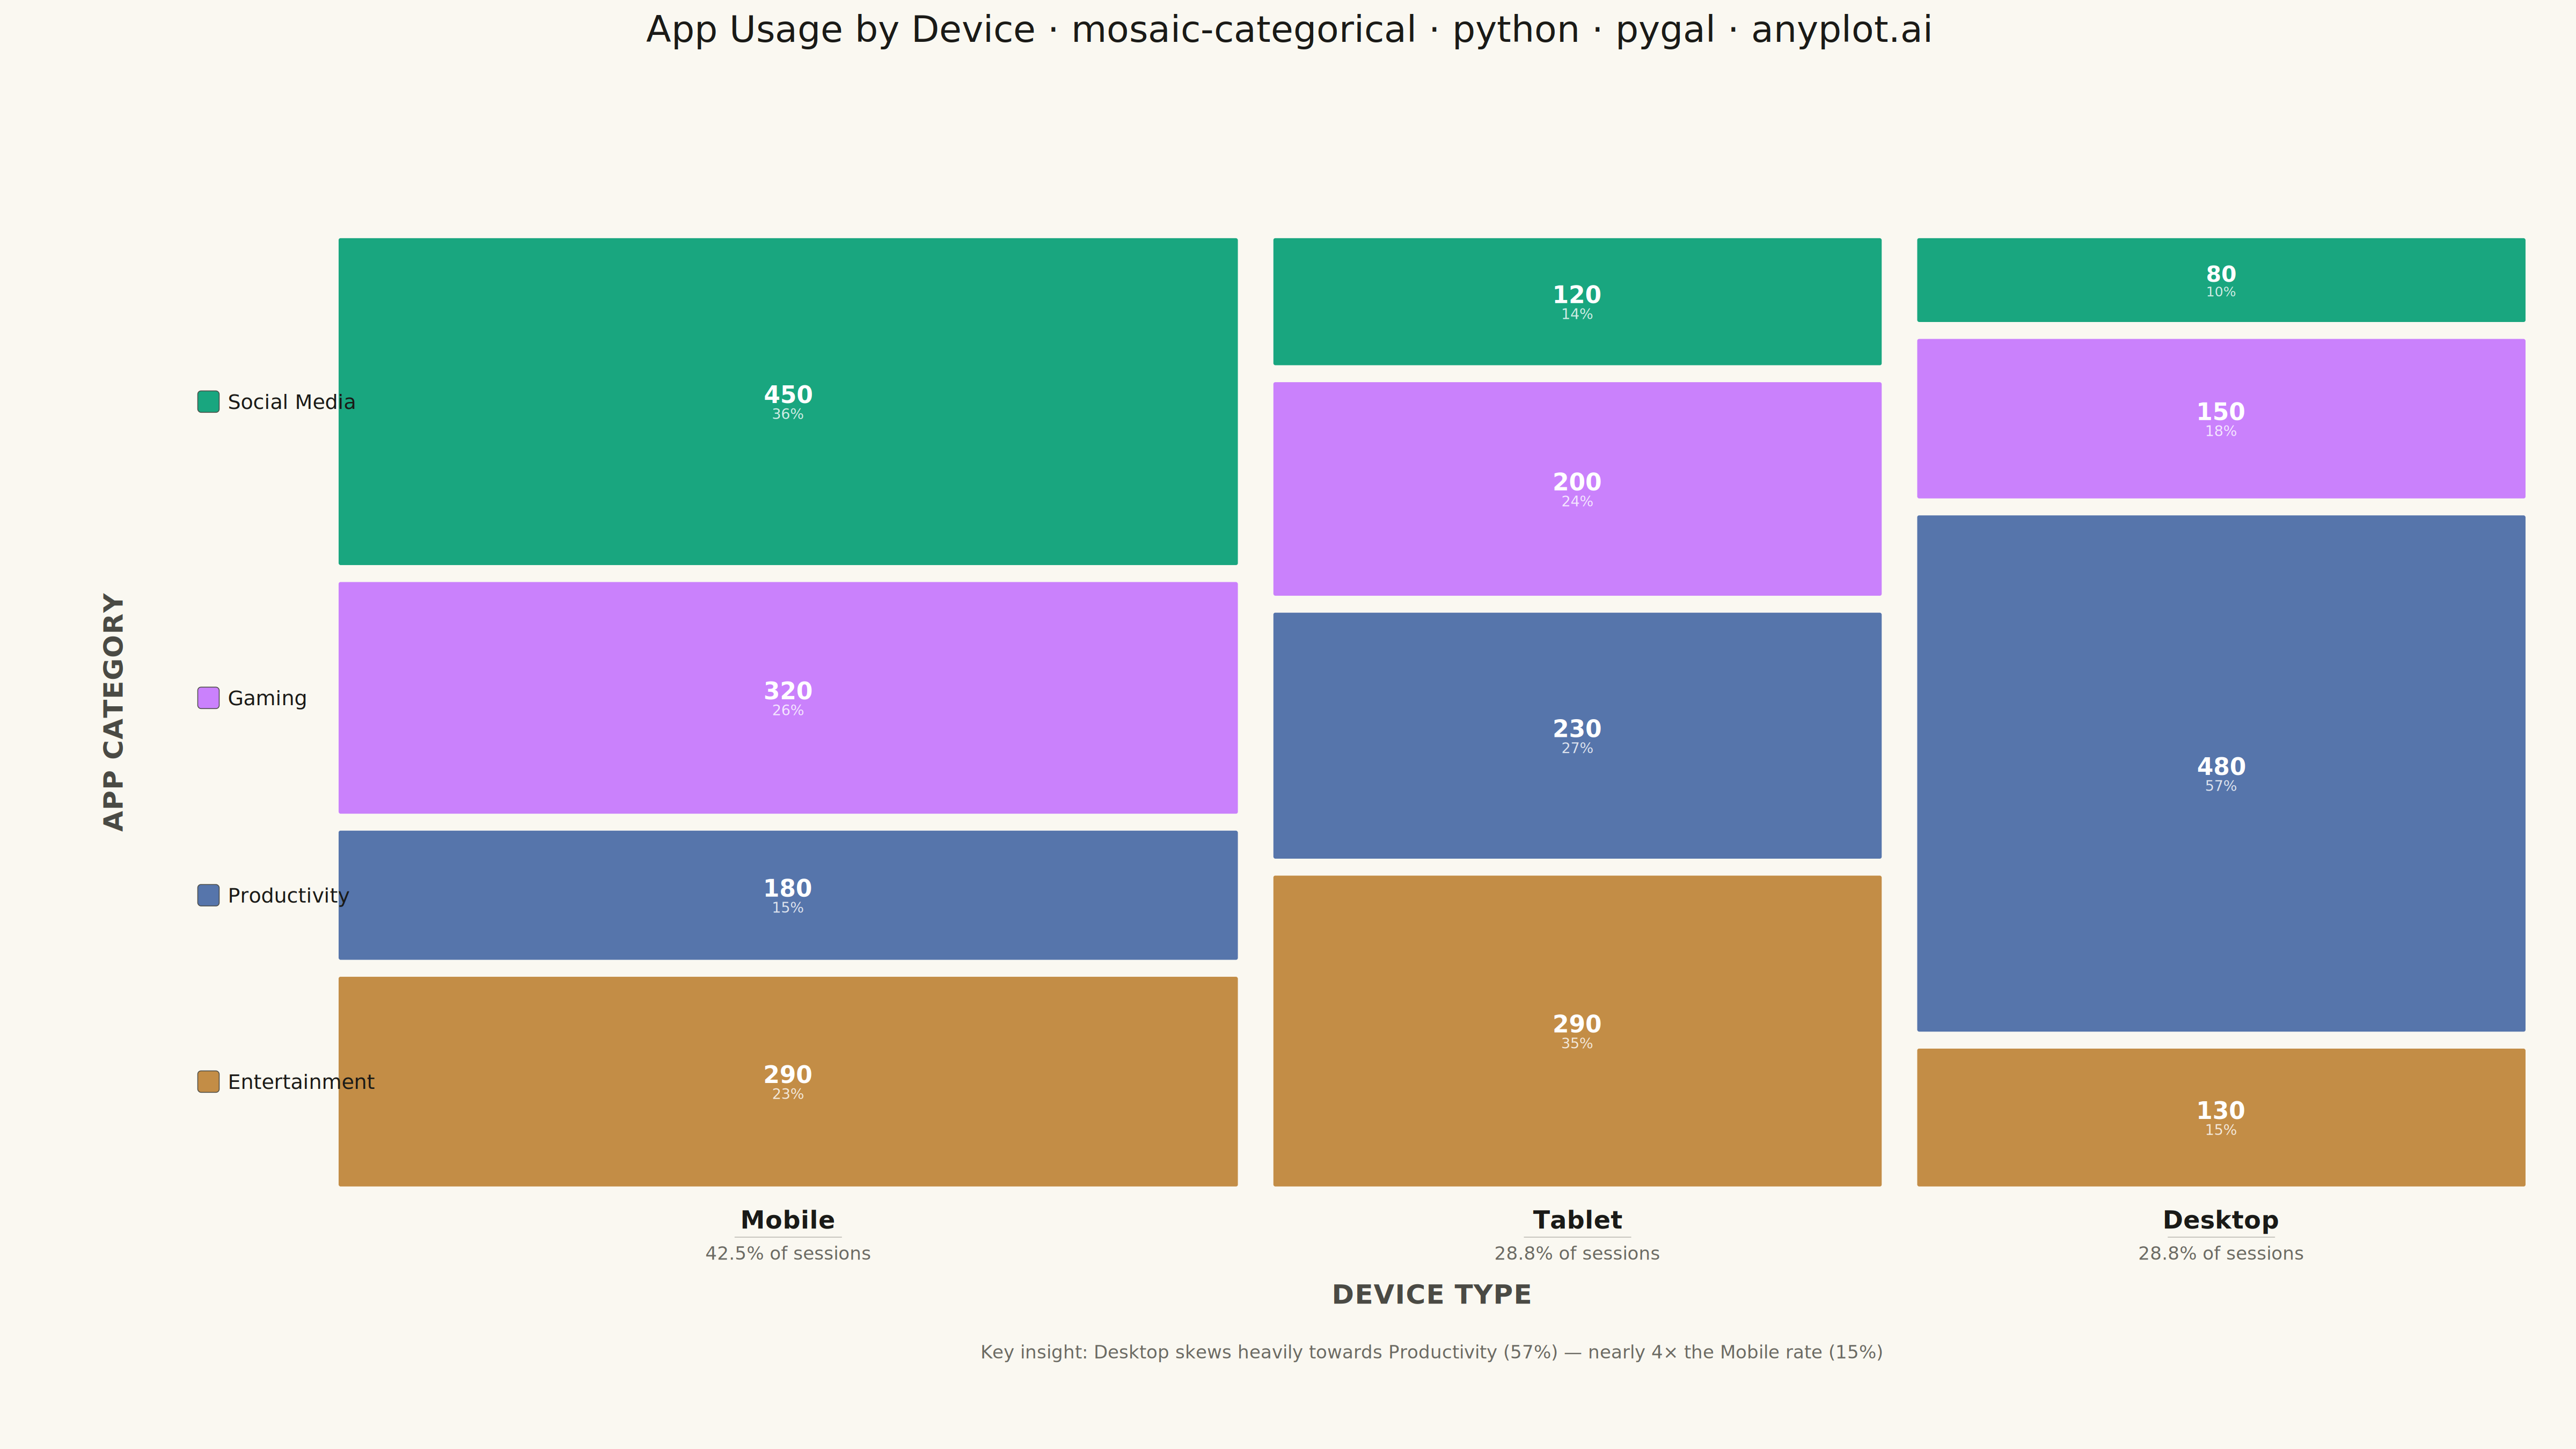
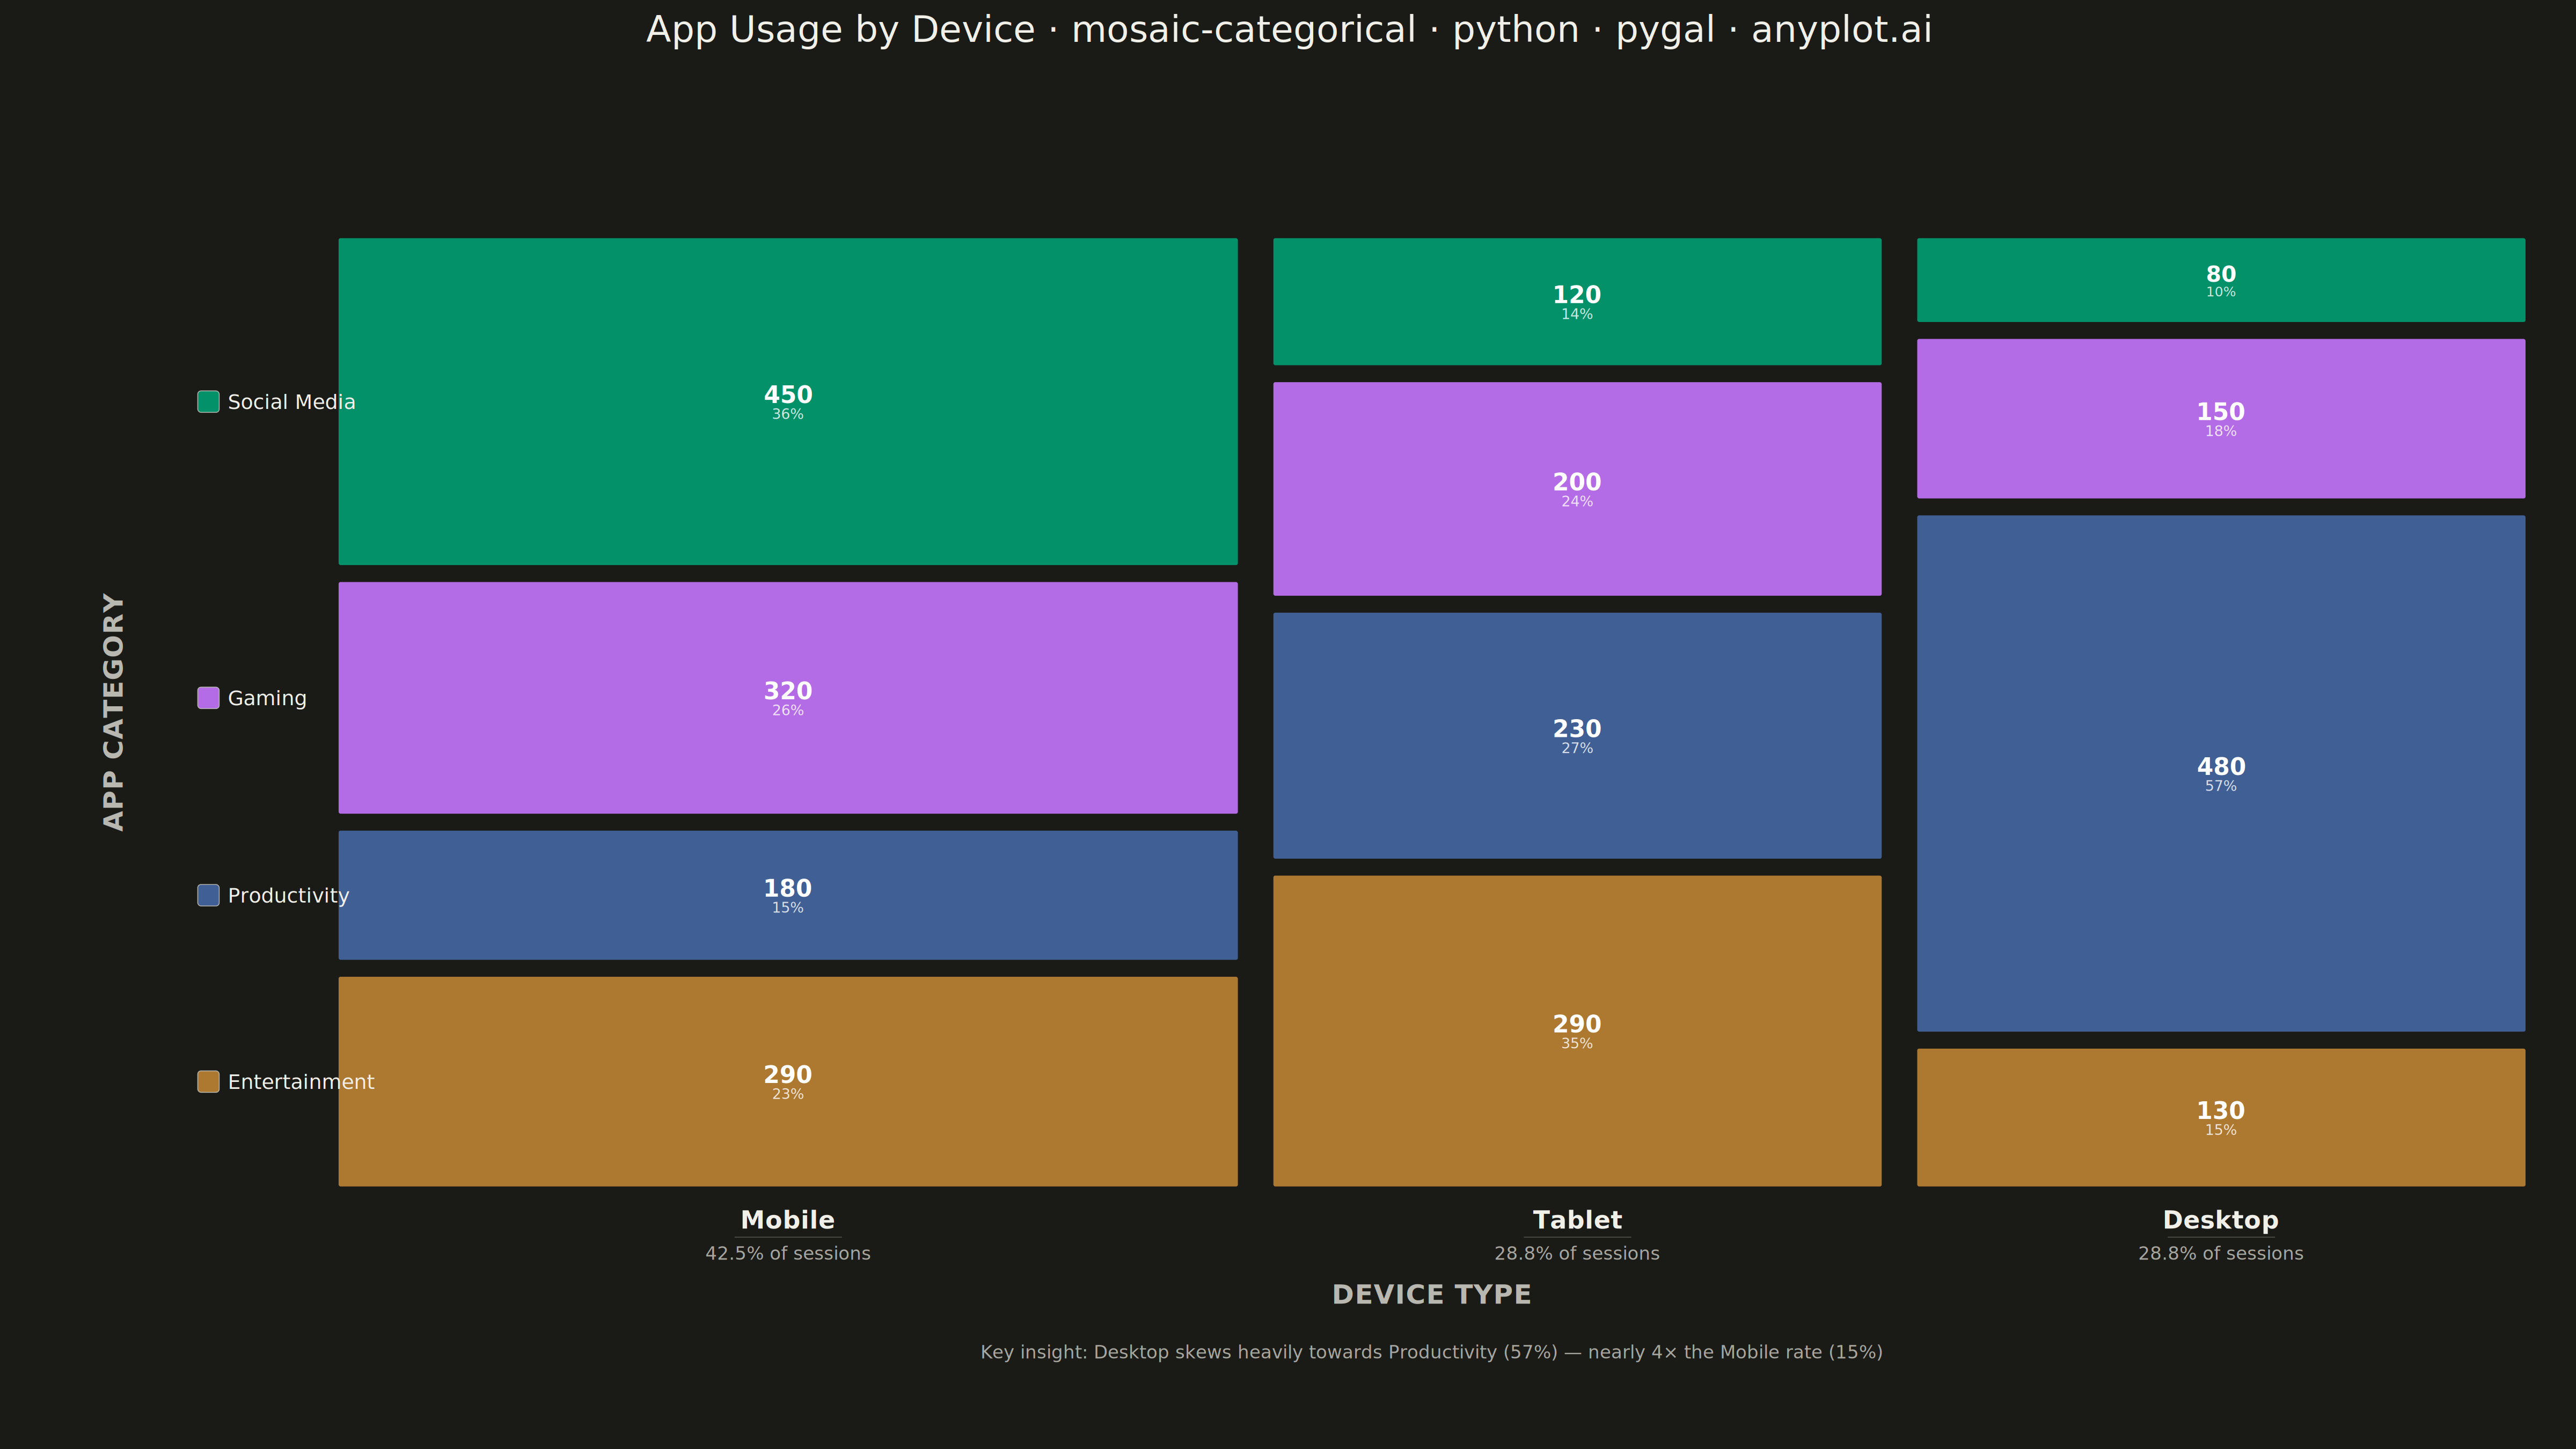
A mosaic plot visualizes contingency tables by dividing a rectangular area into smaller rectangles whose areas are proportional to cell frequencies. This statistical visualization technique effectively shows relationships and associations between two or more categorical variables, making it easy to identify patterns, dependencies, and deviations from expected frequencies in cross-tabulated data.
""" anyplot.ai
mosaic-categorical: Mosaic Plot for Categorical Association Analysis
Library: pygal 3.1.0 | Python 3.13.13
Quality: 89/100 | Updated: 2026-05-19
"""

import os
import sys

import numpy as np


# Theme tokens
THEME = os.getenv("ANYPLOT_THEME", "light")
PAGE_BG = "#FAF8F1" if THEME == "light" else "#1A1A17"
ELEVATED_BG = "#FFFDF6" if THEME == "light" else "#242420"
INK = "#1A1A17" if THEME == "light" else "#F0EFE8"
INK_SOFT = "#4A4A44" if THEME == "light" else "#B8B7B0"
INK_MUTED = "#6B6A63" if THEME == "light" else "#A8A79F"
RULE = "rgba(26,26,23,0.15)" if THEME == "light" else "rgba(240,239,232,0.15)"

# Okabe-Ito palette — first series is always brand green
IMPRINT = ("#009E73", "#C475FD", "#4467A3", "#BD8233")

# Temporarily remove current directory from path to avoid pygal.py name collision
_cwd = sys.path[0] if sys.path[0] else "."
if _cwd in sys.path:
    sys.path.remove(_cwd)

from pygal.graph.graph import Graph
from pygal.style import Style


sys.path.insert(0, _cwd)


class MosaicPlot(Graph):
    def __init__(self, *args, **kwargs):
        self.contingency_data = kwargs.pop("contingency_data", {})
        self.row_labels = kwargs.pop("row_labels", [])
        self.col_labels = kwargs.pop("col_labels", [])
        self.cell_colors = kwargs.pop("cell_colors", list(IMPRINT))
        self.gap_ratio = kwargs.pop("gap_ratio", 0.02)
        self.ink = kwargs.pop("ink", INK)
        self.ink_soft = kwargs.pop("ink_soft", INK_SOFT)
        self.ink_muted = kwargs.pop("ink_muted", INK_MUTED)
        self.page_bg = kwargs.pop("page_bg", PAGE_BG)
        self.rule = kwargs.pop("rule", RULE)
        super().__init__(*args, **kwargs)

    def _plot(self):
        if not self.contingency_data or not self.row_labels or not self.col_labels:
            return

        n_rows = len(self.row_labels)
        n_cols = len(self.col_labels)

        col_totals = [
            sum(self.contingency_data.get((row, col), 0) for row in self.row_labels) for col in self.col_labels
        ]
        grand_total = sum(col_totals)
        if grand_total == 0:
            return

        col_proportions = [t / grand_total for t in col_totals]

        plot_width = self.view.width
        plot_height = self.view.height

        margin_left = 440
        margin_right = 80
        margin_top = 100
        margin_bottom = 380

        available_width = plot_width - margin_left - margin_right
        available_height = plot_height - margin_top - margin_bottom

        col_gap = available_width * self.gap_ratio
        row_gap = available_height * self.gap_ratio
        drawing_width = available_width - col_gap * (n_cols - 1)
        drawing_height = available_height - row_gap * (n_rows - 1)

        x_offset = self.view.x(0) + margin_left
        y_offset = self.view.y(n_rows) + margin_top

        plot_node = self.nodes["plot"]
        mosaic_group = self.svg.node(plot_node, class_="mosaic-plot")

        current_x = x_offset
        for j, col in enumerate(self.col_labels):
            col_width = drawing_width * col_proportions[j]
            col_total = col_totals[j]
            if col_total == 0:
                current_x += col_width + col_gap
                continue

            row_values = [self.contingency_data.get((row, col), 0) for row in self.row_labels]
            row_proportions = [v / col_total for v in row_values]

            current_y = y_offset
            for i, row in enumerate(self.row_labels):
                cell_height = drawing_height * row_proportions[i]
                if cell_height < 1:
                    current_y += cell_height + row_gap
                    continue

                color = self.cell_colors[i % len(self.cell_colors)]
                freq = self.contingency_data.get((row, col), 0)
                pct = row_proportions[i] * 100

                rect = self.svg.node(
                    mosaic_group,
                    "rect",
                    x=current_x,
                    y=current_y,
                    width=max(col_width, 1),
                    height=max(cell_height, 1),
                    rx=6,
                    ry=6,
                )
                rect.set("fill", color)
                rect.set("stroke", self.page_bg)
                rect.set("stroke-width", "5")
                rect.set("fill-opacity", "0.90")

                # SVG tooltip for interactive HTML — pygal-native feature
                tooltip = self.svg.node(rect, "title")
                tooltip.text = f"{row} · {col}: {freq:,} ({pct:.1f}% of {col} users)"

                if cell_height > 80 and col_width > 110:
                    label_size = min(44, int(min(col_width, cell_height) * 0.26))
                    text_x = current_x + col_width / 2

                    if cell_height > 130 and col_width > 160:
                        # Dual label: count (bold, upper) + percentage (smaller, lower)
                        count_node = self.svg.node(
                            mosaic_group, "text", x=text_x, y=current_y + cell_height / 2 - label_size * 0.28
                        )
                        count_node.set("text-anchor", "middle")
                        count_node.set("dominant-baseline", "middle")
                        count_node.set("fill", "#ffffff")
                        count_node.set(
                            "style",
                            f"font-size:{label_size}px;font-weight:700;font-family:sans-serif;letter-spacing:-0.5px",
                        )
                        count_node.text = f"{freq:,}"

                        pct_size = max(int(label_size * 0.62), 22)
                        pct_node = self.svg.node(
                            mosaic_group, "text", x=text_x, y=current_y + cell_height / 2 + label_size * 0.52
                        )
                        pct_node.set("text-anchor", "middle")
                        pct_node.set("dominant-baseline", "middle")
                        pct_node.set("fill", "rgba(255,255,255,0.80)")
                        pct_node.set("style", f"font-size:{pct_size}px;font-family:sans-serif;font-weight:500")
                        pct_node.text = f"{pct:.0f}%"
                    else:
                        # Single count label for smaller cells
                        count_node = self.svg.node(mosaic_group, "text", x=text_x, y=current_y + cell_height / 2)
                        count_node.set("text-anchor", "middle")
                        count_node.set("dominant-baseline", "middle")
                        count_node.set("fill", "#ffffff")
                        count_node.set("style", f"font-size:{label_size}px;font-weight:700;font-family:sans-serif")
                        count_node.text = f"{freq:,}"

                current_y += cell_height + row_gap

            # Column label — bold, prominent
            col_label_size = 46
            label_x = current_x + col_width / 2
            label_y = y_offset + available_height + 76
            col_label_node = self.svg.node(mosaic_group, "text", x=label_x, y=label_y)
            col_label_node.set("text-anchor", "middle")
            col_label_node.set("fill", self.ink)
            col_label_node.set(
                "style", f"font-size:{col_label_size}px;font-weight:700;font-family:sans-serif;letter-spacing:0.5px"
            )
            col_label_node.text = col

            # Hairline separator between label and proportion sublabel
            sep_y = label_y + 16
            half_w = min(col_width * 0.35, 100)
            sep_line = self.svg.node(mosaic_group, "line", x1=label_x - half_w, y1=sep_y, x2=label_x + half_w, y2=sep_y)
            sep_line.set("stroke", self.ink_muted)
            sep_line.set("stroke-width", "1.5")
            sep_line.set("stroke-opacity", "0.45")

            # Proportion sub-label — italic, muted
            prop_label_y = label_y + 58
            prop_node = self.svg.node(mosaic_group, "text", x=label_x, y=prop_label_y)
            prop_node.set("text-anchor", "middle")
            prop_node.set("fill", self.ink_muted)
            prop_node.set("style", "font-size:34px;font-style:italic;font-family:sans-serif")
            prop_node.text = f"{col_proportions[j] * 100:.1f}% of sessions"

            current_x += col_width + col_gap

        # Row legend (left side) — larger swatches, refined alignment
        first_col = self.col_labels[0]
        first_col_total = col_totals[0] if col_totals[0] > 0 else 1
        for i, row in enumerate(self.row_labels):
            color = self.cell_colors[i % len(self.cell_colors)]

            cumulative = sum(
                self.contingency_data.get((r, first_col), 0) / first_col_total for r in self.row_labels[:i]
            )
            row_prop = self.contingency_data.get((row, first_col), 0) / first_col_total
            center_y = y_offset + drawing_height * (cumulative + row_prop / 2) + i * row_gap

            swatch_size = 40
            swatch_x = x_offset - 260
            swatch_y = center_y - swatch_size / 2

            swatch = self.svg.node(
                mosaic_group, "rect", x=swatch_x, y=swatch_y, width=swatch_size, height=swatch_size, rx=6, ry=6
            )
            swatch.set("fill", color)
            swatch.set("stroke", self.ink_soft)
            swatch.set("stroke-width", "1.5")
            swatch.set("fill-opacity", "0.90")

            row_label_size = 38
            text_x = swatch_x + swatch_size + 16
            text_y = center_y + row_label_size * 0.36
            row_label_node = self.svg.node(mosaic_group, "text", x=text_x, y=text_y)
            row_label_node.set("text-anchor", "start")
            row_label_node.set("fill", self.ink)
            row_label_node.set("style", f"font-size:{row_label_size}px;font-family:sans-serif;font-weight:500")
            row_label_node.text = row

        # X-axis title
        x_title_x = x_offset + available_width / 2
        x_title_y = y_offset + available_height + 216
        x_title_node = self.svg.node(mosaic_group, "text", x=x_title_x, y=x_title_y)
        x_title_node.set("text-anchor", "middle")
        x_title_node.set("fill", self.ink_soft)
        x_title_node.set("style", "font-size:50px;font-weight:700;font-family:sans-serif;letter-spacing:1px")
        x_title_node.text = "DEVICE TYPE"

        # Y-axis title (rotated)
        y_title_x = x_offset - 400
        y_title_y = y_offset + available_height / 2
        y_title_node = self.svg.node(mosaic_group, "text", x=y_title_x, y=y_title_y)
        y_title_node.set("text-anchor", "middle")
        y_title_node.set("fill", self.ink_soft)
        y_title_node.set("style", "font-size:50px;font-weight:700;font-family:sans-serif;letter-spacing:1px")
        y_title_node.set("transform", f"rotate(-90, {y_title_x}, {y_title_y})")
        y_title_node.text = "APP CATEGORY"

        # Key insight annotation — guides viewer to the most striking pattern
        insight_y = y_offset + available_height + 318
        insight_node = self.svg.node(mosaic_group, "text", x=x_title_x, y=insight_y)
        insight_node.set("text-anchor", "middle")
        insight_node.set("fill", self.ink_muted)
        insight_node.set("style", "font-size:34px;font-style:italic;font-family:sans-serif")
        insight_node.text = (
            "Key insight: Desktop skews heavily towards Productivity (57%) — nearly 4× the Mobile rate (15%)"
        )

    def _compute(self):
        n_rows = len(self.row_labels) if self.row_labels else 1
        n_cols = len(self.col_labels) if self.col_labels else 1
        self._box.xmin = 0
        self._box.xmax = n_cols
        self._box.ymin = 0
        self._box.ymax = n_rows


# App engagement data: device type vs. app category
np.random.seed(42)

data = {
    ("Social Media", "Mobile"): 450,
    ("Gaming", "Mobile"): 320,
    ("Productivity", "Mobile"): 180,
    ("Entertainment", "Mobile"): 290,
    ("Social Media", "Tablet"): 120,
    ("Gaming", "Tablet"): 200,
    ("Productivity", "Tablet"): 230,
    ("Entertainment", "Tablet"): 290,
    ("Social Media", "Desktop"): 80,
    ("Gaming", "Desktop"): 150,
    ("Productivity", "Desktop"): 480,
    ("Entertainment", "Desktop"): 130,
}

row_labels = ["Social Media", "Gaming", "Productivity", "Entertainment"]
col_labels = ["Mobile", "Tablet", "Desktop"]

custom_style = Style(
    background=PAGE_BG,
    plot_background=PAGE_BG,
    foreground=INK,
    foreground_strong=INK,
    foreground_subtle=INK_MUTED,
    colors=IMPRINT,
    title_font_size=68,
    legend_font_size=40,
    label_font_size=40,
    value_font_size=32,
    font_family="sans-serif",
)

chart = MosaicPlot(
    width=4800,
    height=2700,
    style=custom_style,
    title="App Usage by Device · mosaic-categorical · python · pygal · anyplot.ai",
    contingency_data=data,
    row_labels=row_labels,
    col_labels=col_labels,
    cell_colors=list(IMPRINT),
    gap_ratio=0.015,
    show_legend=False,
    margin=100,
    margin_top=220,
    margin_bottom=150,
    show_x_labels=False,
    show_y_labels=False,
    ink=INK,
    ink_soft=INK_SOFT,
    ink_muted=INK_MUTED,
    page_bg=PAGE_BG,
    rule=RULE,
)

# Dummy series required to trigger pygal's rendering pipeline
chart.add("", [0])

# Save
chart.render_to_png(f"plot-{THEME}.png")

with open(f"plot-{THEME}.html", "wb") as f:
    f.write(chart.render())
Runnable source as JSON, for any HTTP client: https://api.anyplot.ai/specs/mosaic-categorical/pygal/code. Any spec id and library id listed in llms-full.txt fit the same URL shape; every URL below is complete and callable.
{
  "spec_id": "mosaic-categorical",
  "language": "python",
  "library": "pygal",
  "page": "https://anyplot.ai/mosaic-categorical/python/pygal",
  "hub": "https://anyplot.ai/mosaic-categorical",
  "code_json": "https://api.anyplot.ai/specs/mosaic-categorical/pygal/code",
  "spec_json": "https://api.anyplot.ai/specs/mosaic-categorical",
  "render_light_png": "https://storage.googleapis.com/anyplot-images/plots/mosaic-categorical/python/pygal/plot-light.png",
  "render_dark_png": "https://storage.googleapis.com/anyplot-images/plots/mosaic-categorical/python/pygal/plot-dark.png",
  "interactive_light_html": "https://storage.googleapis.com/anyplot-images/plots/mosaic-categorical/python/pygal/plot-light.html",
  "interactive_dark_html": "https://storage.googleapis.com/anyplot-images/plots/mosaic-categorical/python/pygal/plot-dark.html",
  "quality_score": 89.0,
  "license": "MIT",
  "guide": "https://anyplot.ai/llms.txt"
}
Part of Mosaic Plot for Categorical Association Analysis on anyplot.ai.