The same plot in 14 other libraries — JavaScript: Chart.js, D3.js, Highcharts, MUI X Charts; Python: Altair, Bokeh, lets-plot, Matplotlib, Plotly, plotnine, Pygal, Seaborn; R: ggplot2; Julia: Makie.jl. Compare all 15 side by side: Mosaic Plot for Categorical Association Analysis in Python, R, Julia and JavaScript.
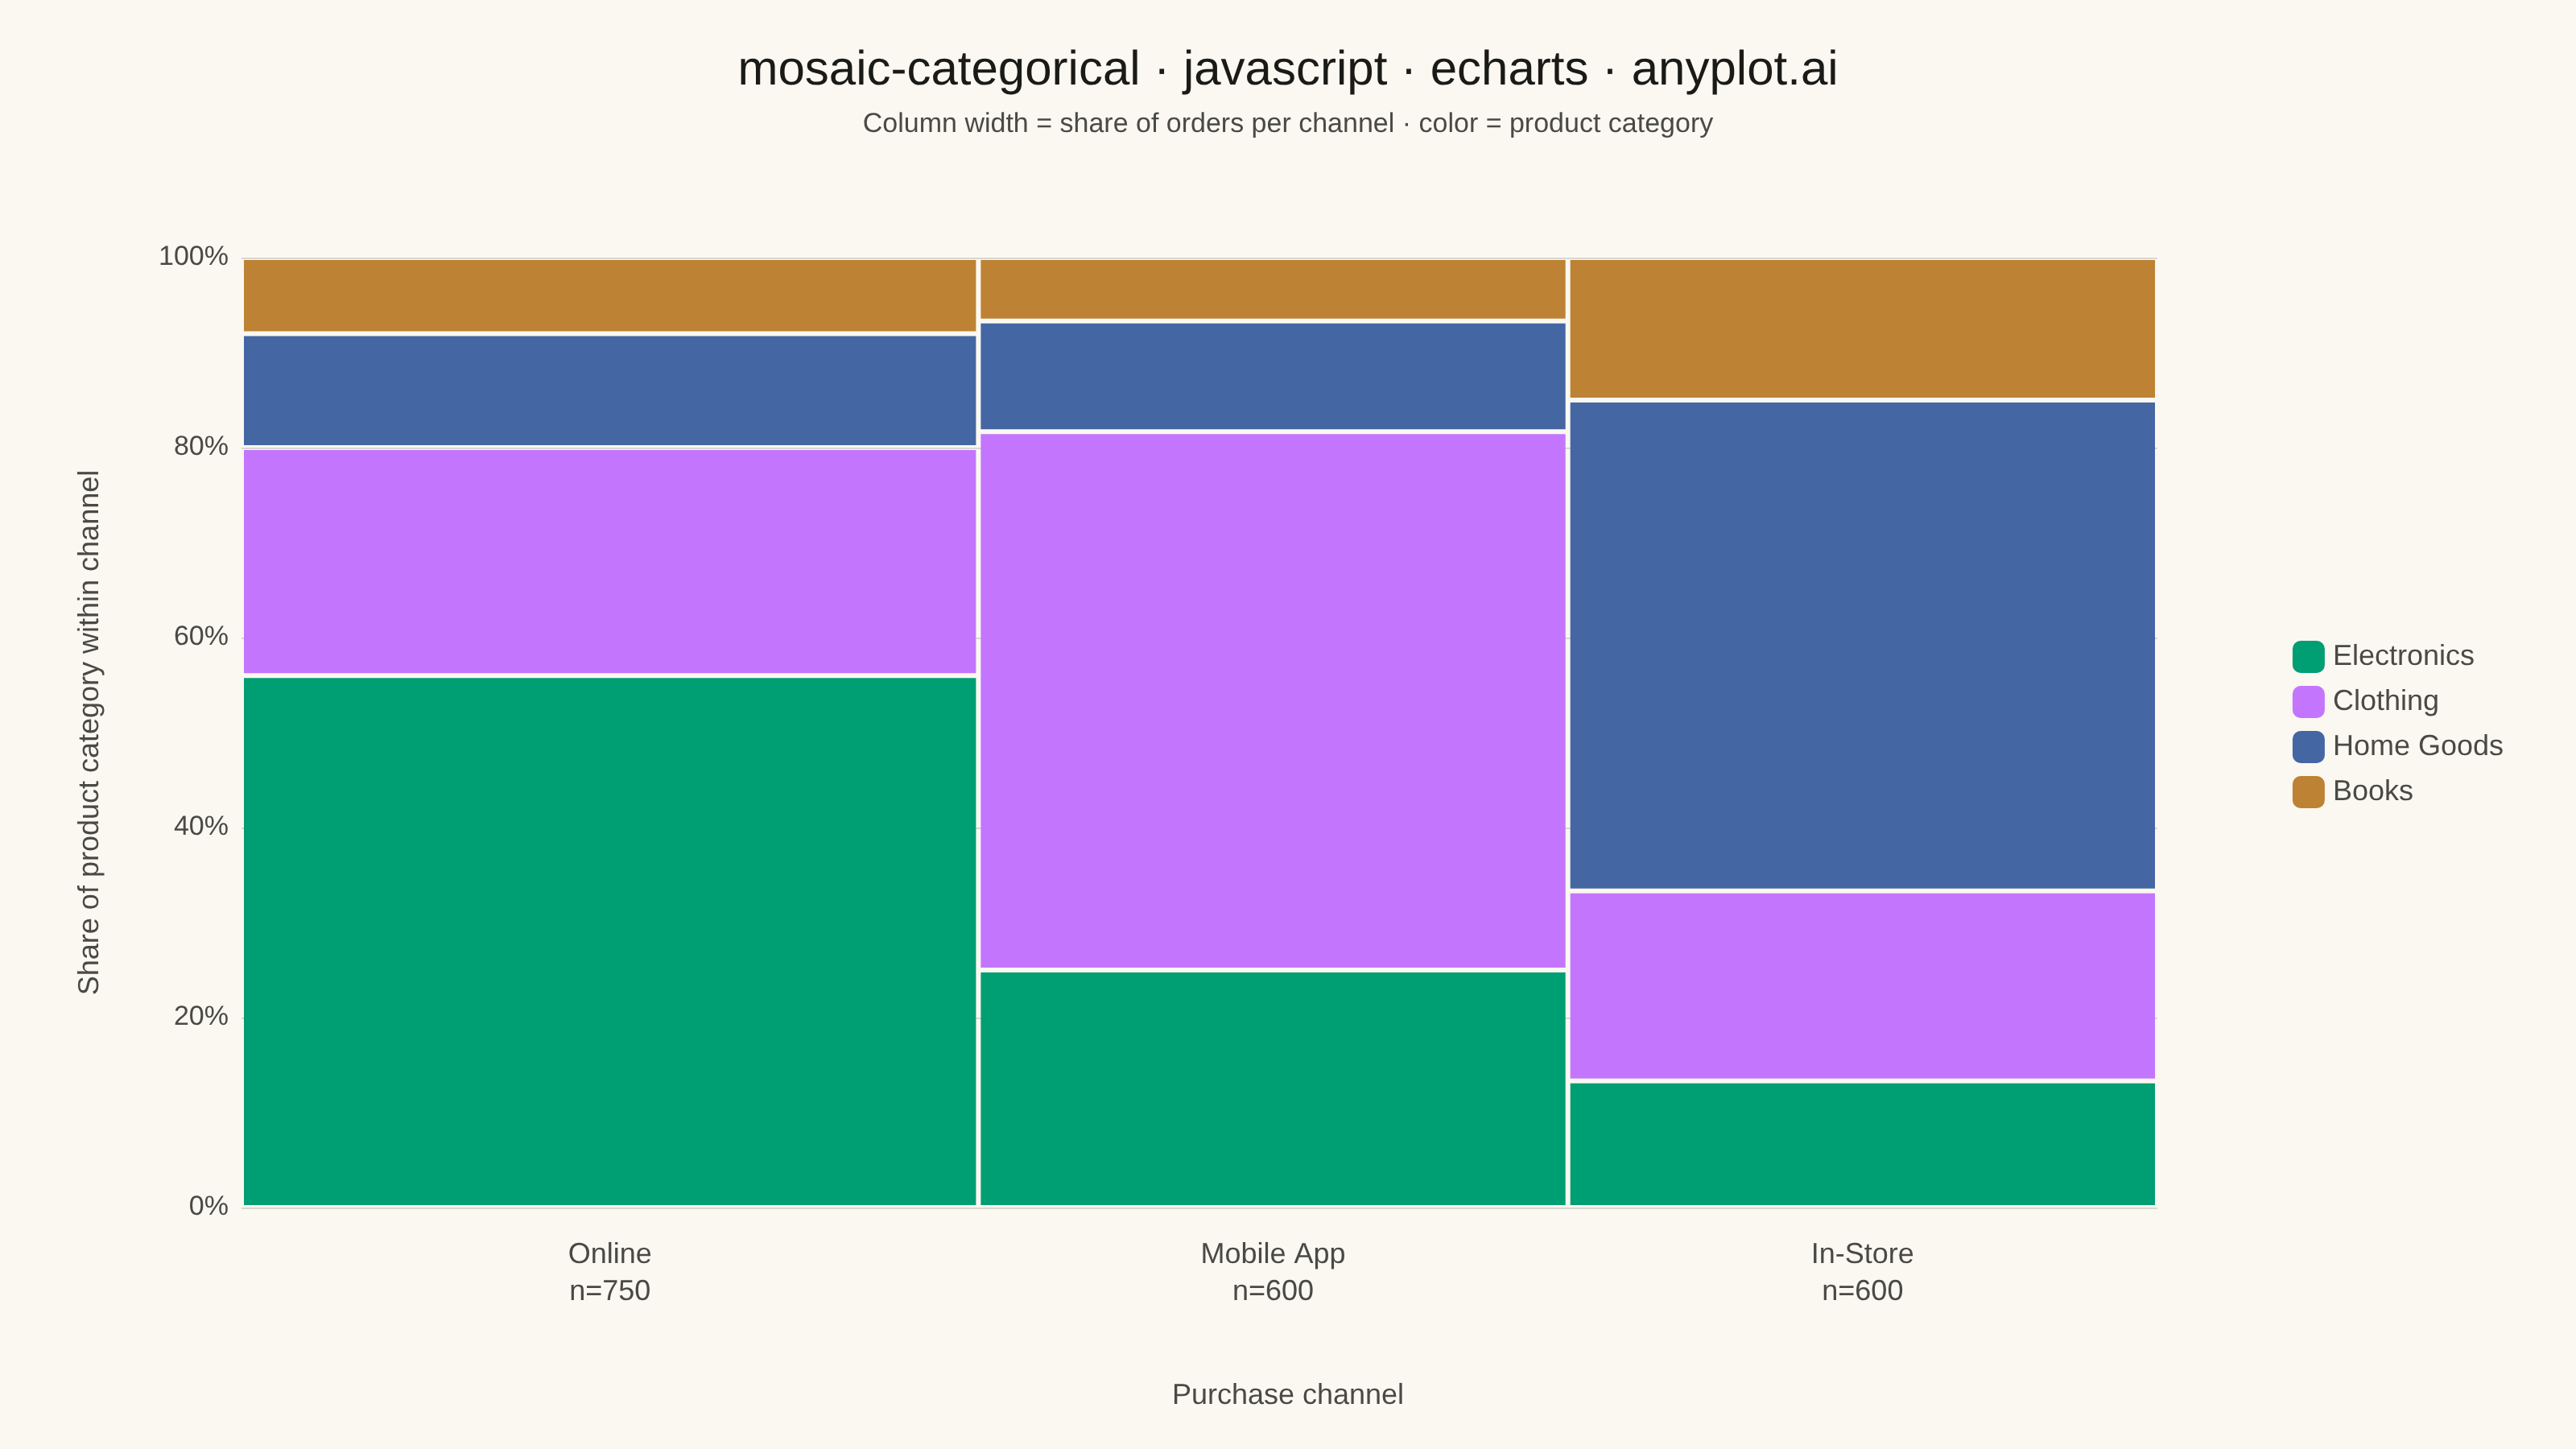
A mosaic plot visualizes contingency tables by dividing a rectangular area into smaller rectangles whose areas are proportional to cell frequencies. This statistical visualization technique effectively shows relationships and associations between two categorical variables, making it easy to identify patterns, dependencies, and deviations from expected frequencies in cross-tabulated data.
// anyplot.ai
// mosaic-categorical: Mosaic Plot for Categorical Association Analysis
// Library: echarts 6.1.0 | JavaScript 22.23.2
// Quality: 93/100 | Created: 2026-09-02

const t = window.ANYPLOT_TOKENS;

// --- Data (in-memory, deterministic) ----------------------------------------
// Retail orders cross-tabulated by purchase channel (columns) and product category (rows).
const channels = ["Online", "Mobile App", "In-Store"];
const categories = ["Electronics", "Clothing", "Home Goods", "Books"];
const counts = [
  [420, 180, 90, 60], // Online
  [150, 340, 70, 40], // Mobile App
  [80, 120, 310, 90], // In-Store
];

const channelTotals = counts.map((row) => row.reduce((a, b) => a + b, 0));
const grandTotal = channelTotals.reduce((a, b) => a + b, 0);

// Cell rectangles in a 0-1 x 0-1 domain: width = share of grand total per
// channel, height = conditional share of category within that channel.
let xCursor = 0;
const cells = [];
channels.forEach((channel, i) => {
  const x0 = xCursor;
  const x1 = xCursor + channelTotals[i] / grandTotal;
  xCursor = x1;

  let yCursor = 0;
  categories.forEach((category, j) => {
    const y0 = yCursor;
    const y1 = yCursor + counts[i][j] / channelTotals[i];
    yCursor = y1;
    cells.push({
      value: [x0, x1, y0, y1],
      channel,
      channelTotal: channelTotals[i],
      colorIndex: j,
      isFirstRow: j === 0,
    });
  });
});

// --- Init --------------------------------------------------------------------
const chart = echarts.init(document.getElementById("container"));

// --- Option --------------------------------------------------------------------
chart.setOption({
  animation: false,
  backgroundColor: "transparent",
  color: t.palette,
  title: {
    text: "mosaic-categorical · javascript · echarts · anyplot.ai",
    subtext: "Column width = share of orders per channel · color = product category",
    left: "center",
    top: 24,
    textStyle: { color: t.ink, fontSize: 30, fontWeight: 500 },
    subtextStyle: { color: t.inkSoft, fontSize: 17 },
  },
  legend: {
    data: categories,
    orient: "vertical",
    right: 40,
    top: "middle",
    itemWidth: 20,
    itemHeight: 20,
    textStyle: { color: t.inkSoft, fontSize: 18 },
  },
  grid: {
    left: 150,
    right: 260,
    top: 160,
    bottom: 150,
  },
  xAxis: { type: "value", min: 0, max: 1, show: false },
  yAxis: {
    type: "value",
    min: 0,
    max: 1,
    name: "Share of product category within channel",
    nameLocation: "middle",
    nameGap: 85,
    nameRotate: 90,
    nameTextStyle: { color: t.inkSoft, fontSize: 18 },
    axisLabel: { formatter: (v) => `${Math.round(v * 100)}%`, color: t.inkSoft, fontSize: 17 },
    axisLine: { show: false },
    axisTick: { show: false },
    splitLine: { lineStyle: { color: t.grid } },
  },
  graphic: [
    {
      type: "text",
      left: "center",
      bottom: 24,
      style: {
        text: "Purchase channel",
        fill: t.inkSoft,
        fontSize: 18,
        textAlign: "center",
      },
    },
  ],
  series: [
    // Empty-data helper series: registers category names + colors in the legend.
    ...categories.map((category, j) => ({
      name: category,
      type: "bar",
      data: [],
      itemStyle: { color: t.palette[j] },
    })),
    {
      name: "mosaic",
      type: "custom",
      legendHoverLink: false,
      coordinateSystem: "cartesian2d",
      data: cells,
      renderItem: (params, api) => {
        const x0 = api.value(0);
        const x1 = api.value(1);
        const y0 = api.value(2);
        const y1 = api.value(3);
        const cell = cells[params.dataIndex];

        const topLeft = api.coord([x0, y1]);
        const bottomRight = api.coord([x1, y0]);
        const rectWidth = bottomRight[0] - topLeft[0];
        const rectHeight = bottomRight[1] - topLeft[1];
        const gapPx = 3;

        const children = [
          {
            type: "rect",
            shape: {
              x: topLeft[0] + gapPx / 2,
              y: topLeft[1] + gapPx / 2,
              width: Math.max(rectWidth - gapPx, 0),
              height: Math.max(rectHeight - gapPx, 0),
            },
            style: { fill: t.palette[cell.colorIndex] },
          },
        ];

        if (cell.isFirstRow) {
          const bottomCenter = api.coord([(x0 + x1) / 2, 0]);
          children.push({
            type: "text",
            style: {
              text: `${cell.channel}\nn=${cell.channelTotal}`,
              x: bottomCenter[0],
              y: bottomCenter[1] + 18,
              textAlign: "center",
              textVerticalAlign: "top",
              fontSize: 18,
              lineHeight: 23,
              fill: t.inkSoft,
            },
          });
        }

        return { type: "group", children };
      },
    },
  ],
});
Runnable source as JSON, for any HTTP client: https://api.anyplot.ai/specs/mosaic-categorical/echarts/code. Any spec id and library id listed in llms-full.txt fit the same URL shape; every URL below is complete and callable.
{
  "spec_id": "mosaic-categorical",
  "language": "javascript",
  "library": "echarts",
  "page": "https://anyplot.ai/mosaic-categorical/javascript/echarts",
  "hub": "https://anyplot.ai/mosaic-categorical",
  "code_json": "https://api.anyplot.ai/specs/mosaic-categorical/echarts/code",
  "spec_json": "https://api.anyplot.ai/specs/mosaic-categorical",
  "render_light_png": "https://storage.googleapis.com/anyplot-images/plots/mosaic-categorical/javascript/echarts/plot-light.png",
  "render_dark_png": "https://storage.googleapis.com/anyplot-images/plots/mosaic-categorical/javascript/echarts/plot-dark.png",
  "interactive_light_html": "https://storage.googleapis.com/anyplot-images/plots/mosaic-categorical/javascript/echarts/plot-light.html",
  "interactive_dark_html": "https://storage.googleapis.com/anyplot-images/plots/mosaic-categorical/javascript/echarts/plot-dark.html",
  "quality_score": 93.0,
  "license": "MIT",
  "guide": "https://anyplot.ai/llms.txt"
}
Part of Mosaic Plot for Categorical Association Analysis on anyplot.ai.