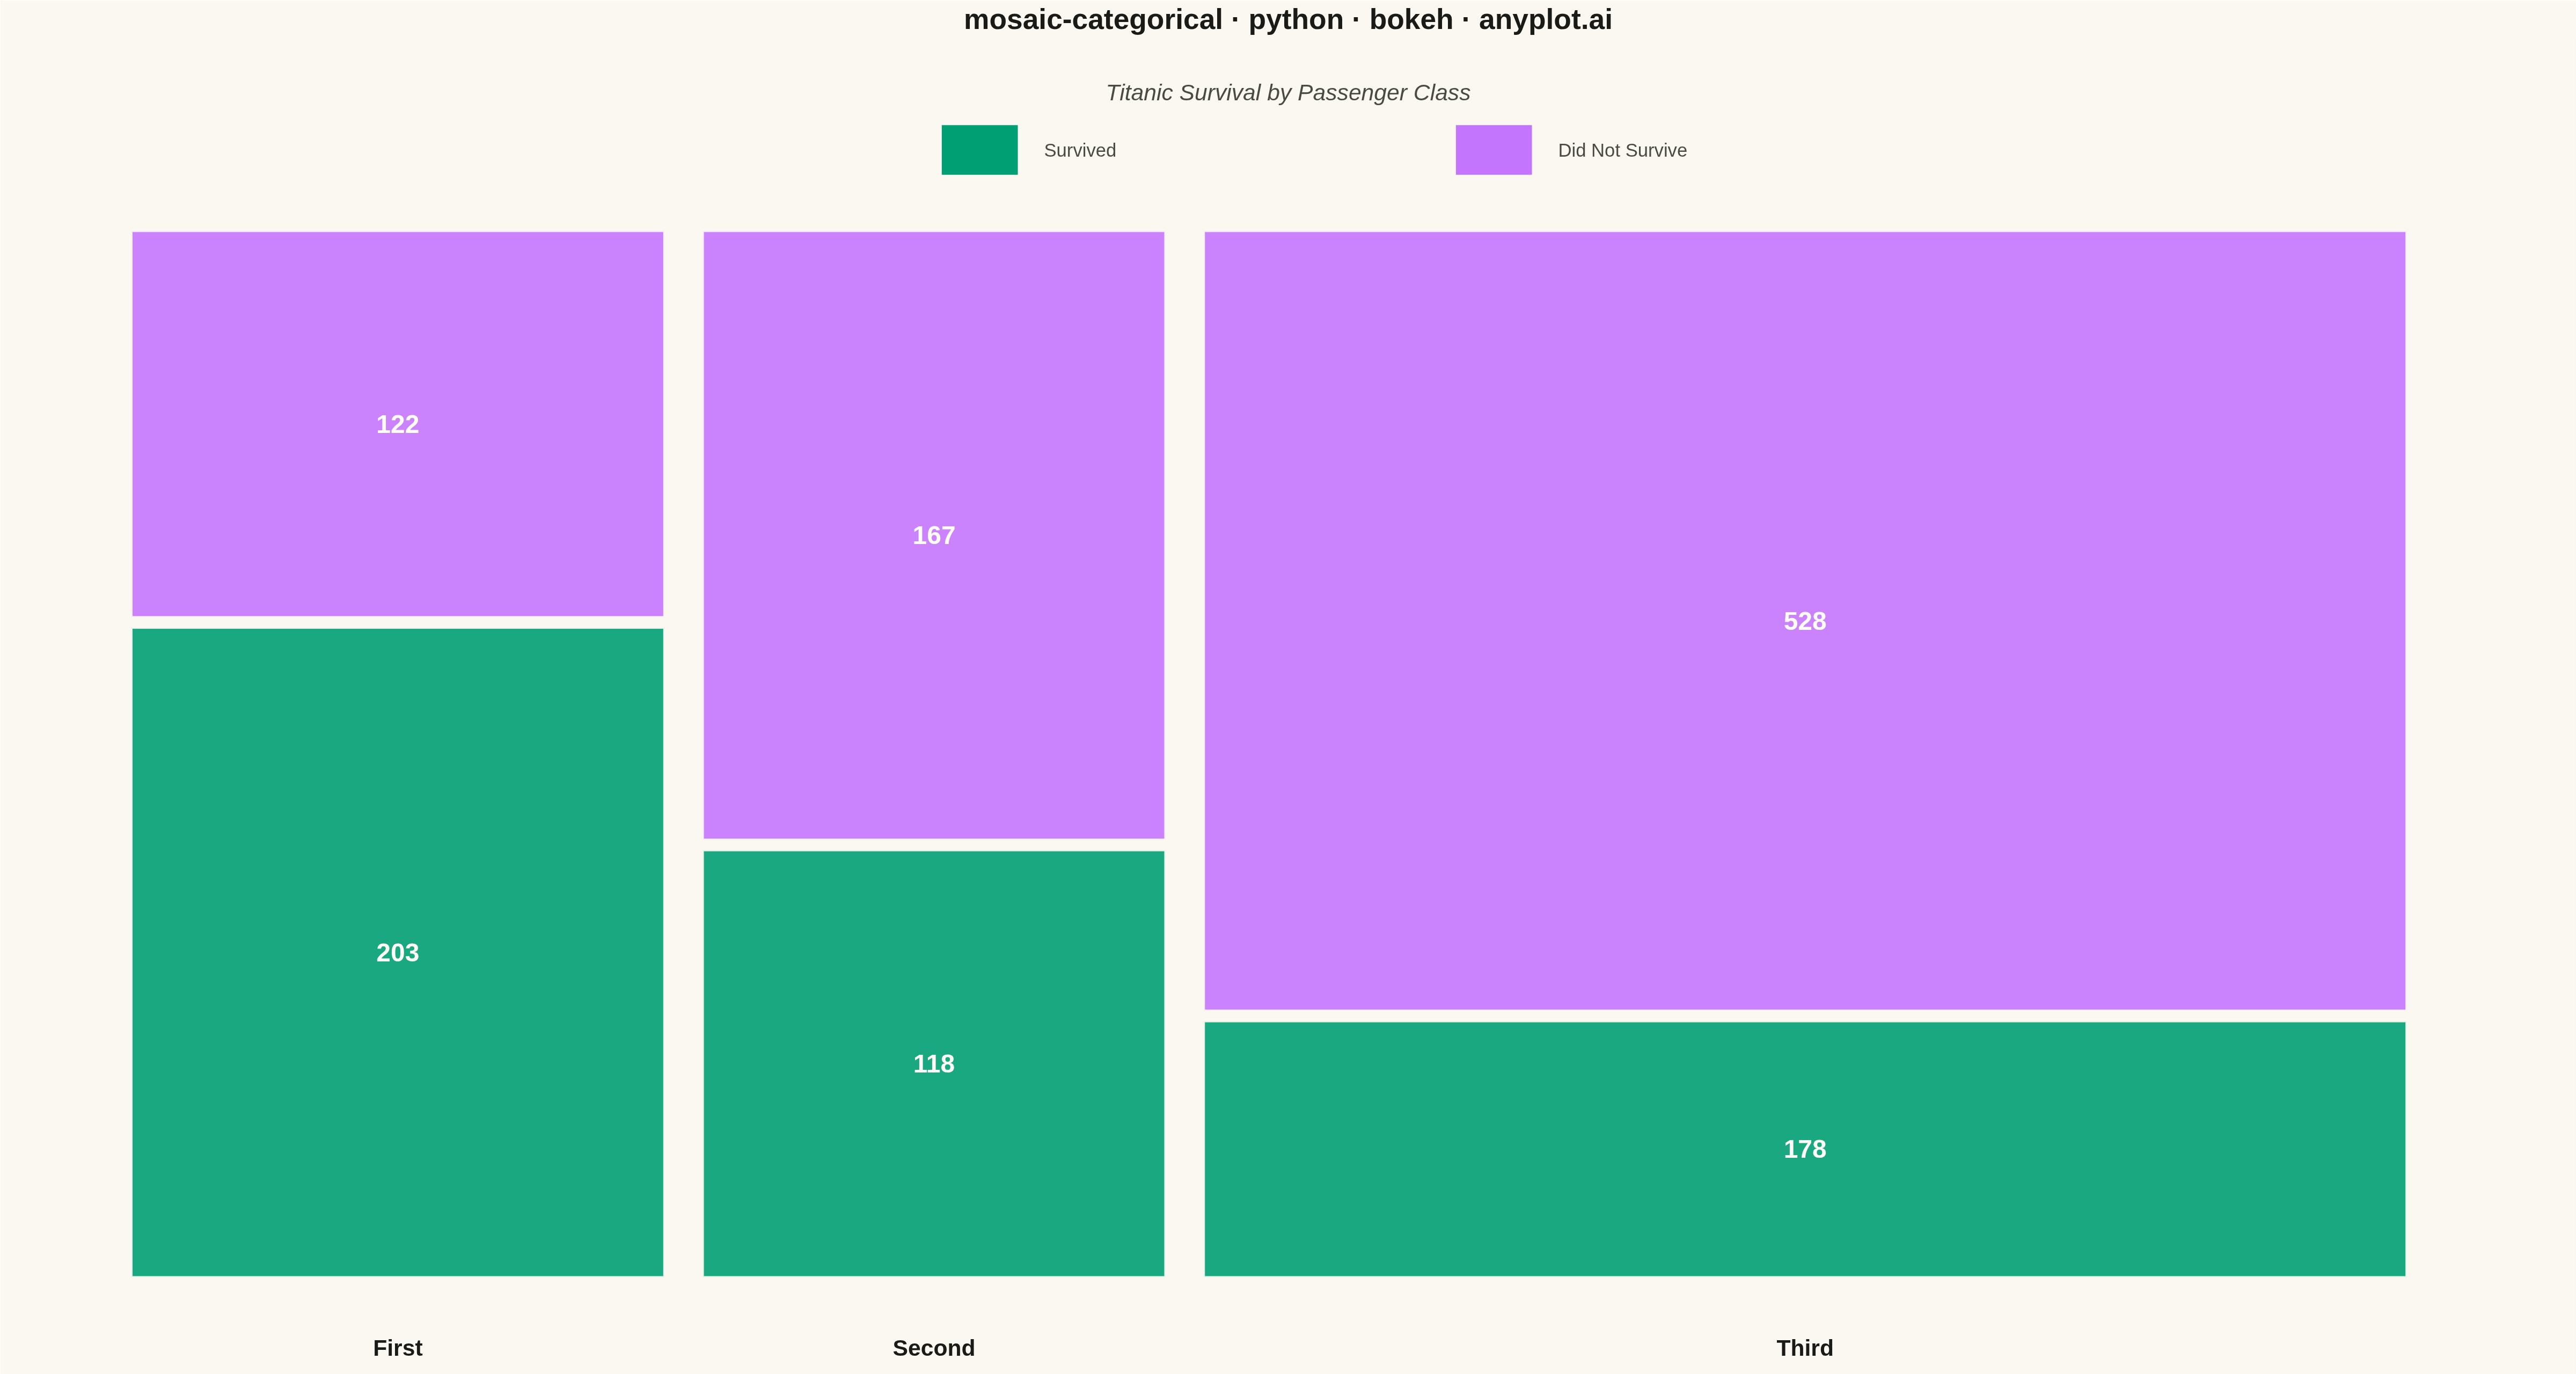
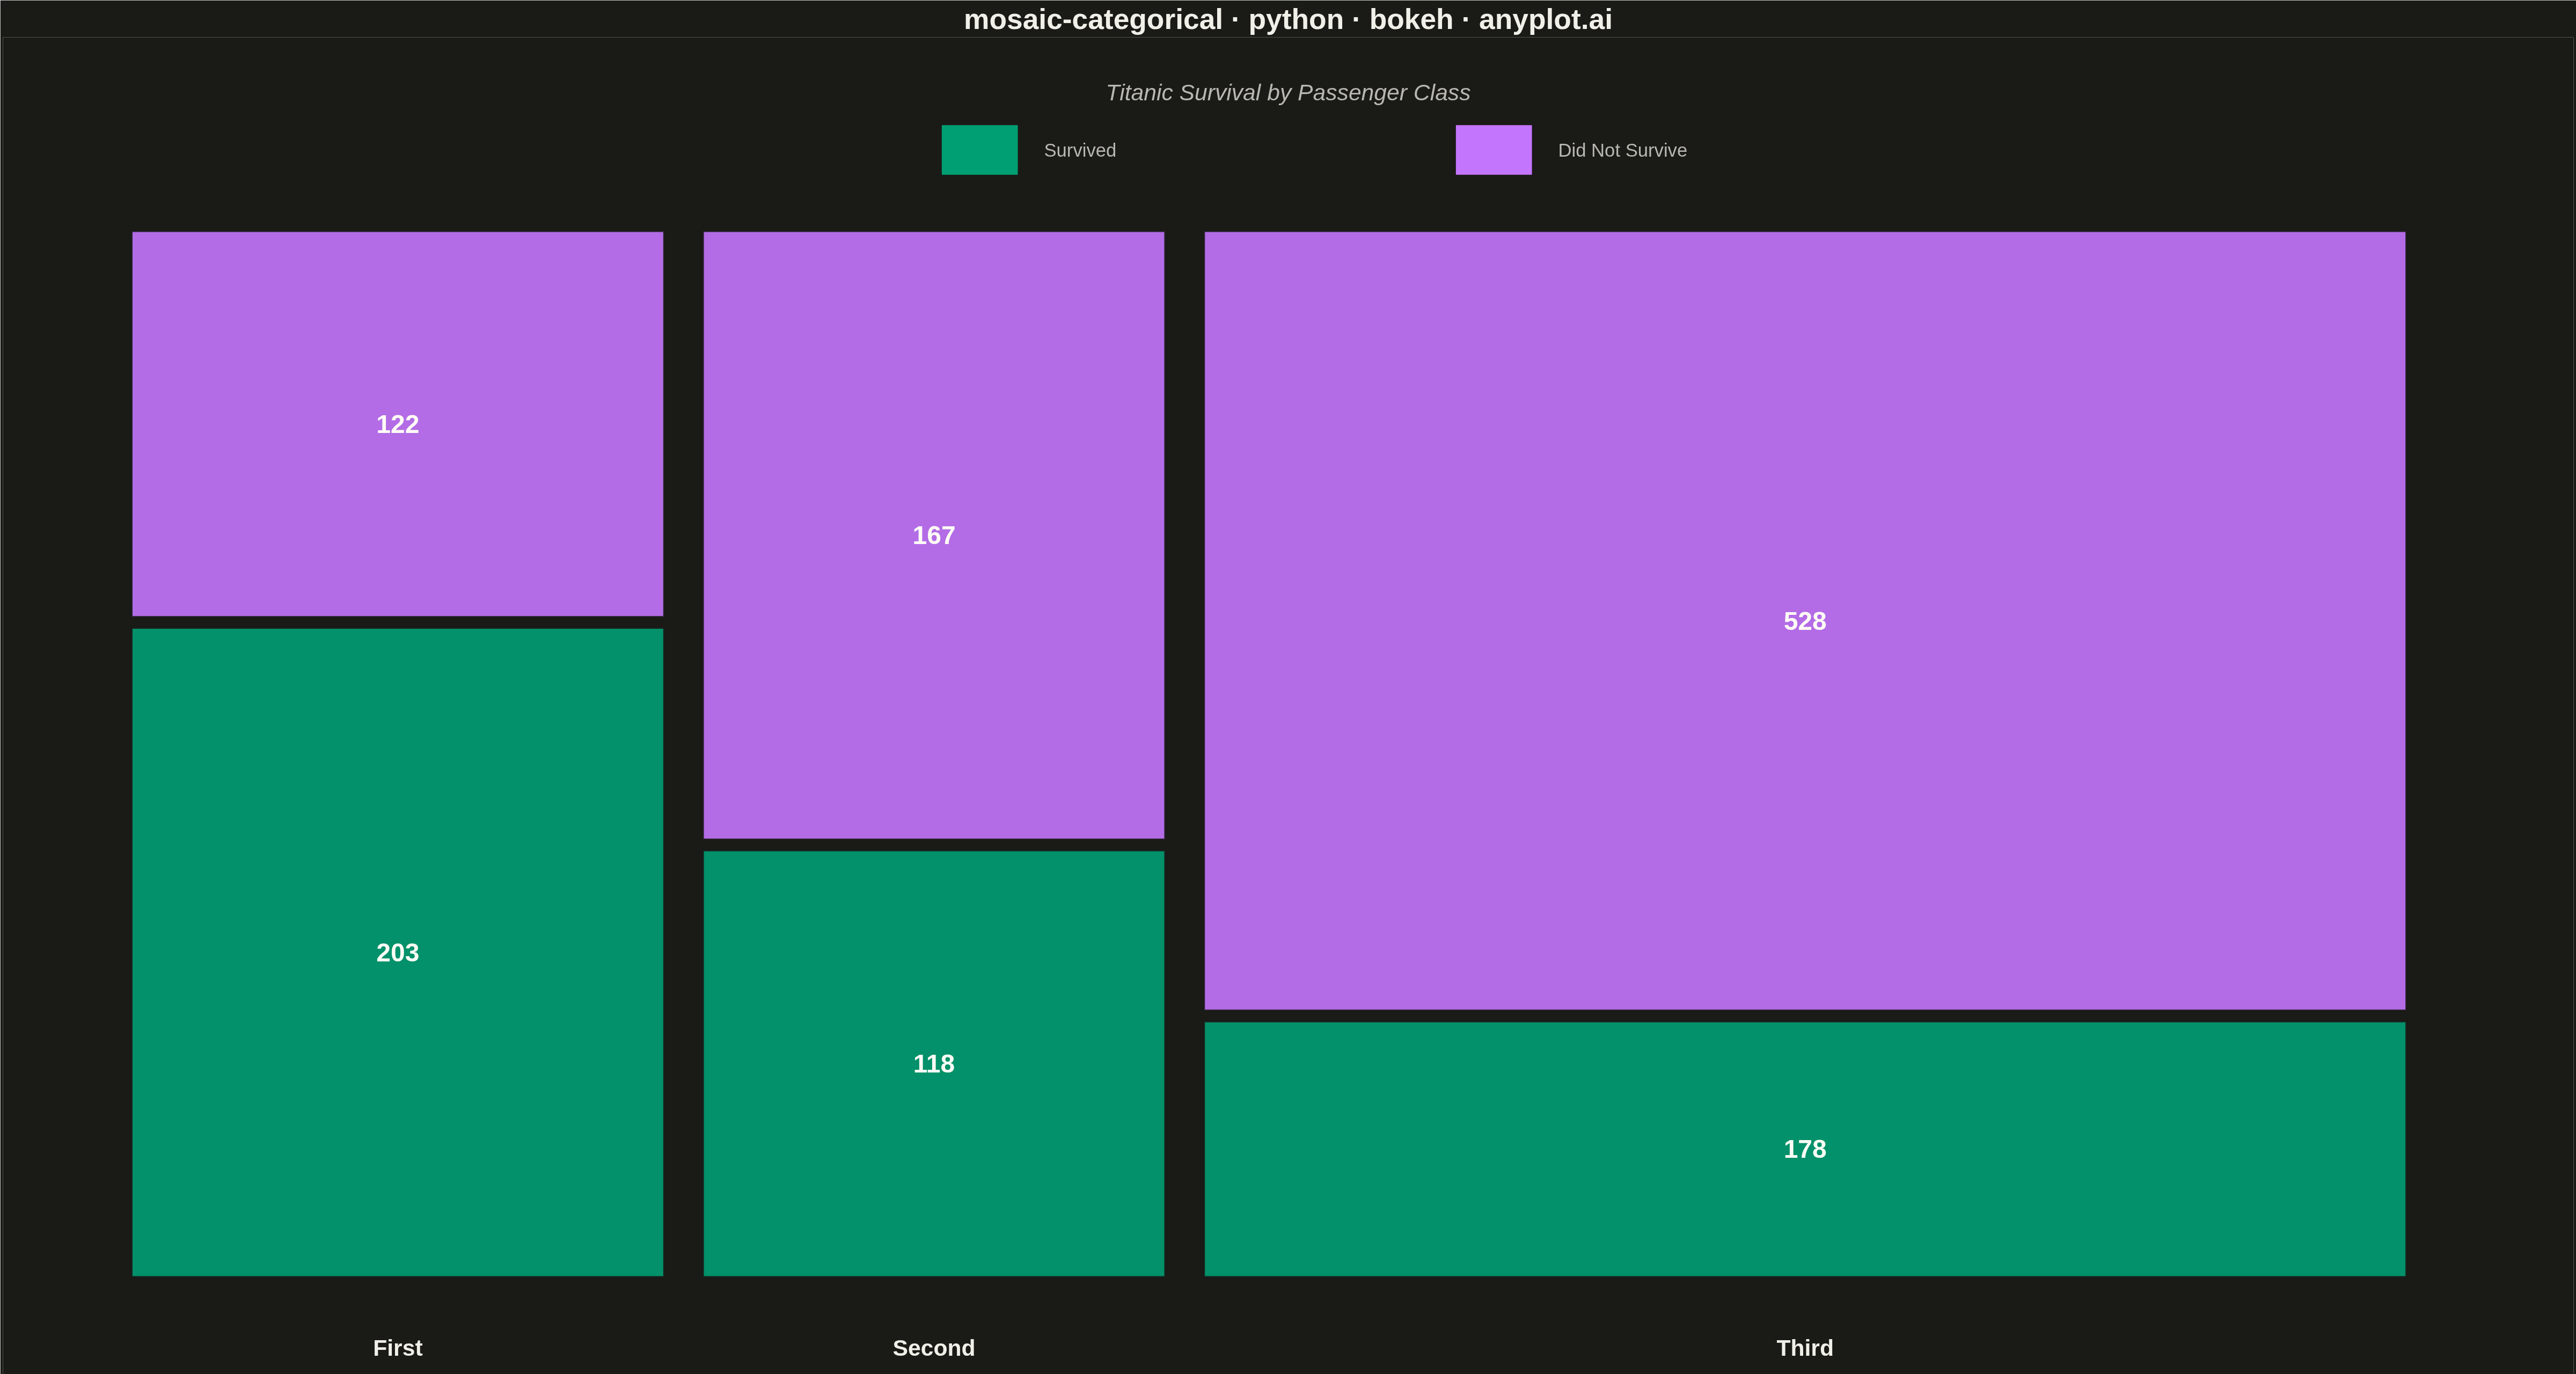
A mosaic plot visualizes contingency tables by dividing a rectangular area into smaller rectangles whose areas are proportional to cell frequencies. This statistical visualization technique effectively shows relationships and associations between two or more categorical variables, making it easy to identify patterns, dependencies, and deviations from expected frequencies in cross-tabulated data.
""" anyplot.ai
mosaic-categorical: Mosaic Plot for Categorical Association Analysis
Library: bokeh 3.9.0 | Python 3.13.13
Quality: 90/100 | Updated: 2026-05-19
"""

import os
import time
from pathlib import Path

import pandas as pd
from bokeh.io import output_file, save
from bokeh.models import ColumnDataSource, HoverTool, Label
from bokeh.plotting import figure
from selenium import webdriver
from selenium.webdriver.chrome.options import Options


# Theme tokens
THEME = os.getenv("ANYPLOT_THEME", "light")
PAGE_BG = "#FAF8F1" if THEME == "light" else "#1A1A17"
INK = "#1A1A17" if THEME == "light" else "#F0EFE8"
INK_SOFT = "#4A4A44" if THEME == "light" else "#B8B7B0"

# Okabe-Ito palette — first series always #009E73
SURVIVAL_COLORS = {"Survived": "#009E73", "Did Not Survive": "#C475FD"}

# Data - Titanic survival data (class vs survival)
data = {
    "Class": ["First", "First", "Second", "Second", "Third", "Third"],
    "Survival": ["Survived", "Did Not Survive", "Survived", "Did Not Survive", "Survived", "Did Not Survive"],
    "Count": [203, 122, 118, 167, 178, 528],
}
df = pd.DataFrame(data)

# Calculate proportions
total = df["Count"].sum()
class_totals = df.groupby("Class")["Count"].sum()
class_order = ["First", "Second", "Third"]
survival_order = ["Survived", "Did Not Survive"]

# Build mosaic rectangles
rectangles = []
gap = 0.015
plot_width = 0.90
x_start = 0.05
mosaic_bottom = 0.12
mosaic_height = 0.75

for class_name in class_order:
    class_data = df[df["Class"] == class_name]
    class_total = class_totals[class_name]
    class_width = (class_total / total) * plot_width - gap

    y_start = mosaic_bottom
    for survival in survival_order:
        cell_data = class_data[class_data["Survival"] == survival]
        if len(cell_data) > 0:
            count = cell_data["Count"].values[0]
            cell_height = (count / class_total) * mosaic_height - gap / 2
            pct = count / class_total * 100

            rectangles.append(
                {
                    "left": x_start,
                    "right": x_start + class_width,
                    "bottom": y_start,
                    "top": y_start + cell_height,
                    "class": class_name,
                    "survival": survival,
                    "count": count,
                    "pct": f"{pct:.1f}%",
                }
            )
            y_start += (count / class_total) * mosaic_height

    x_start += (class_total / total) * plot_width

# Assign Okabe-Ito colors
colors = [SURVIVAL_COLORS[r["survival"]] for r in rectangles]

# ColumnDataSource
source = ColumnDataSource(
    data={
        "left": [r["left"] for r in rectangles],
        "right": [r["right"] for r in rectangles],
        "bottom": [r["bottom"] for r in rectangles],
        "top": [r["top"] for r in rectangles],
        "color": colors,
        "class": [r["class"] for r in rectangles],
        "survival": [r["survival"] for r in rectangles],
        "count": [r["count"] for r in rectangles],
        "pct": [r["pct"] for r in rectangles],
    }
)

# Figure
p = figure(
    width=4800,
    height=2700,
    title="mosaic-categorical · python · bokeh · anyplot.ai",
    x_range=(0, 1),
    y_range=(0, 1),
    tools="",
    toolbar_location=None,
)

# Mosaic rectangles
quads = p.quad(
    left="left",
    right="right",
    bottom="bottom",
    top="top",
    source=source,
    color="color",
    line_color=PAGE_BG,
    line_width=4,
    alpha=0.9,
    name="mosaic",
)

# HoverTool for interactivity
hover = HoverTool(
    renderers=[quads],
    tooltips=[("Class", "@class"), ("Status", "@survival"), ("Count", "@count"), ("Proportion", "@pct")],
)
p.add_tools(hover)

# Count labels inside each rectangle (light text on colored backgrounds)
for rect in rectangles:
    cx = (rect["left"] + rect["right"]) / 2
    cy = (rect["bottom"] + rect["top"]) / 2
    label = Label(
        x=cx,
        y=cy,
        text=str(rect["count"]),
        text_align="center",
        text_baseline="middle",
        text_font_size="36pt",
        text_font_style="bold",
        text_color="#FFFDF6",
    )
    p.add_layout(label)

# Class labels at bottom of each column
x_pos = 0.05
for class_name in class_order:
    class_total = class_totals[class_name]
    class_width = (class_total / total) * plot_width - gap
    label = Label(
        x=x_pos + class_width / 2,
        y=0.07,
        text=class_name,
        text_align="center",
        text_baseline="middle",
        text_font_size="32pt",
        text_font_style="bold",
        text_color=INK,
    )
    p.add_layout(label)
    x_pos += (class_total / total) * plot_width

# X-axis description
x_axis_label = Label(
    x=0.5,
    y=0.02,
    text="Passenger Class  (column width ∝ share of total passengers)",
    text_align="center",
    text_baseline="bottom",
    text_font_size="24pt",
    text_color=INK_SOFT,
)
p.add_layout(x_axis_label)

# Centered legend — two items horizontally balanced around plot center (~0.49)
legend_y = 0.92
legend_items = [
    {"color": "#009E73", "text": "Survived", "x": 0.38},
    {"color": "#C475FD", "text": "Did Not Survive", "x": 0.58},
]
for item in legend_items:
    p.quad(
        left=[item["x"] - 0.015],
        right=[item["x"] + 0.015],
        bottom=[legend_y - 0.018],
        top=[legend_y + 0.018],
        color=item["color"],
        line_color=PAGE_BG,
        line_width=2,
    )
    label = Label(
        x=item["x"] + 0.025,
        y=legend_y,
        text=item["text"],
        text_align="left",
        text_baseline="middle",
        text_font_size="26pt",
        text_color=INK_SOFT,
    )
    p.add_layout(label)

# Subtitle
subtitle = Label(
    x=0.5,
    y=0.97,
    text="Titanic Survival by Passenger Class",
    text_align="center",
    text_baseline="top",
    text_font_size="32pt",
    text_font_style="italic",
    text_color=INK_SOFT,
)
p.add_layout(subtitle)

# Style
p.title.text_font_size = "40pt"
p.title.text_font_style = "bold"
p.title.align = "center"
p.title.text_color = INK

p.xaxis.visible = False
p.yaxis.visible = False
p.xgrid.visible = False
p.ygrid.visible = False

p.background_fill_color = PAGE_BG
p.border_fill_color = PAGE_BG
p.outline_line_color = None

# Save HTML
output_file(f"plot-{THEME}.html")
save(p)

# Screenshot with headless Chrome via Selenium
W, H = 4800, 2700
opts = Options()
for arg in (
    "--headless=new",
    "--no-sandbox",
    "--disable-dev-shm-usage",
    "--disable-gpu",
    f"--window-size={W},{H}",
    "--hide-scrollbars",
):
    opts.add_argument(arg)
driver = webdriver.Chrome(options=opts)
driver.set_window_size(W, H)
driver.get(f"file://{Path(f'plot-{THEME}.html').resolve()}")
time.sleep(3)
driver.save_screenshot(f"plot-{THEME}.png")
driver.quit()
Runnable source as JSON, for any HTTP client: https://api.anyplot.ai/specs/mosaic-categorical/bokeh/code. Any spec id and library id listed in llms-full.txt fit the same URL shape; every URL below is complete and callable.
{
  "spec_id": "mosaic-categorical",
  "language": "python",
  "library": "bokeh",
  "page": "https://anyplot.ai/mosaic-categorical/python/bokeh",
  "hub": "https://anyplot.ai/mosaic-categorical",
  "code_json": "https://api.anyplot.ai/specs/mosaic-categorical/bokeh/code",
  "spec_json": "https://api.anyplot.ai/specs/mosaic-categorical",
  "render_light_png": "https://storage.googleapis.com/anyplot-images/plots/mosaic-categorical/python/bokeh/plot-light.png",
  "render_dark_png": "https://storage.googleapis.com/anyplot-images/plots/mosaic-categorical/python/bokeh/plot-dark.png",
  "interactive_light_html": "https://storage.googleapis.com/anyplot-images/plots/mosaic-categorical/python/bokeh/plot-light.html",
  "interactive_dark_html": "https://storage.googleapis.com/anyplot-images/plots/mosaic-categorical/python/bokeh/plot-dark.html",
  "quality_score": 90.0,
  "license": "MIT",
  "guide": "https://anyplot.ai/llms.txt"
}
Part of Mosaic Plot for Categorical Association Analysis on anyplot.ai.