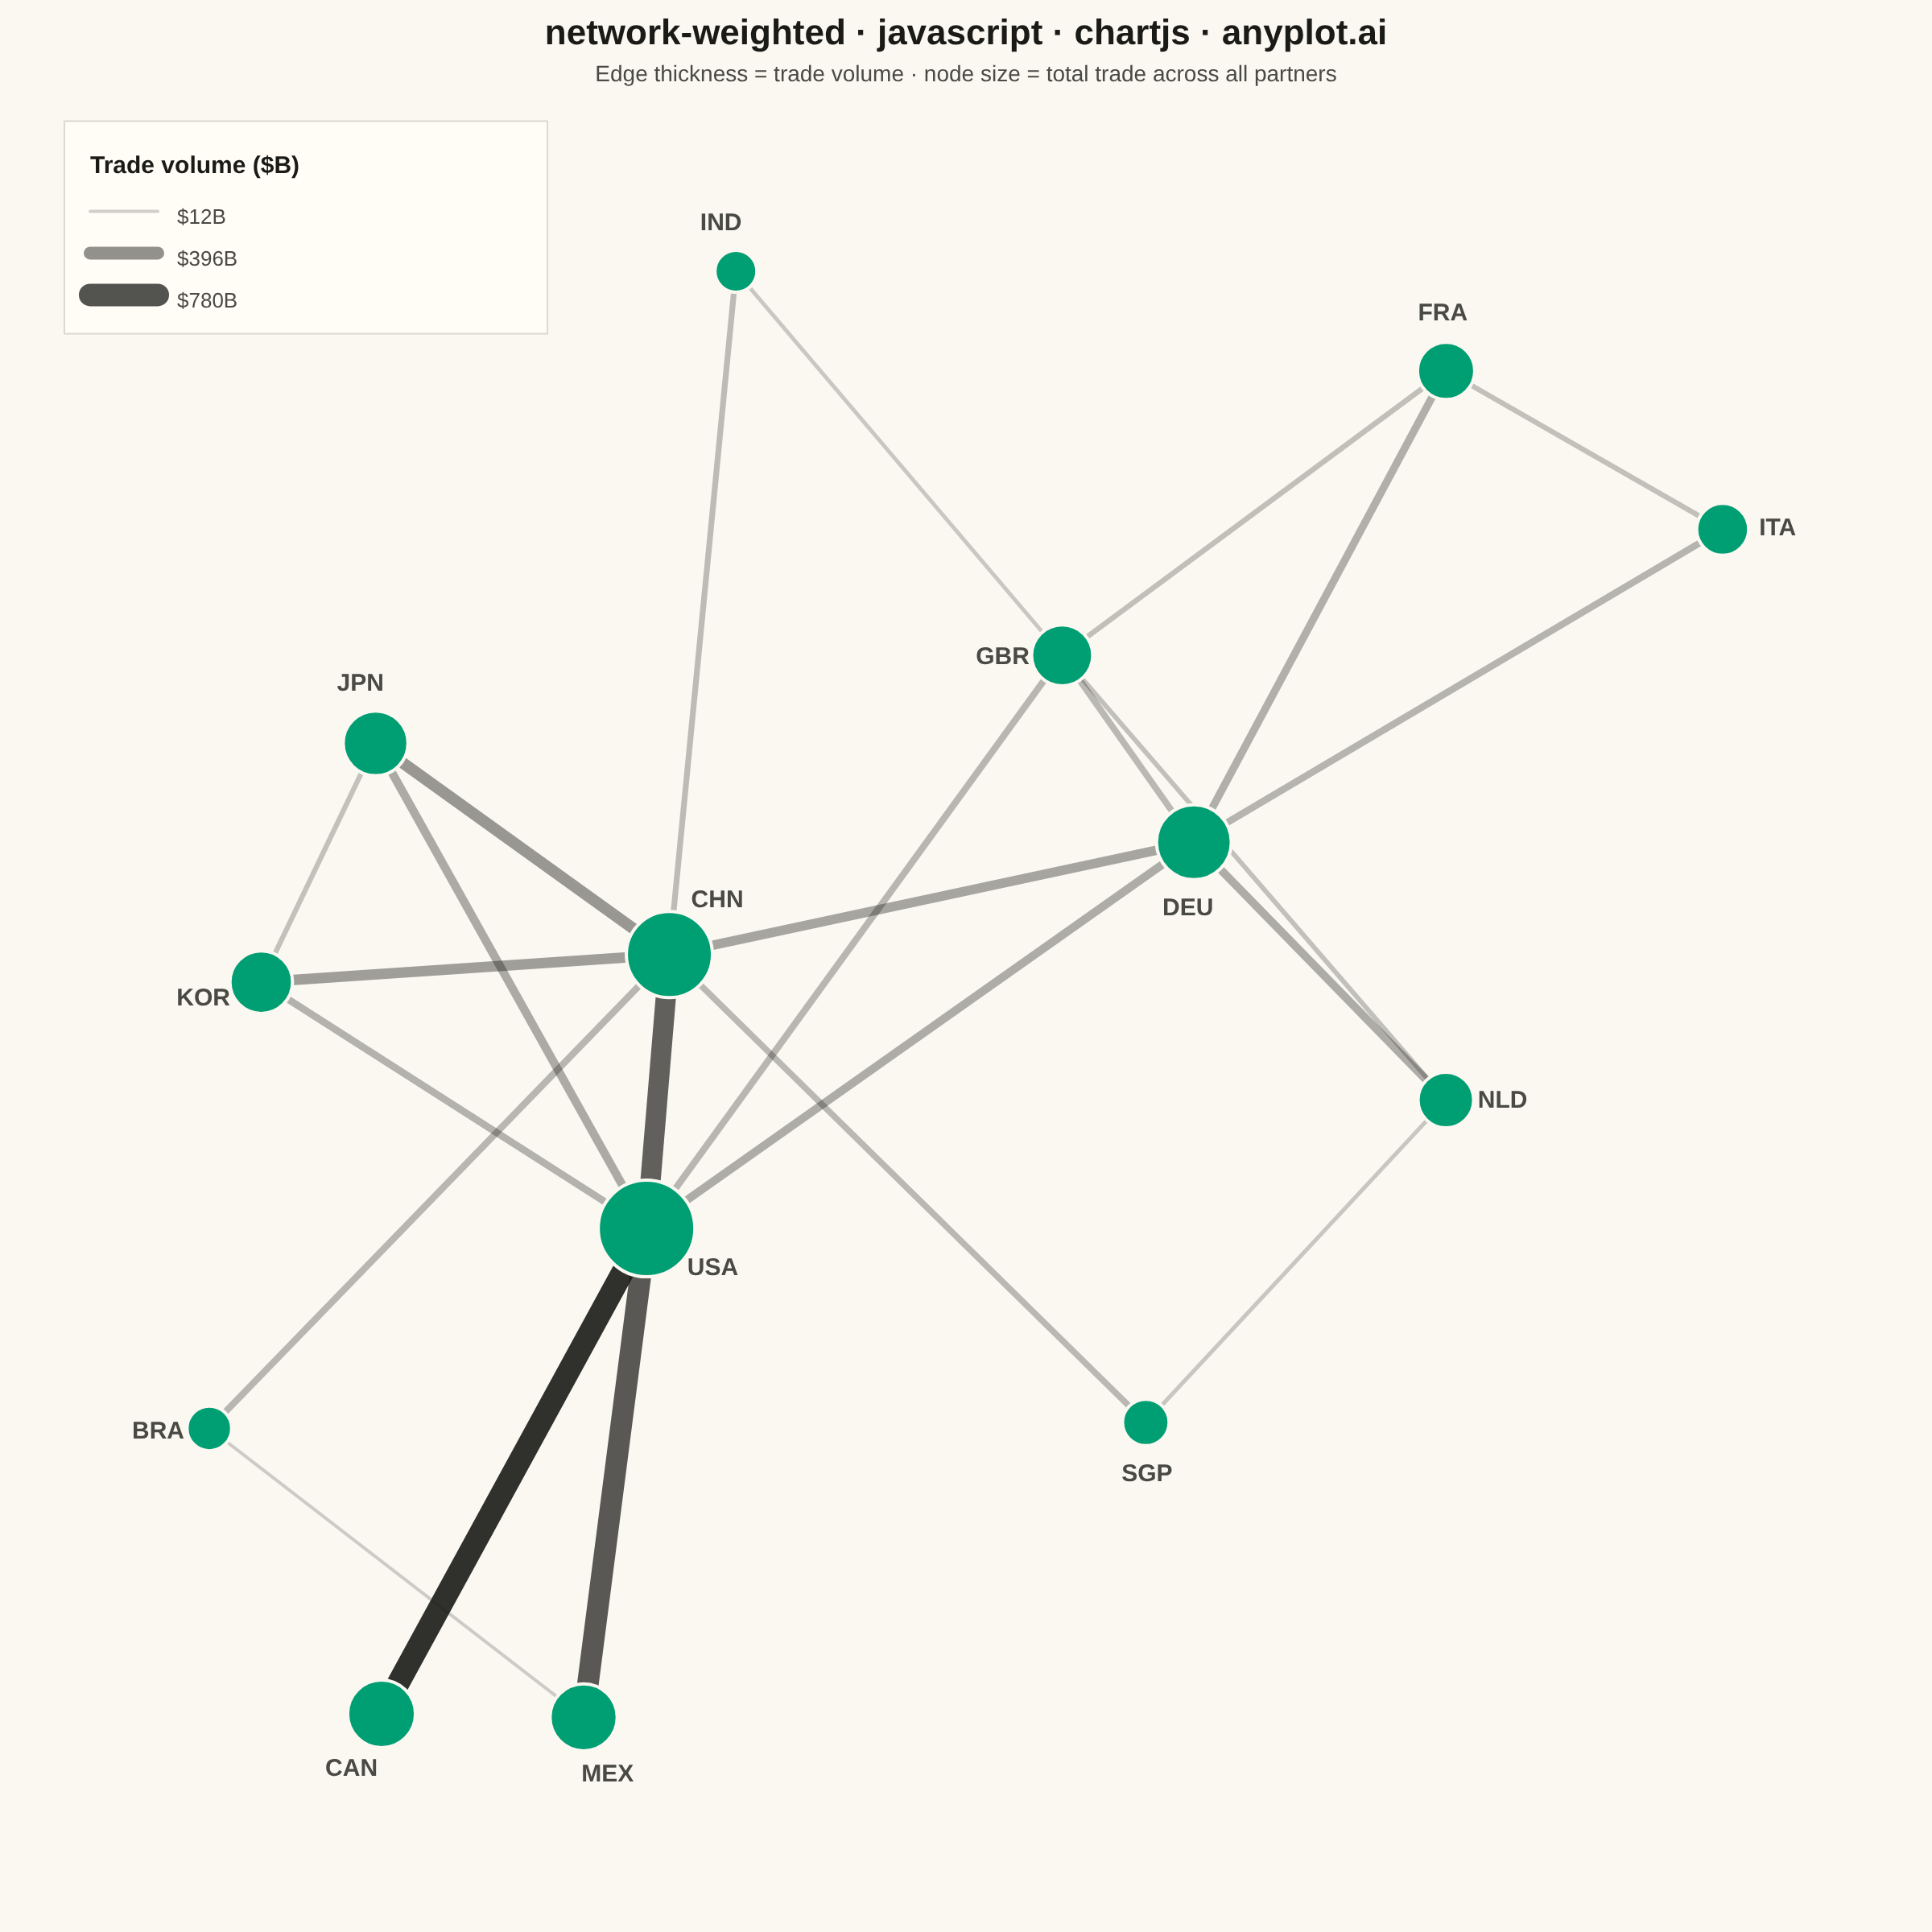
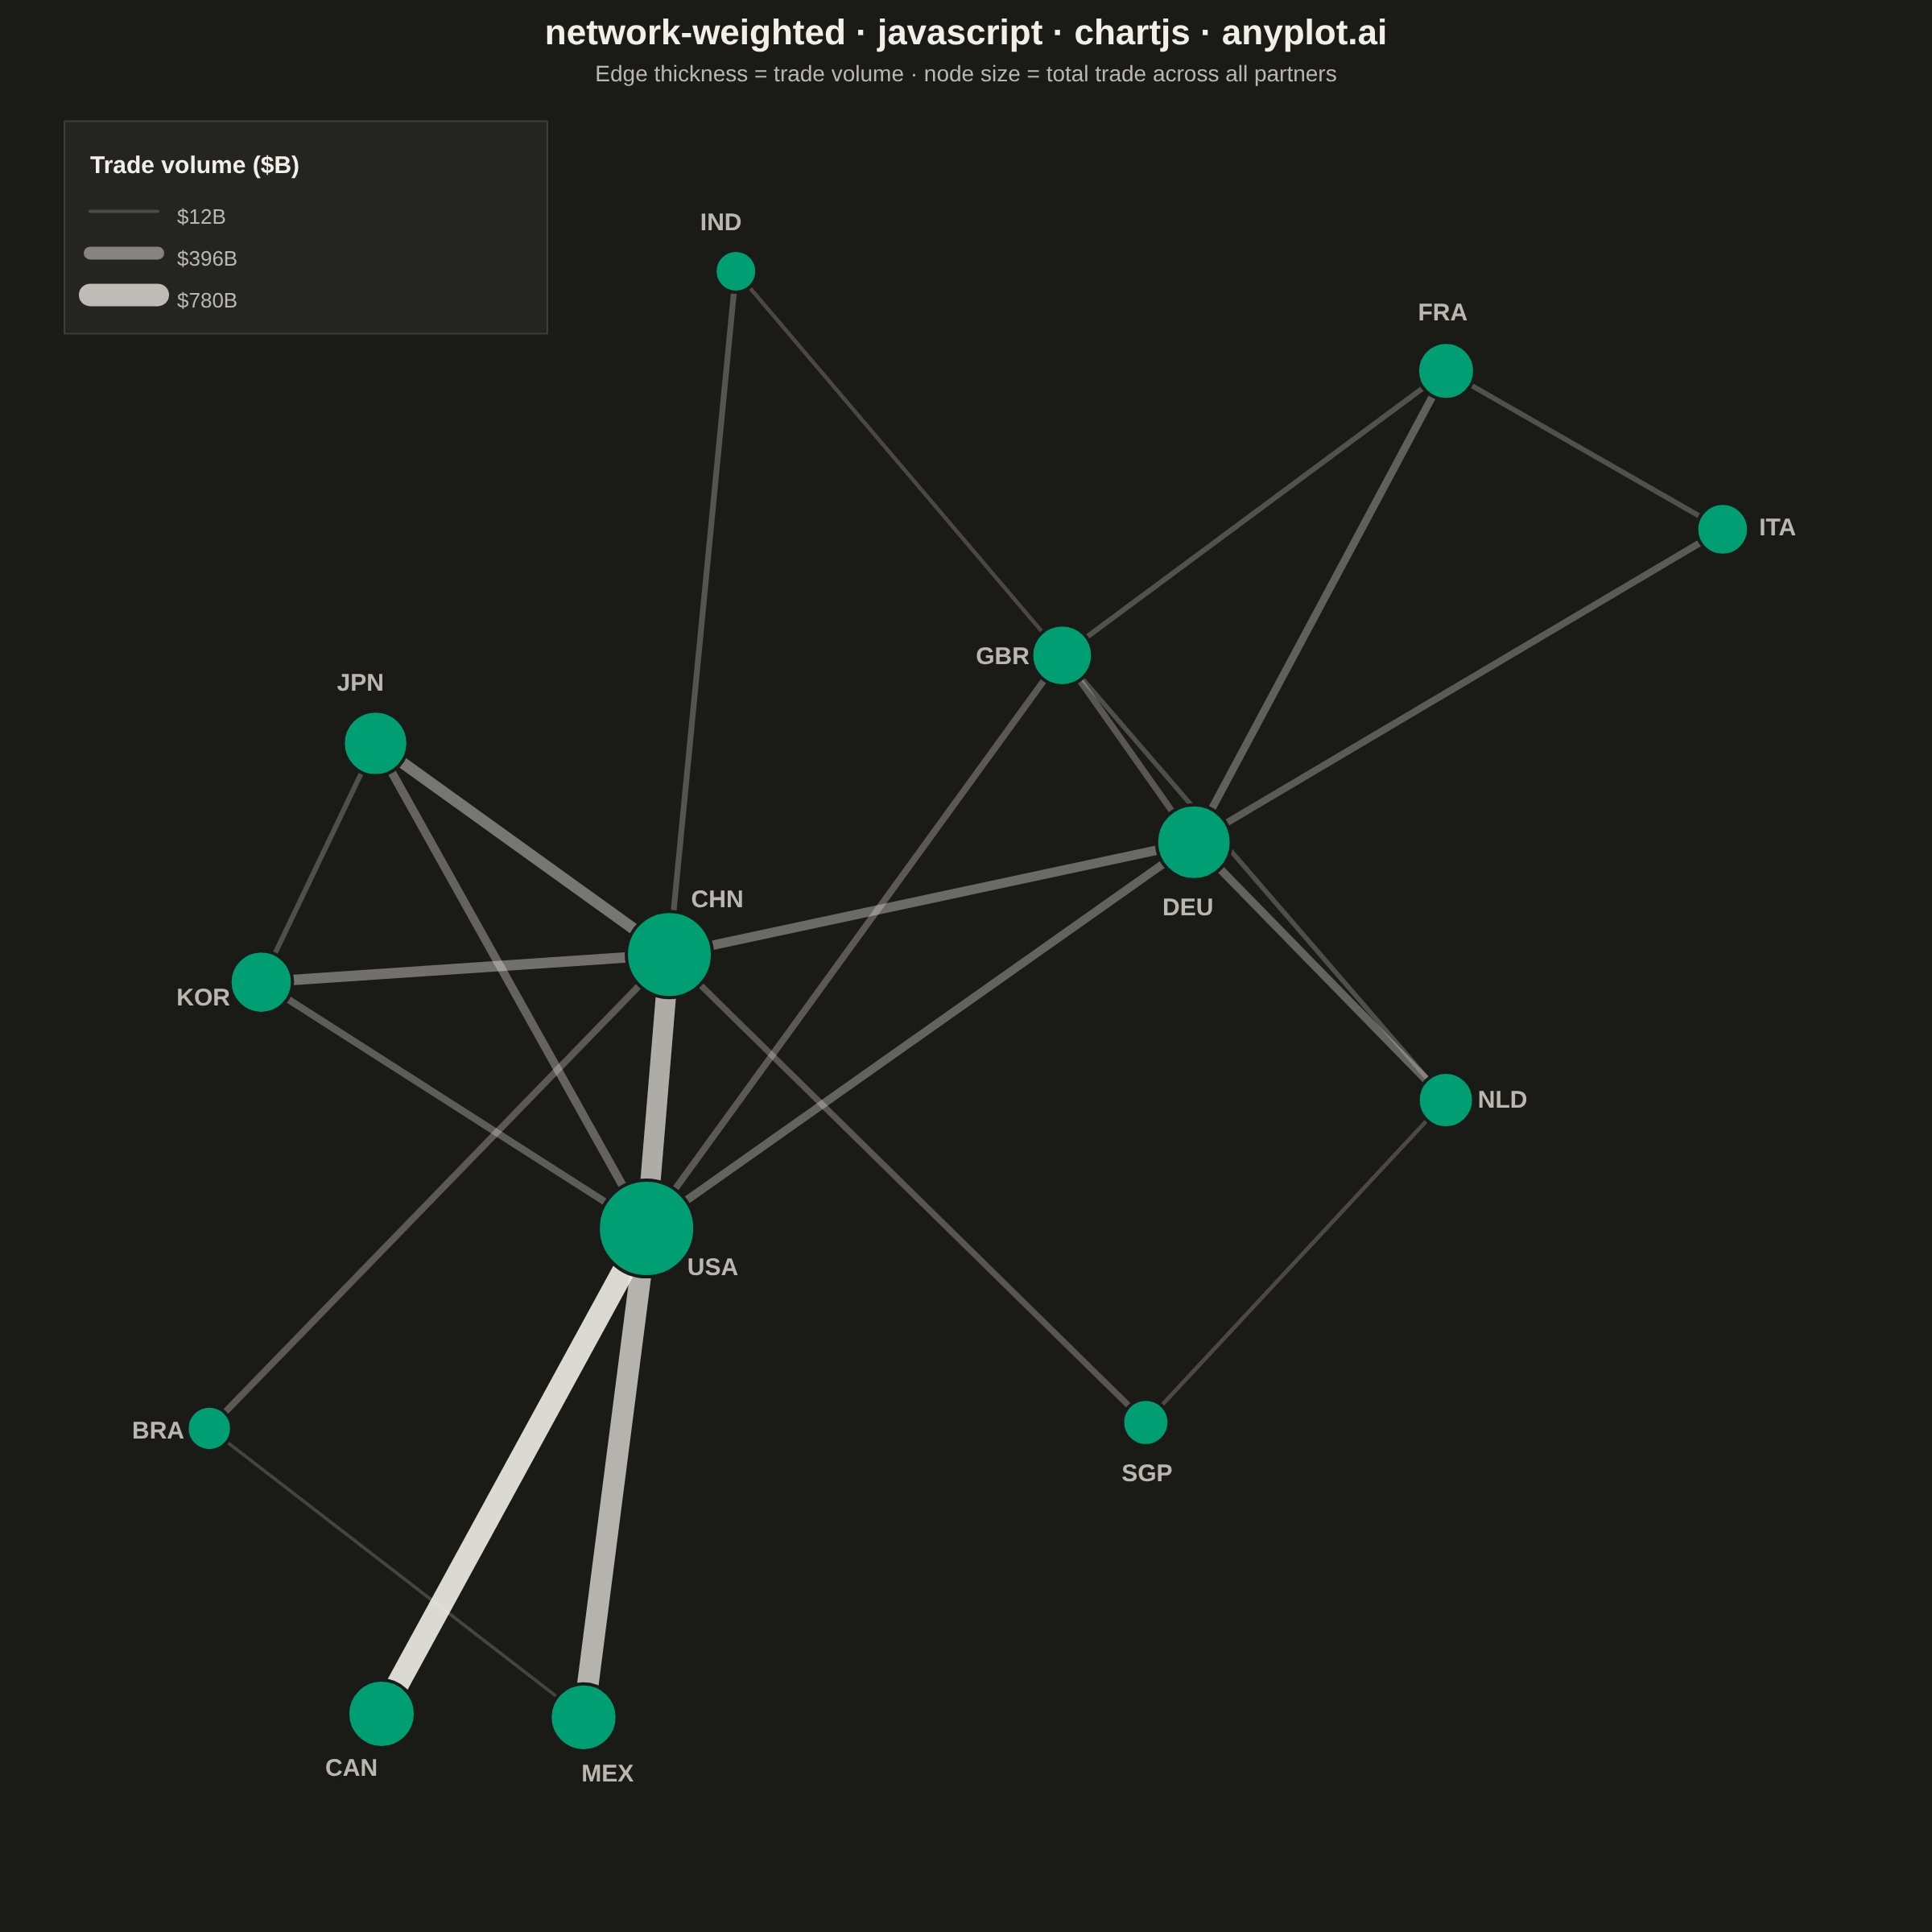
The same plot in 14 other libraries — JavaScript: D3.js, Apache ECharts, Highcharts, MUI X Charts; Python: Altair, Bokeh, lets-plot, Matplotlib, Plotly, plotnine, Pygal, Seaborn; R: ggplot2; Julia: Makie.jl. Compare all 15 side by side: Weighted Network Graph with Edge Thickness in Python, R, Julia and JavaScript.
A weighted network graph displays relationships between entities using edge thickness to represent connection strength or weight. Unlike basic network graphs where edges are uniform, the varying line widths immediately communicate the relative importance of each relationship. This visualization makes it easy to identify strong vs weak connections, central hubs with many heavy links, and structural patterns in weighted relational data.
// anyplot.ai
// network-weighted: Weighted Network Graph with Edge Thickness
// Library: chartjs 4.4.7 | JavaScript 22.23.2
// Quality: 89/100 | Created: 2026-09-02

//# anyplot-orientation: square
const t = window.ANYPLOT_TOKENS;

// --- Data: annual bilateral trade volume between major economies ($B) ------
const nodes = [
  { id: "USA" },
  { id: "CHN" },
  { id: "DEU" },
  { id: "JPN" },
  { id: "GBR" },
  { id: "FRA" },
  { id: "IND" },
  { id: "BRA" },
  { id: "CAN" },
  { id: "KOR" },
  { id: "MEX" },
  { id: "ITA" },
  { id: "NLD" },
  { id: "SGP" },
];

const rawEdges = [
  ["USA", "CAN", 780],
  ["USA", "MEX", 740],
  ["USA", "CHN", 690],
  ["USA", "JPN", 220],
  ["USA", "DEU", 210],
  ["USA", "KOR", 170],
  ["USA", "GBR", 150],
  ["CHN", "JPN", 340],
  ["CHN", "KOR", 300],
  ["CHN", "DEU", 260],
  ["CHN", "BRA", 150],
  ["CHN", "SGP", 130],
  ["CHN", "IND", 115],
  ["DEU", "NLD", 210],
  ["DEU", "FRA", 190],
  ["DEU", "ITA", 160],
  ["DEU", "GBR", 140],
  ["FRA", "GBR", 95],
  ["FRA", "ITA", 90],
  ["GBR", "NLD", 75],
  ["JPN", "KOR", 85],
  ["GBR", "IND", 40],
  ["NLD", "SGP", 45],
  ["MEX", "BRA", 12],
];

// --- Weighted-degree (node "importance") and index lookup ------------------
const idIndex = new Map(nodes.map((n, i) => [n.id, i]));
const links = rawEdges.map(([s, d, w]) => ({ s: idIndex.get(s), d: idIndex.get(d), w }));

const degree = new Array(nodes.length).fill(0);
const adjacency = nodes.map(() => []);
links.forEach(({ s, d, w }) => {
  degree[s] += w;
  degree[d] += w;
  adjacency[s].push(d);
  adjacency[d].push(s);
});

// --- Force-directed layout (deterministic: circular seed, no RNG) ----------
// Fruchterman-Reingold style simulation. Edge weight biases the attractive
// force so heavily-traded pairs are pulled closer together, per spec notes.
// A stronger repulsion constant (vs. the textbook sqrt(1/n)) keeps sparsely
// connected nodes from collapsing into the dense center, so density stays
// balanced across the square canvas rather than clumping one side.
const n = nodes.length;
const pos = nodes.map((_, i) => {
  const angle = (2 * Math.PI * i) / n;
  return { x: Math.cos(angle), y: Math.sin(angle) };
});

const k = Math.sqrt(9 / n);
const maxW = Math.max(...links.map((l) => l.w));
const minW = Math.min(...links.map((l) => l.w));
let temperature = 0.12;

for (let iter = 0; iter < 300; iter++) {
  const disp = pos.map(() => ({ x: 0, y: 0 }));

  for (let i = 0; i < n; i++) {
    for (let j = i + 1; j < n; j++) {
      const dx = pos[i].x - pos[j].x;
      const dy = pos[i].y - pos[j].y;
      const dist = Math.sqrt(dx * dx + dy * dy) || 1e-4;
      const force = (k * k) / dist;
      const ux = dx / dist;
      const uy = dy / dist;
      disp[i].x += ux * force;
      disp[i].y += uy * force;
      disp[j].x -= ux * force;
      disp[j].y -= uy * force;
    }
  }

  links.forEach(({ s, d, w }) => {
    const dx = pos[s].x - pos[d].x;
    const dy = pos[s].y - pos[d].y;
    const dist = Math.sqrt(dx * dx + dy * dy) || 1e-4;
    const strength = 0.5 + 0.9 * ((w - minW) / (maxW - minW || 1));
    const force = ((dist * dist) / k) * strength;
    const ux = dx / dist;
    const uy = dy / dist;
    disp[s].x -= ux * force;
    disp[s].y -= uy * force;
    disp[d].x += ux * force;
    disp[d].y += uy * force;
  });

  for (let i = 0; i < n; i++) {
    const len = Math.sqrt(disp[i].x ** 2 + disp[i].y ** 2) || 1e-4;
    pos[i].x += (disp[i].x / len) * Math.min(len, temperature);
    pos[i].y += (disp[i].y / len) * Math.min(len, temperature);
  }
  temperature *= 0.98;
}

// --- Fit layout to the canvas — each axis scaled to its own extent, since a
// network diagram encodes topology, not metric distance, so isotropy isn't
// required and independent-axis fitting uses the square canvas fully.
const xs = pos.map((p) => p.x);
const ys = pos.map((p) => p.y);
const cx = (Math.min(...xs) + Math.max(...xs)) / 2;
const cy = (Math.min(...ys) + Math.max(...ys)) / 2;
const halfX = (Math.max(...xs) - Math.min(...xs)) / 2 * 1.16 + 0.11;
const halfY = (Math.max(...ys) - Math.min(...ys)) / 2 * 1.16 + 0.11;

// --- Visual scales: node radius from weighted degree, edge width from weight
const minDeg = Math.min(...degree);
const maxDeg = Math.max(...degree);
const nodeRadius = degree.map((deg) => {
  const norm = (deg - minDeg) / (maxDeg - minDeg || 1);
  return 13 + Math.sqrt(norm) * 17; // 13 .. 30 CSS px
});

function edgeWidth(w) {
  const norm = (w - minW) / (maxW - minW || 1);
  return 2 + norm * 12; // 2 .. 14 CSS px — distinguishable, never extreme
}

// The single heaviest trade corridor gets a subtle opacity boost (not a hue
// change, so the single-series CVD-safe encoding is untouched) — a small
// extra focal point beyond size/thickness alone, per the review's DE-03 note.
const heaviestW = maxW;

// --- Custom plugin: draws edges beneath nodes, labels + legend above -------
const networkLayer = {
  id: "networkLayer",
  beforeDatasetsDraw(chart) {
    const { ctx, scales } = chart;
    ctx.save();
    links.forEach(({ s, d, w }) => {
      const x1 = scales.x.getPixelForValue(pos[s].x);
      const y1 = scales.y.getPixelForValue(pos[s].y);
      const x2 = scales.x.getPixelForValue(pos[d].x);
      const y2 = scales.y.getPixelForValue(pos[d].y);
      const norm = (w - minW) / (maxW - minW || 1);
      ctx.beginPath();
      ctx.moveTo(x1, y1);
      ctx.lineTo(x2, y2);
      ctx.lineWidth = edgeWidth(w);
      ctx.lineCap = "round";
      ctx.strokeStyle = t.ink;
      ctx.globalAlpha = w === heaviestW ? 0.9 : 0.2 + norm * 0.55;
      ctx.stroke();
    });
    ctx.restore();
  },
  afterDatasetsDraw(chart) {
    const { ctx, scales, chartArea } = chart;
    ctx.save();

    // node id labels — anchored in the widest open angular gap between a
    // node's incident edges (falling back to straight south for isolated
    // nodes), plus a page-background halo behind the text, so a label never
    // visually merges with an edge stroke crossing beneath it.
    const px = pos.map((p) => scales.x.getPixelForValue(p.x));
    const py = pos.map((p) => scales.y.getPixelForValue(p.y));

    ctx.font = "600 15px sans-serif";
    ctx.textAlign = "center";
    ctx.textBaseline = "middle";
    ctx.lineJoin = "round";
    nodes.forEach((node, i) => {
      const neighbors = adjacency[i];
      let labelAngle = Math.PI / 2; // default: straight down
      if (neighbors.length > 0) {
        const angles = neighbors
          .map((j) => Math.atan2(py[j] - py[i], px[j] - px[i]))
          .sort((a, b) => a - b);
        let bestGap = -Infinity;
        let bestMid = labelAngle;
        for (let gi = 0; gi < angles.length; gi++) {
          const a0 = angles[gi];
          const a1 = angles[(gi + 1) % angles.length];
          const gap = ((a1 - a0 + 2 * Math.PI) % (2 * Math.PI)) || 2 * Math.PI;
          if (gap > bestGap) {
            bestGap = gap;
            bestMid = a0 + gap / 2;
          }
        }
        labelAngle = bestMid;
      }
      const offset = nodeRadius[i] + 18;
      const lx = px[i] + Math.cos(labelAngle) * offset;
      const ly = py[i] + Math.sin(labelAngle) * offset;

      ctx.lineWidth = 4;
      ctx.strokeStyle = t.pageBg;
      ctx.strokeText(node.id, lx, ly);
      ctx.fillStyle = t.inkSoft;
      ctx.fillText(node.id, lx, ly);
    });

    // edge-weight legend
    const legendW = 300;
    const legendH = 132;
    const lx = chartArea.left + 8;
    const ly = chartArea.top + 8;

    ctx.fillStyle = t.elevatedBg;
    ctx.fillRect(lx, ly, legendW, legendH);
    ctx.strokeStyle = t.grid;
    ctx.lineWidth = 1;
    ctx.strokeRect(lx, ly, legendW, legendH);

    ctx.textAlign = "left";
    ctx.fillStyle = t.ink;
    ctx.font = "600 15px sans-serif";
    ctx.fillText("Trade volume ($B)", lx + 16, ly + 28);

    const samples = [minW, (minW + maxW) / 2, maxW];
    samples.forEach((w, i) => {
      const rowY = ly + 56 + i * 26;
      const norm = (w - minW) / (maxW - minW || 1);

      ctx.globalAlpha = 0.2 + norm * 0.55;
      ctx.strokeStyle = t.ink;
      ctx.lineWidth = edgeWidth(w);
      ctx.lineCap = "round";
      ctx.beginPath();
      ctx.moveTo(lx + 16, rowY);
      ctx.lineTo(lx + 58, rowY);
      ctx.stroke();
      ctx.globalAlpha = 1;

      ctx.fillStyle = t.inkSoft;
      ctx.font = "13px sans-serif";
      ctx.fillText(`$${Math.round(w)}B`, lx + 70, rowY + 4);
    });

    ctx.restore();
  },
};

// --- Mount -------------------------------------------------------------------
const canvas = document.createElement("canvas");
document.getElementById("container").appendChild(canvas);

// --- Chart -------------------------------------------------------------------
new Chart(canvas, {
  type: "scatter",
  data: {
    datasets: [
      {
        label: "Countries",
        data: pos,
        pointRadius: nodeRadius,
        pointHoverRadius: nodeRadius,
        backgroundColor: t.palette[0],
        borderColor: t.pageBg,
        borderWidth: 2,
      },
    ],
  },
  options: {
    responsive: true,
    maintainAspectRatio: false,
    animation: false,
    layout: { padding: 8 },
    plugins: {
      title: {
        display: true,
        text: "network-weighted · javascript · chartjs · anyplot.ai",
        color: t.ink,
        font: { size: 22 },
        padding: { bottom: 4 },
      },
      subtitle: {
        display: true,
        text: "Edge thickness = trade volume · node size = total trade across all partners",
        color: t.inkSoft,
        font: { size: 14, weight: "normal" },
        padding: { bottom: 12 },
      },
      legend: { display: false },
      tooltip: { enabled: false },
    },
    scales: {
      x: { type: "linear", min: cx - halfX, max: cx + halfX, display: false },
      y: { type: "linear", min: cy - halfY, max: cy + halfY, display: false },
    },
  },
  plugins: [networkLayer],
});
Runnable source as JSON, for any HTTP client: https://api.anyplot.ai/specs/network-weighted/chartjs/code. Any spec id and library id listed in llms-full.txt fit the same URL shape; every URL below is complete and callable.
{
  "spec_id": "network-weighted",
  "language": "javascript",
  "library": "chartjs",
  "page": "https://anyplot.ai/network-weighted/javascript/chartjs",
  "hub": "https://anyplot.ai/network-weighted",
  "code_json": "https://api.anyplot.ai/specs/network-weighted/chartjs/code",
  "spec_json": "https://api.anyplot.ai/specs/network-weighted",
  "render_light_png": "https://storage.googleapis.com/anyplot-images/plots/network-weighted/javascript/chartjs/plot-light.png",
  "render_dark_png": "https://storage.googleapis.com/anyplot-images/plots/network-weighted/javascript/chartjs/plot-dark.png",
  "interactive_light_html": "https://storage.googleapis.com/anyplot-images/plots/network-weighted/javascript/chartjs/plot-light.html",
  "interactive_dark_html": "https://storage.googleapis.com/anyplot-images/plots/network-weighted/javascript/chartjs/plot-dark.html",
  "quality_score": 89.0,
  "license": "MIT",
  "guide": "https://anyplot.ai/llms.txt"
}
Part of Weighted Network Graph with Edge Thickness on anyplot.ai.