The same plot in 14 other libraries — JavaScript: Chart.js, Apache ECharts, Highcharts, MUI X Charts; Python: Altair, Bokeh, lets-plot, Matplotlib, Plotly, plotnine, Pygal, Seaborn; R: ggplot2; Julia: Makie.jl. Compare all 15 side by side: Weighted Network Graph with Edge Thickness in Python, R, Julia and JavaScript.
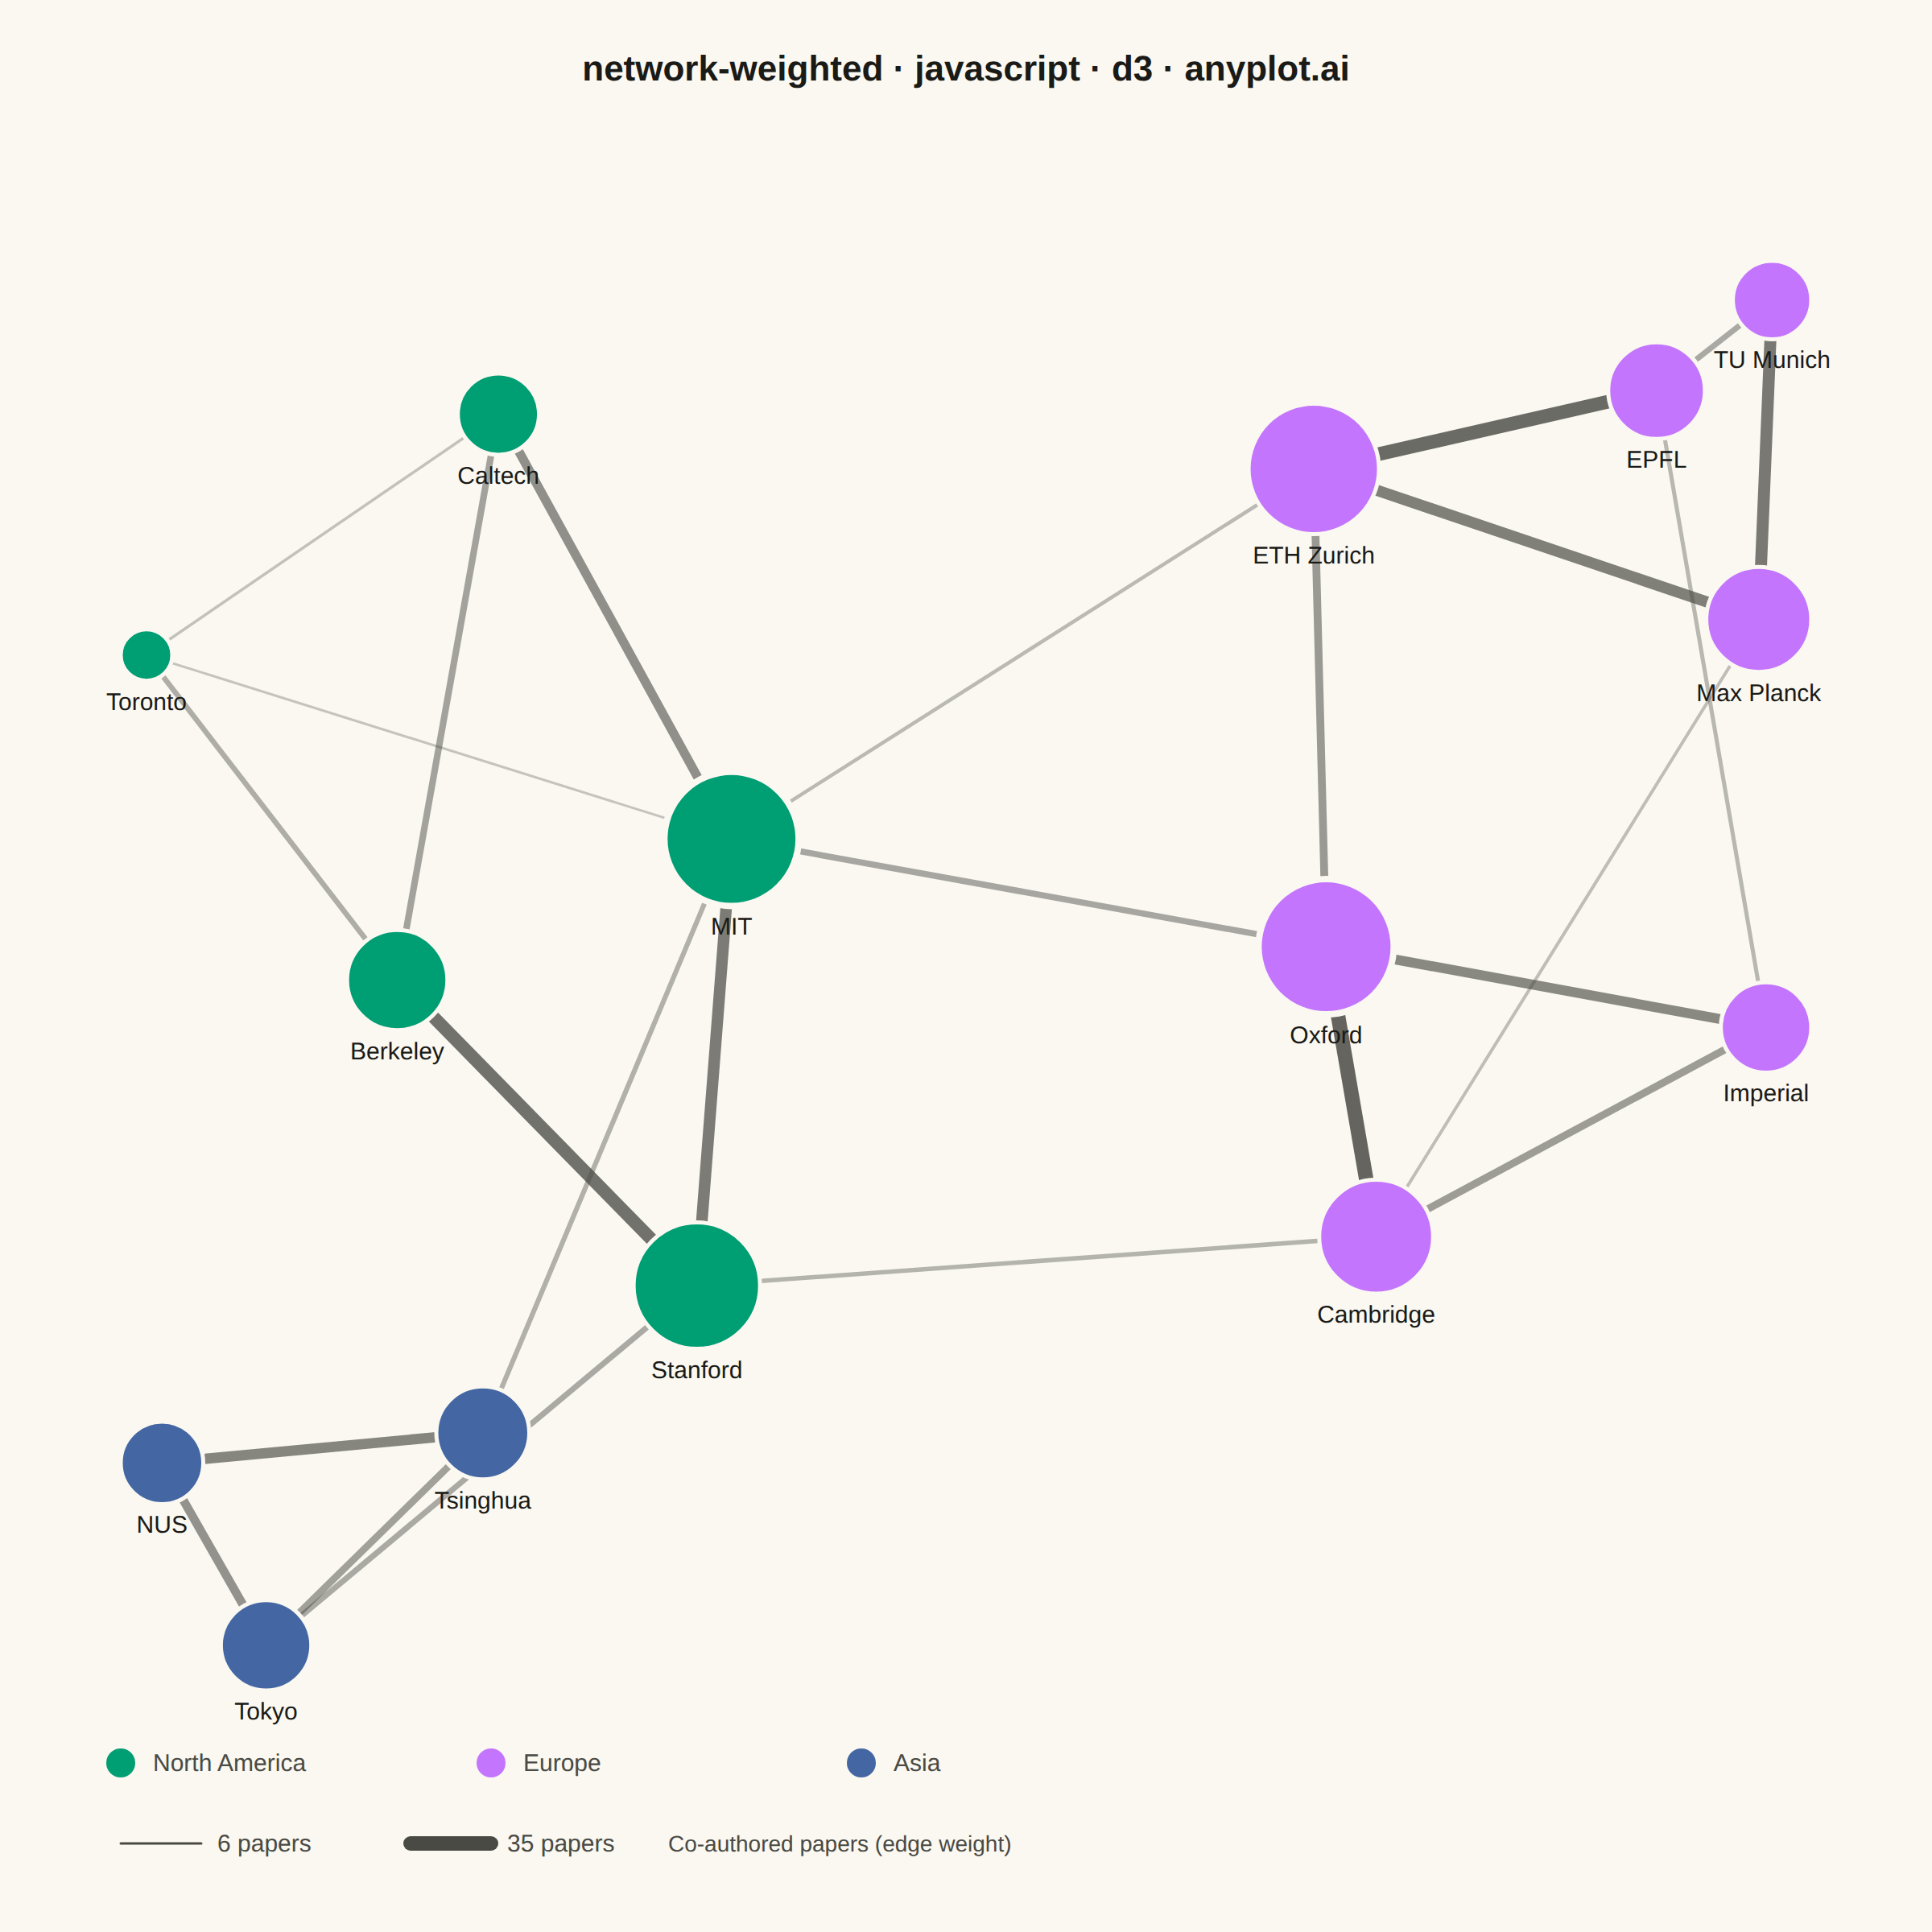
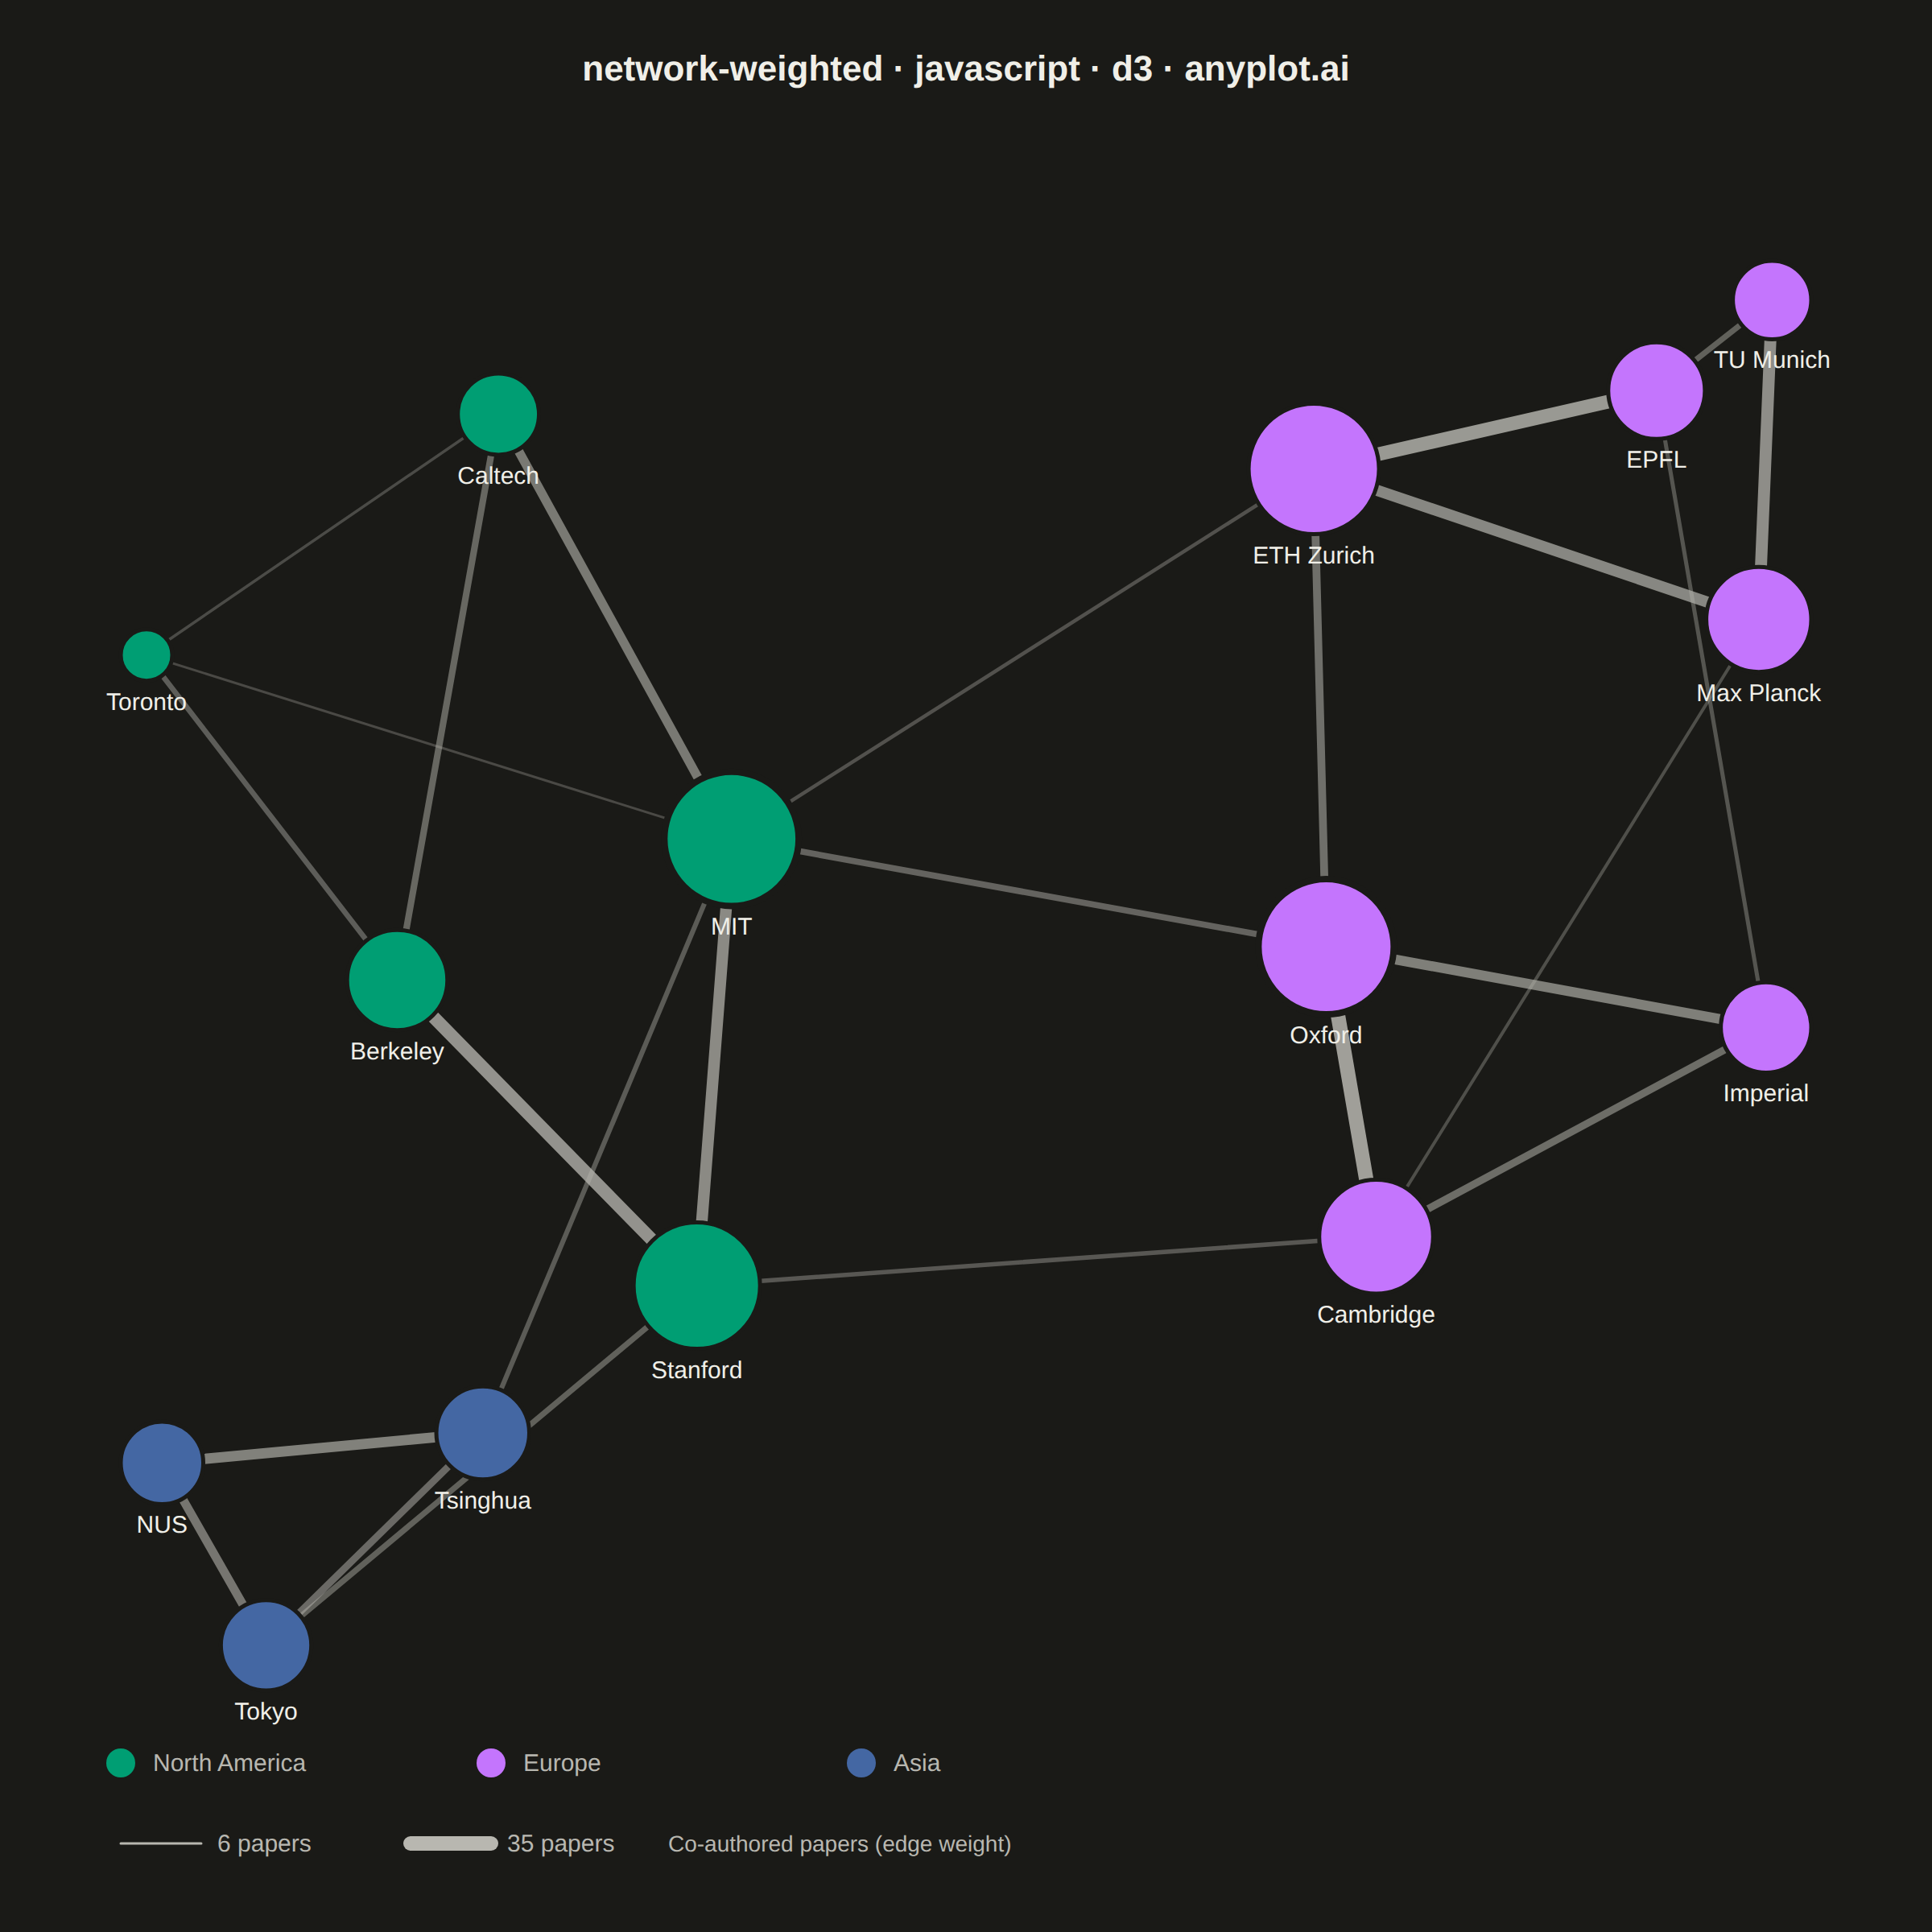
A weighted network graph displays relationships between entities using edge thickness to represent connection strength or weight. Unlike basic network graphs where edges are uniform, the varying line widths immediately communicate the relative importance of each relationship. This visualization makes it easy to identify strong vs weak connections, central hubs with many heavy links, and structural patterns in weighted relational data.
// anyplot.ai
// network-weighted: Weighted Network Graph with Edge Thickness
// Library: d3 7.9.0 | JavaScript 22.23.2
// Quality: 89/100 | Created: 2026-09-02
//# anyplot-orientation: square

const t = window.ANYPLOT_TOKENS;
const { width, height } = window.ANYPLOT_SIZE;

// --- Layout bands (title / graph / legend) ----------------------------------
const titleY = 50;
const chartTop = 100;
const chartBottom = height - 150;
const chartLeft = 75;
const chartRight = width - 75;
const iw = chartRight - chartLeft;
const ih = chartBottom - chartTop;
const legendRegionY = chartBottom + 45;
const legendEdgeY = chartBottom + 95;

// --- Data: research-collaboration network (in-memory, deterministic) -------
// Nodes = universities, group = home continent. Edges = co-authored papers
// (2023-2025), weight = paper count, mapped to edge thickness + opacity.
const nodes = [
  { id: "MIT", group: "na" },
  { id: "Stanford", group: "na" },
  { id: "Caltech", group: "na" },
  { id: "Berkeley", group: "na" },
  { id: "Toronto", group: "na" },
  { id: "Oxford", group: "eu" },
  { id: "Cambridge", group: "eu" },
  { id: "ETH Zurich", group: "eu" },
  { id: "TU Munich", group: "eu" },
  { id: "EPFL", group: "eu" },
  { id: "Max Planck", group: "eu" },
  { id: "Imperial", group: "eu" },
  { id: "Tokyo", group: "asia" },
  { id: "NUS", group: "asia" },
  { id: "Tsinghua", group: "asia" },
];

const links = [
  { source: "MIT", target: "Stanford", weight: 28 },
  { source: "MIT", target: "Oxford", weight: 15 },
  { source: "MIT", target: "ETH Zurich", weight: 9 },
  { source: "MIT", target: "Caltech", weight: 22 },
  { source: "MIT", target: "Tsinghua", weight: 12 },
  { source: "Stanford", target: "Berkeley", weight: 31 },
  { source: "Stanford", target: "Cambridge", weight: 11 },
  { source: "Stanford", target: "Tokyo", weight: 14 },
  { source: "Oxford", target: "Cambridge", weight: 35 },
  { source: "Oxford", target: "ETH Zurich", weight: 19 },
  { source: "Oxford", target: "Imperial", weight: 24 },
  { source: "ETH Zurich", target: "Max Planck", weight: 27 },
  { source: "ETH Zurich", target: "EPFL", weight: 33 },
  { source: "Cambridge", target: "Imperial", weight: 18 },
  { source: "Cambridge", target: "Max Planck", weight: 8 },
  { source: "Caltech", target: "Berkeley", weight: 16 },
  { source: "Caltech", target: "Toronto", weight: 7 },
  { source: "Berkeley", target: "Toronto", weight: 13 },
  { source: "Tokyo", target: "NUS", weight: 21 },
  { source: "Tokyo", target: "Tsinghua", weight: 17 },
  { source: "NUS", target: "Tsinghua", weight: 25 },
  { source: "TU Munich", target: "Max Planck", weight: 29 },
  { source: "TU Munich", target: "EPFL", weight: 14 },
  { source: "EPFL", target: "Imperial", weight: 10 },
  { source: "Toronto", target: "MIT", weight: 6 },
];

// Weighted degree (sum of incident edge weights) drives node size.
const weightedDegree = new Map(nodes.map((d) => [d.id, 0]));
links.forEach((l) => {
  weightedDegree.set(l.source, weightedDegree.get(l.source) + l.weight);
  weightedDegree.set(l.target, weightedDegree.get(l.target) + l.weight);
});
nodes.forEach((d) => {
  d.weightedDegree = weightedDegree.get(d.id);
});

// --- Scales -------------------------------------------------------------
const [minWeight, maxWeight] = d3.extent(links, (d) => d.weight);
const radius = d3
  .scaleSqrt()
  .domain(d3.extent(nodes, (d) => d.weightedDegree))
  .range([16, 42]);
const edgeWidth = d3.scaleLinear().domain([minWeight, maxWeight]).range([1.5, 9]);
const edgeOpacity = d3.scaleLinear().domain([minWeight, maxWeight]).range([0.3, 0.85]);
// Wider floor (170 vs. the prior 140) keeps the heaviest-weight pairs — which
// cluster in the dense Europe sub-network — from being pulled in tight enough
// for their edges to cross neighboring nodes and labels.
const linkDistance = d3.scaleLinear().domain([minWeight, maxWeight]).range([380, 170]);
const groupColor = d3
  .scaleOrdinal()
  .domain(["na", "eu", "asia"])
  .range([t.palette[0], t.palette[1], t.palette[2]]);

// Two hub nodes (by weighted degree) get a bolder stroke and render above the
// rest of the nodes/edges to sharpen the visual focal point.
const hubIds = new Set(
  [...nodes].sort((a, b) => b.weightedDegree - a.weightedDegree).slice(0, 2).map((d) => d.id),
);

// --- Force layout, advanced synchronously (no animation in the static PNG) --
const simulation = d3
  .forceSimulation(nodes)
  .force(
    "link",
    d3
      .forceLink(links)
      .id((d) => d.id)
      .distance((d) => linkDistance(d.weight))
      .strength(0.55),
  )
  .force("charge", d3.forceManyBody().strength(-1500))
  .force("center", d3.forceCenter(chartLeft + iw / 2, chartTop + ih / 2))
  .force(
    "collide",
    d3.forceCollide().radius((d) => radius(d.weightedDegree) + 22),
  )
  .stop();

for (let i = 0; i < 600; i += 1) simulation.tick();

// Keep every node (and its label) inside the graph band.
nodes.forEach((d) => {
  const r = radius(d.weightedDegree);
  d.x = Math.max(chartLeft + r, Math.min(chartRight - r, d.x));
  d.y = Math.max(chartTop + r, Math.min(chartBottom - r, d.y));
});

// --- SVG mount ----------------------------------------------------------
const svg = d3.select("#container").append("svg").attr("width", width).attr("height", height);

// --- Edges ----------------------------------------------------------------
svg
  .append("g")
  .selectAll("line")
  .data(links)
  .join("line")
  .attr("x1", (d) => d.source.x)
  .attr("y1", (d) => d.source.y)
  .attr("x2", (d) => d.target.x)
  .attr("y2", (d) => d.target.y)
  .attr("stroke", t.inkSoft)
  .attr("stroke-width", (d) => edgeWidth(d.weight))
  .attr("stroke-opacity", (d) => edgeOpacity(d.weight))
  .attr("stroke-linecap", "round");

// --- Nodes + labels ---------------------------------------------------------
// Draw ascending by weighted degree so the two hub nodes render last (on top
// of every crossing edge and neighboring node) for a sharper focal point.
const drawOrder = [...nodes].sort((a, b) => a.weightedDegree - b.weightedDegree);
const nodeGroups = svg
  .append("g")
  .selectAll("g")
  .data(drawOrder)
  .join("g")
  .attr("transform", (d) => `translate(${d.x},${d.y})`);

nodeGroups
  .append("circle")
  .attr("r", (d) => radius(d.weightedDegree))
  .attr("fill", (d) => groupColor(d.group))
  .attr("stroke", t.pageBg)
  .attr("stroke-width", (d) => (hubIds.has(d.id) ? 4 : 2.5));

nodeGroups
  .append("text")
  .attr("y", (d) => radius(d.weightedDegree) + 18)
  .attr("text-anchor", "middle")
  .attr("fill", t.ink)
  .style("font-size", "15px")
  .style("font-weight", 500)
  .text((d) => d.id);

// --- Legend: region colors ---------------------------------------------
const regionLegend = [
  { label: "North America", color: t.palette[0] },
  { label: "Europe", color: t.palette[1] },
  { label: "Asia", color: t.palette[2] },
];
const regionSpacing = 230;
const regionLegendG = svg.append("g");
regionLegend.forEach((d, i) => {
  const g = regionLegendG
    .append("g")
    .attr("transform", `translate(${chartLeft + i * regionSpacing},${legendRegionY})`);
  g.append("circle").attr("r", 9).attr("fill", d.color);
  g.append("text")
    .attr("x", 20)
    .attr("y", 5)
    .attr("fill", t.inkSoft)
    .style("font-size", "15px")
    .text(d.label);
});

// --- Legend: edge-weight scale --------------------------------------------
const edgeLegendG = svg.append("g").attr("transform", `translate(${chartLeft},${legendEdgeY})`);
edgeLegendG
  .append("line")
  .attr("x1", 0)
  .attr("x2", 50)
  .attr("y1", 0)
  .attr("y2", 0)
  .attr("stroke", t.inkSoft)
  .attr("stroke-width", edgeWidth(minWeight))
  .attr("stroke-linecap", "round");
edgeLegendG
  .append("text")
  .attr("x", 60)
  .attr("y", 5)
  .attr("fill", t.inkSoft)
  .style("font-size", "15px")
  .text(`${minWeight} papers`);
edgeLegendG
  .append("line")
  .attr("x1", 180)
  .attr("x2", 230)
  .attr("y1", 0)
  .attr("y2", 0)
  .attr("stroke", t.inkSoft)
  .attr("stroke-width", edgeWidth(maxWeight))
  .attr("stroke-linecap", "round");
edgeLegendG
  .append("text")
  .attr("x", 240)
  .attr("y", 5)
  .attr("fill", t.inkSoft)
  .style("font-size", "15px")
  .text(`${maxWeight} papers`);
edgeLegendG
  .append("text")
  .attr("x", 340)
  .attr("y", 5)
  .attr("fill", t.inkSoft)
  .style("font-size", "14px")
  .text("Co-authored papers (edge weight)");

// --- Title ------------------------------------------------------------------
const titleText = "network-weighted · javascript · d3 · anyplot.ai";
const titleDefaultSize = 22;
const titleFloor = 15;
const titleRatio = titleText.length > 67 ? 67 / titleText.length : 1;
const titleFontSize = Math.max(titleFloor, Math.round(titleDefaultSize * titleRatio));
svg
  .append("text")
  .attr("x", width / 2)
  .attr("y", titleY)
  .attr("text-anchor", "middle")
  .attr("fill", t.ink)
  .style("font-weight", 600)
  .style("font-size", `${titleFontSize}px`)
  .text(titleText);
Runnable source as JSON, for any HTTP client: https://api.anyplot.ai/specs/network-weighted/d3/code. Any spec id and library id listed in llms-full.txt fit the same URL shape; every URL below is complete and callable.
{
  "spec_id": "network-weighted",
  "language": "javascript",
  "library": "d3",
  "page": "https://anyplot.ai/network-weighted/javascript/d3",
  "hub": "https://anyplot.ai/network-weighted",
  "code_json": "https://api.anyplot.ai/specs/network-weighted/d3/code",
  "spec_json": "https://api.anyplot.ai/specs/network-weighted",
  "render_light_png": "https://storage.googleapis.com/anyplot-images/plots/network-weighted/javascript/d3/plot-light.png",
  "render_dark_png": "https://storage.googleapis.com/anyplot-images/plots/network-weighted/javascript/d3/plot-dark.png",
  "interactive_light_html": "https://storage.googleapis.com/anyplot-images/plots/network-weighted/javascript/d3/plot-light.html",
  "interactive_dark_html": "https://storage.googleapis.com/anyplot-images/plots/network-weighted/javascript/d3/plot-dark.html",
  "quality_score": 89.0,
  "license": "MIT",
  "guide": "https://anyplot.ai/llms.txt"
}
Part of Weighted Network Graph with Edge Thickness on anyplot.ai.