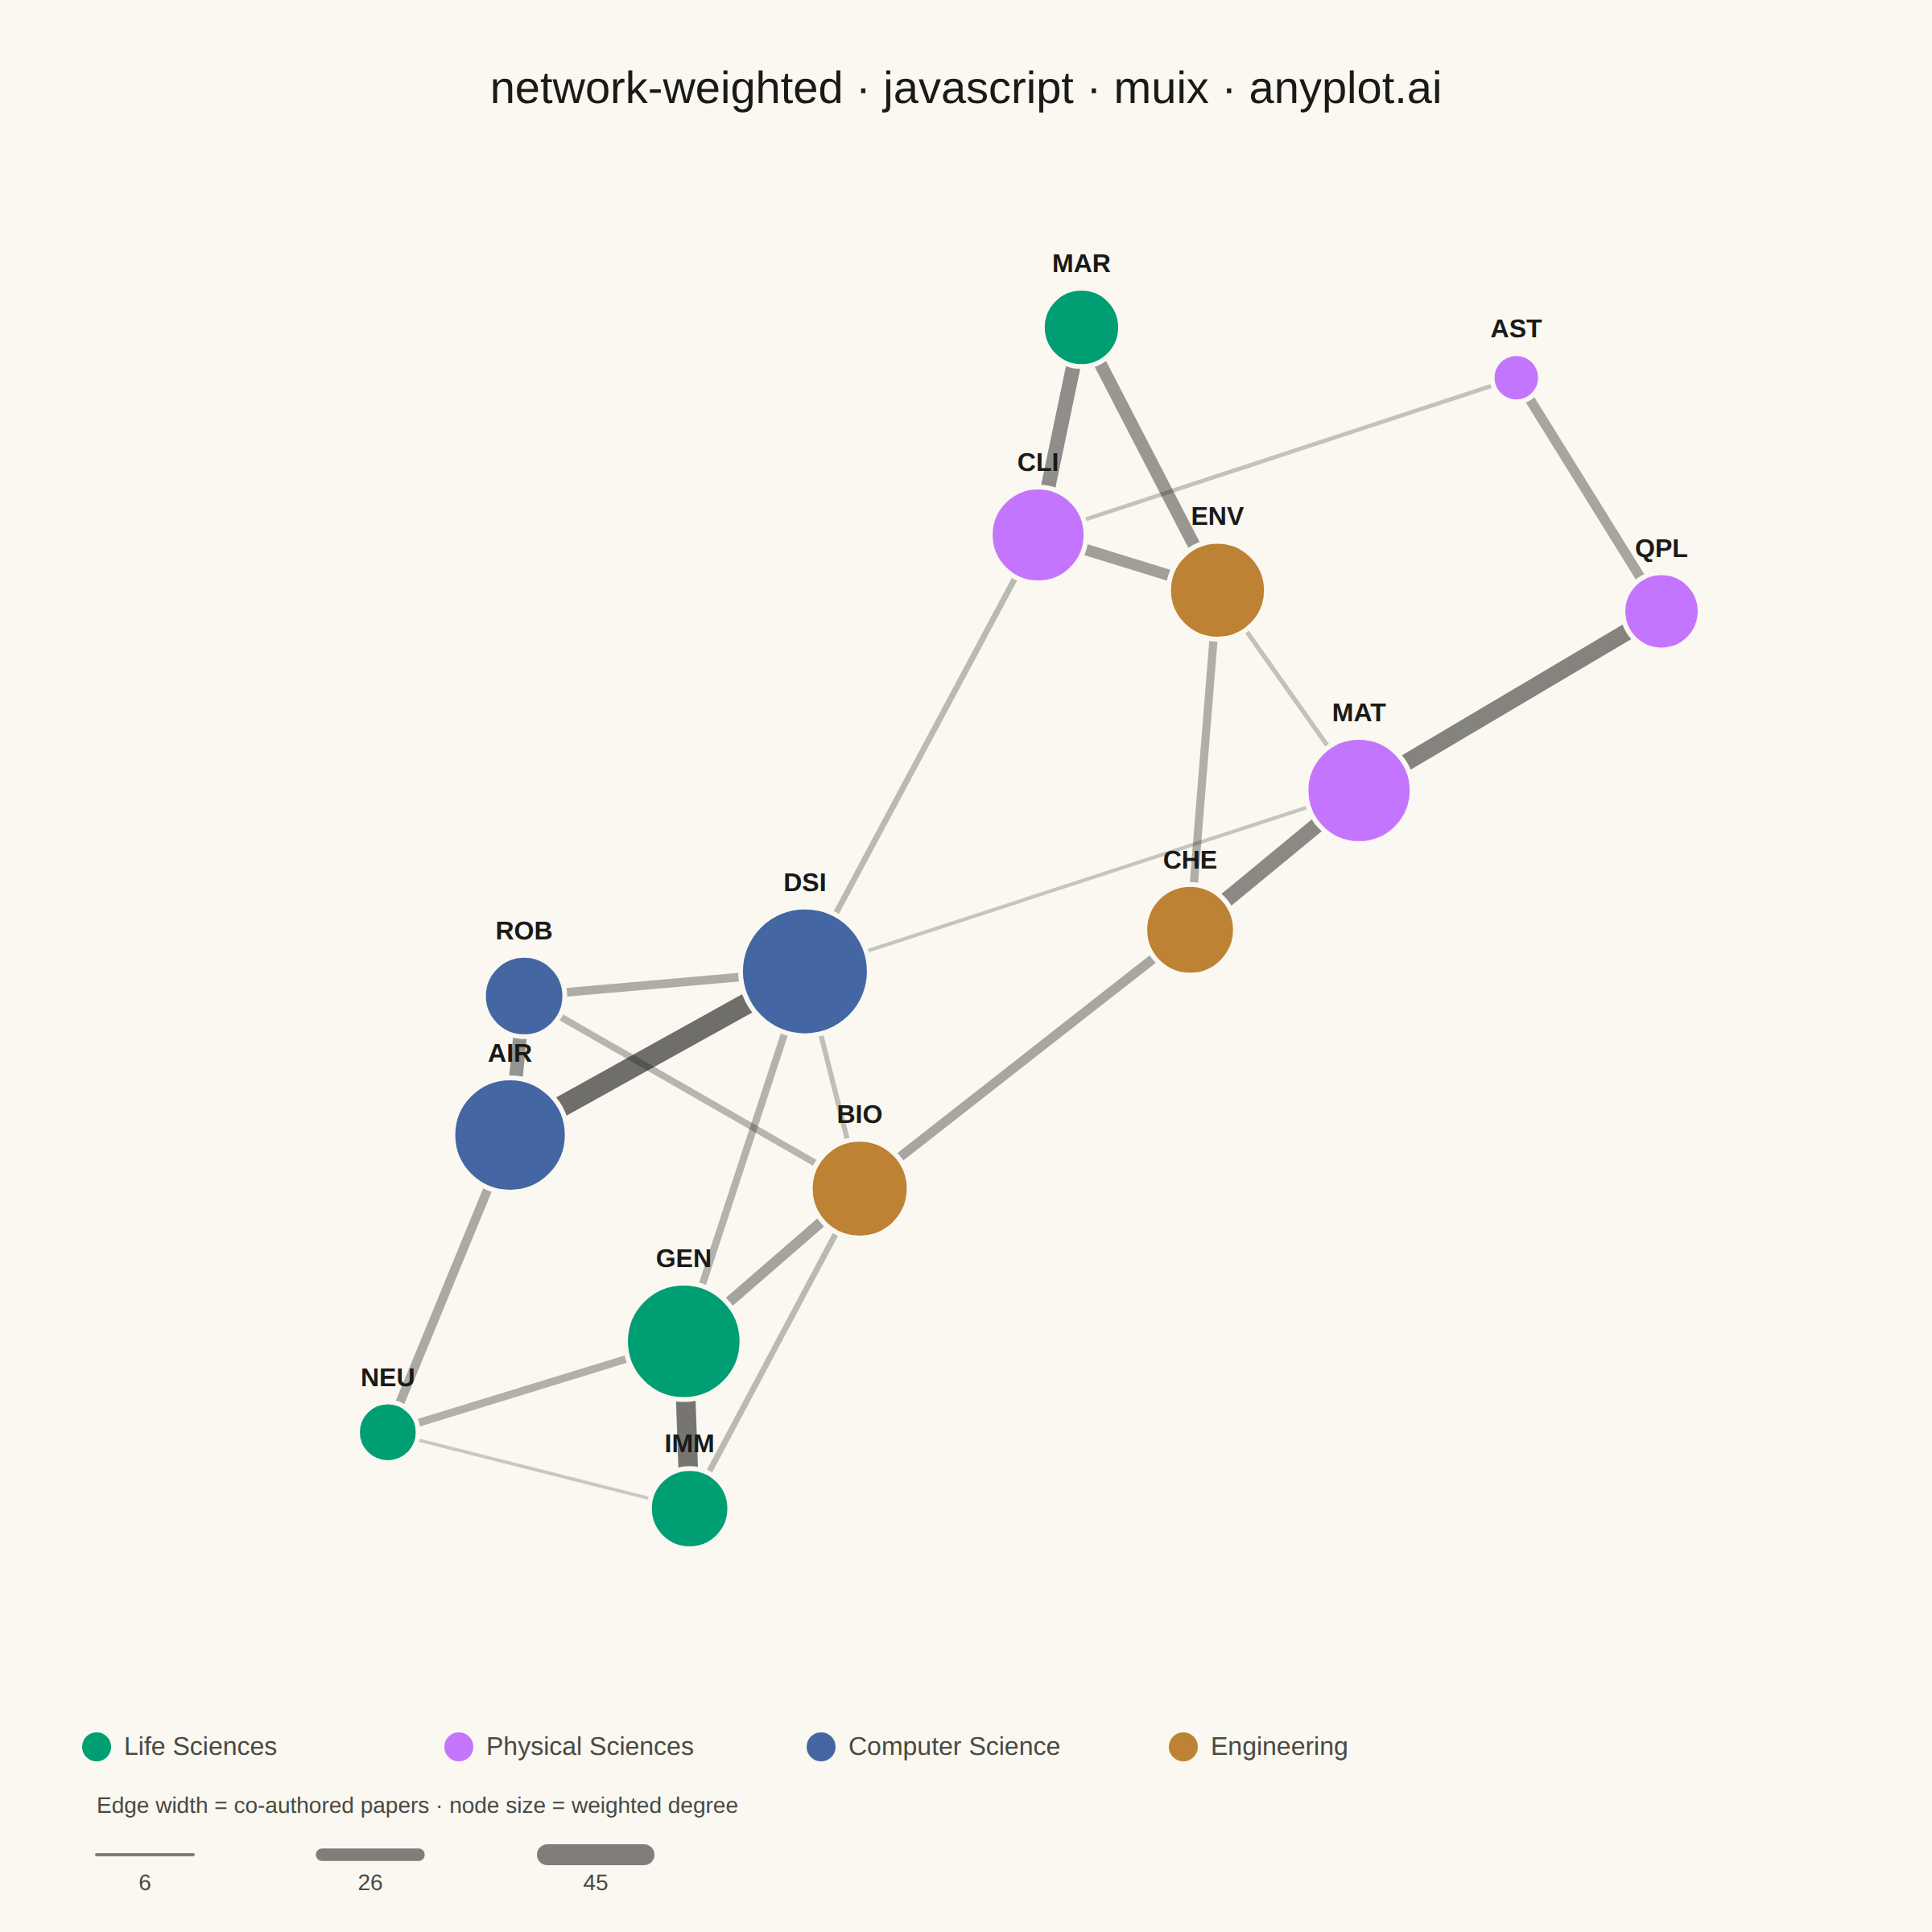
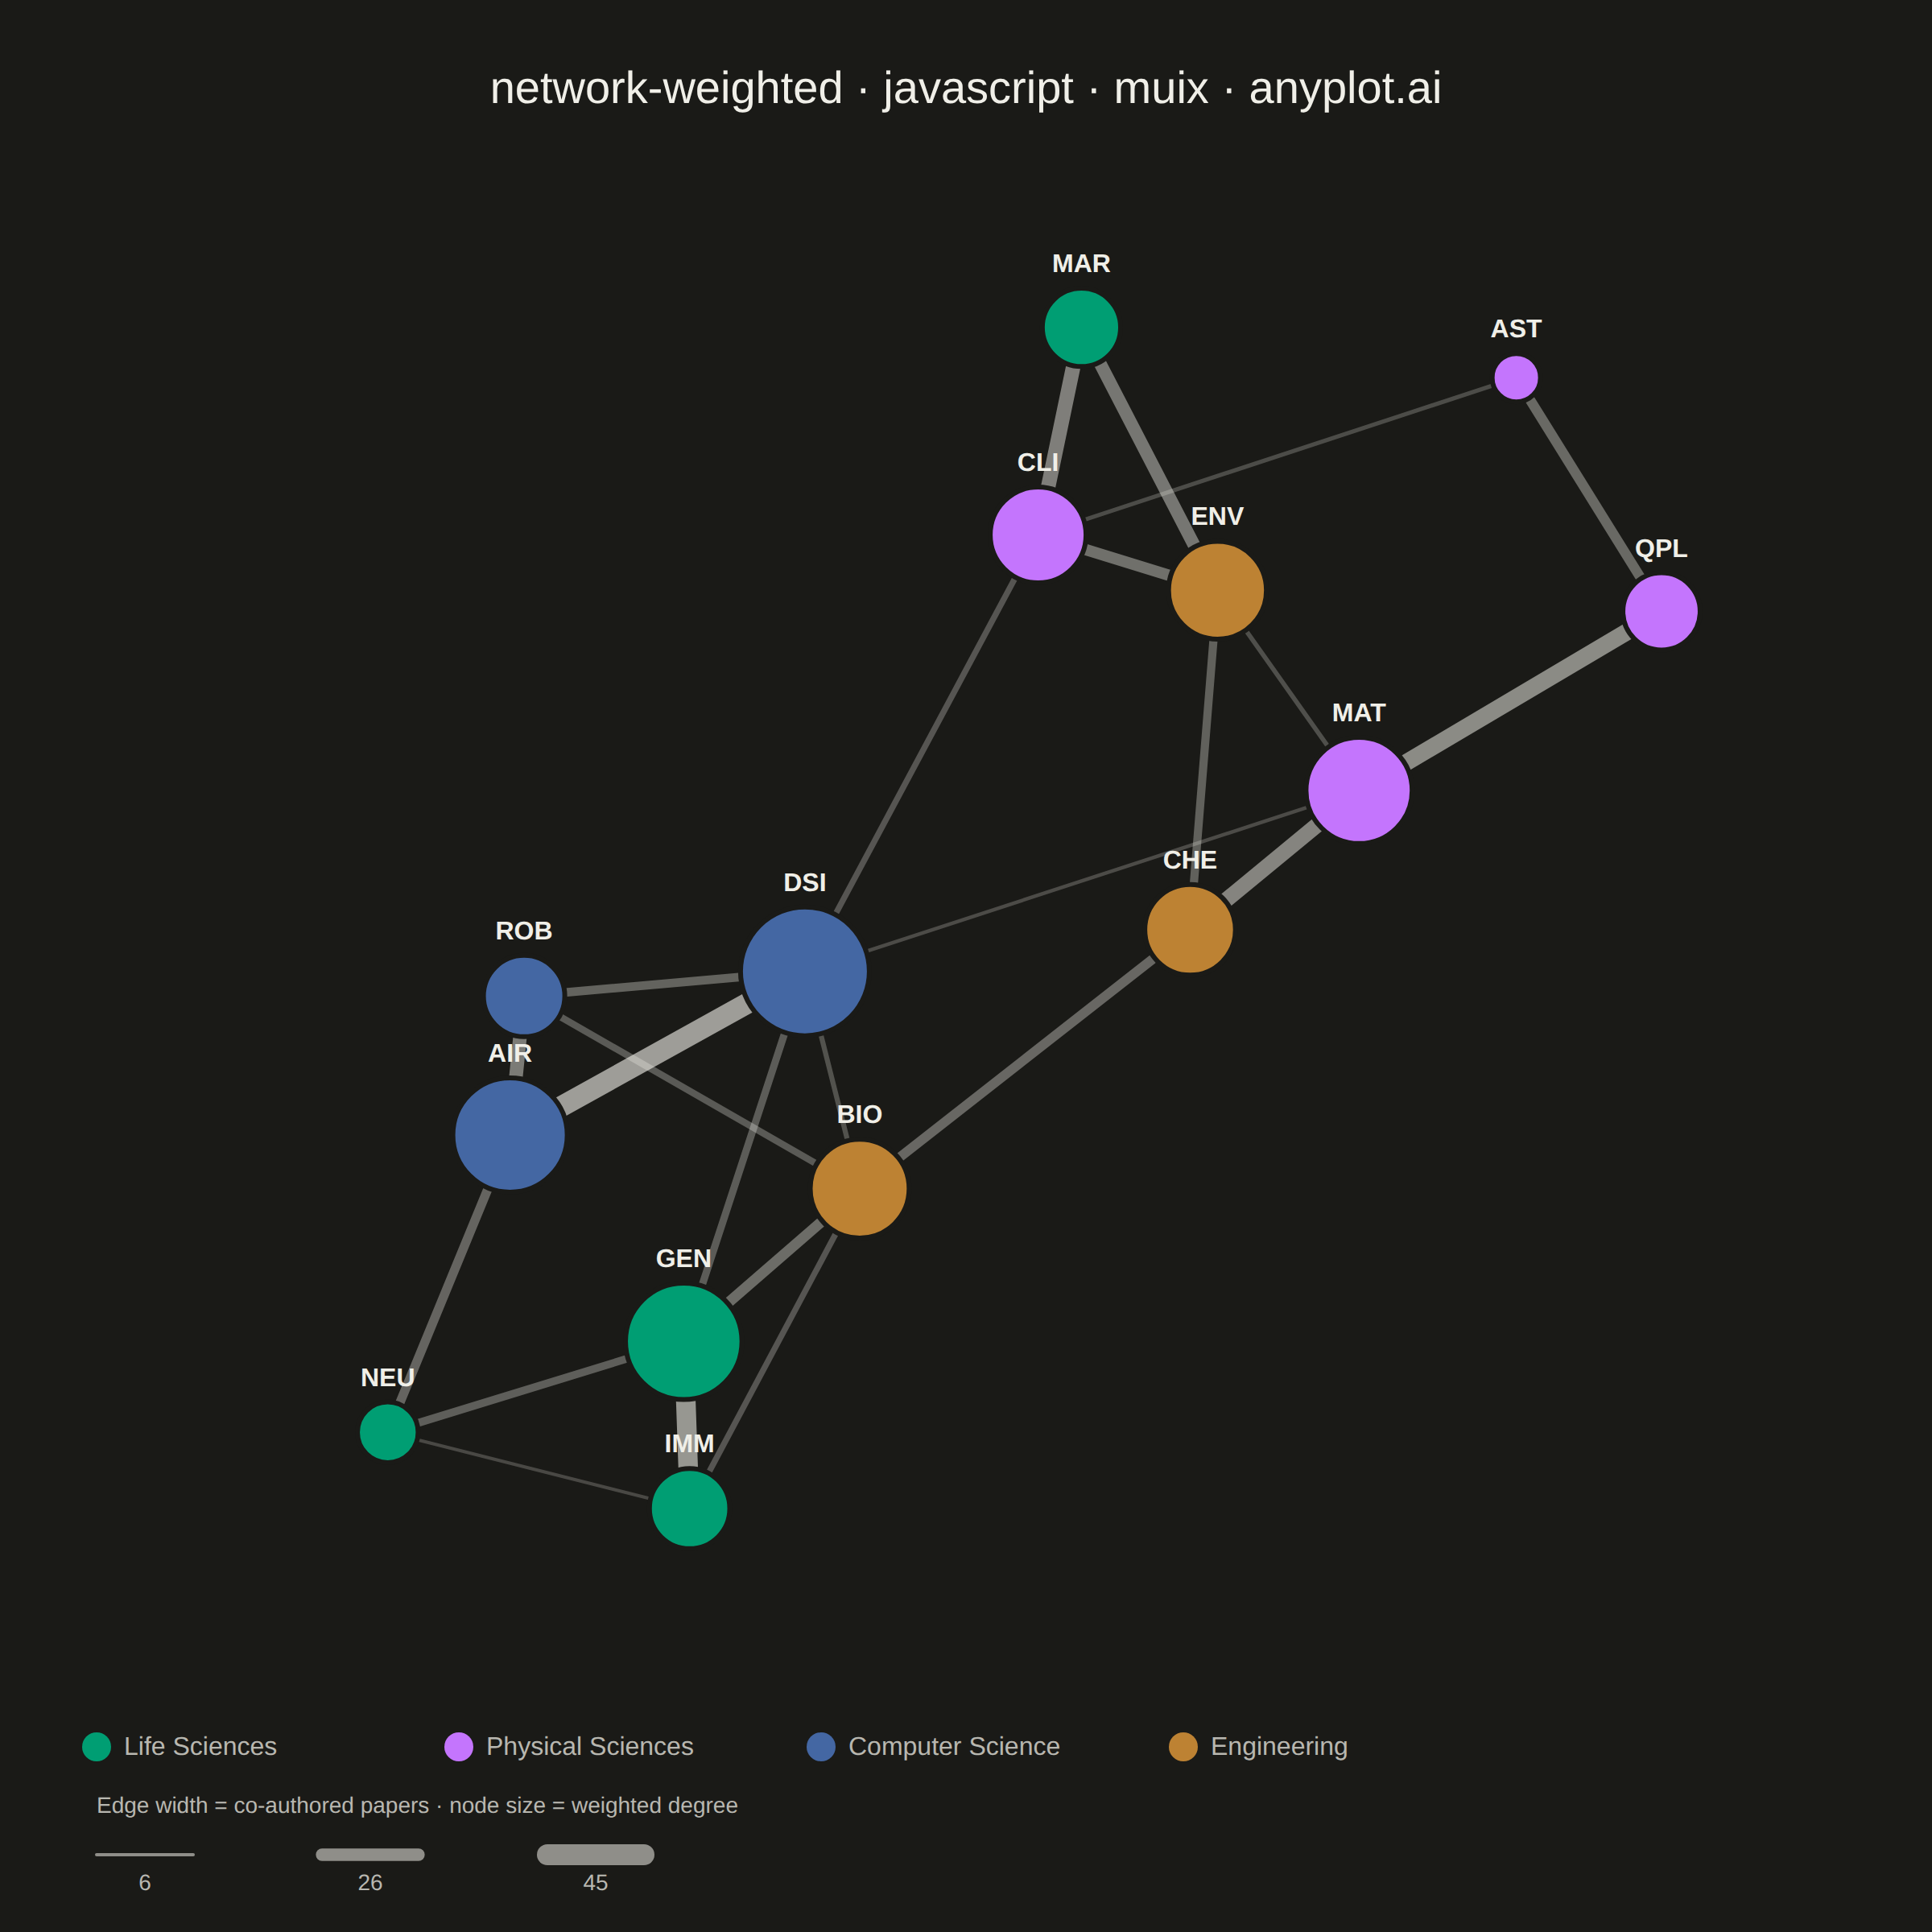
The same plot in 14 other libraries — JavaScript: Chart.js, D3.js, Apache ECharts, Highcharts; Python: Altair, Bokeh, lets-plot, Matplotlib, Plotly, plotnine, Pygal, Seaborn; R: ggplot2; Julia: Makie.jl. Compare all 15 side by side: Weighted Network Graph with Edge Thickness in Python, R, Julia and JavaScript.
A weighted network graph displays relationships between entities using edge thickness to represent connection strength or weight. Unlike basic network graphs where edges are uniform, the varying line widths immediately communicate the relative importance of each relationship. This visualization makes it easy to identify strong vs weak connections, central hubs with many heavy links, and structural patterns in weighted relational data.
// anyplot.ai
// network-weighted: Weighted Network Graph with Edge Thickness
// Library: muix 7.29.1 | JavaScript 22.23.2
// Quality: 90/100 | Created: 2026-09-02
//# anyplot-orientation: square
// anyplot.ai
// network-weighted: Weighted Network Graph with Edge Thickness
// Library: MUI X Charts | React | Node 22
// License: @mui/x-charts — MIT (community). Pro/Premium are out of scope.
// Quality: pending | Created: 2026-09-02
import { useState } from "react";
import { ChartContainer } from "@mui/x-charts/ChartContainer";
import { useXScale, useYScale, useDrawingArea } from "@mui/x-charts/hooks";

const t = window.ANYPLOT_TOKENS;
const TITLE = "network-weighted · javascript · muix · anyplot.ai";

// --- Data: research-lab co-authorship network (in-memory, deterministic) ----
// Four research domains, colored by the Imprint categorical palette in
// canonical order (abstract groups, no semantic-color exception applies).
const DOMAINS = ["Life Sciences", "Physical Sciences", "Computer Science", "Engineering"];

const nodes = [
  { id: "GEN", label: "Genomics Lab", domain: 0 },
  { id: "IMM", label: "Immunology Institute", domain: 0 },
  { id: "NEU", label: "Neuroscience Institute", domain: 0 },
  { id: "MAR", label: "Marine Biology Station", domain: 0 },
  { id: "QPL", label: "Quantum Physics Lab", domain: 1 },
  { id: "MAT", label: "Materials Science Institute", domain: 1 },
  { id: "AST", label: "Astrophysics Observatory", domain: 1 },
  { id: "CLI", label: "Climate Science Center", domain: 1 },
  { id: "AIR", label: "AI Research Center", domain: 2 },
  { id: "DSI", label: "Data Science Institute", domain: 2 },
  { id: "ROB", label: "Robotics Lab", domain: 2 },
  { id: "CHE", label: "Chemical Engineering Lab", domain: 3 },
  { id: "BIO", label: "Bioengineering Institute", domain: 3 },
  { id: "ENV", label: "Environmental Engineering Lab", domain: 3 },
];

// Weight = co-authored papers, 2020-2024, between the two labs.
const edges = [
  { source: "GEN", target: "IMM", weight: 42 },
  { source: "GEN", target: "NEU", weight: 16 },
  { source: "GEN", target: "BIO", weight: 22 },
  { source: "IMM", target: "BIO", weight: 12 },
  { source: "IMM", target: "NEU", weight: 6 },
  { source: "NEU", target: "AIR", weight: 19 },
  { source: "MAR", target: "ENV", weight: 27 },
  { source: "MAR", target: "CLI", weight: 31 },
  { source: "QPL", target: "MAT", weight: 36 },
  { source: "QPL", target: "AST", weight: 21 },
  { source: "MAT", target: "CHE", weight: 33 },
  { source: "MAT", target: "ENV", weight: 9 },
  { source: "AST", target: "CLI", weight: 8 },
  { source: "CLI", target: "ENV", weight: 24 },
  { source: "AIR", target: "DSI", weight: 45 },
  { source: "AIR", target: "ROB", weight: 29 },
  { source: "DSI", target: "ROB", weight: 18 },
  { source: "DSI", target: "GEN", weight: 15 },
  { source: "DSI", target: "CLI", weight: 12 },
  { source: "DSI", target: "MAT", weight: 7 },
  { source: "DSI", target: "BIO", weight: 10 },
  { source: "ROB", target: "BIO", weight: 14 },
  { source: "CHE", target: "BIO", weight: 20 },
  { source: "CHE", target: "ENV", weight: 17 },
];

const nodeIndex = {};
nodes.forEach((n, i) => {
  nodeIndex[n.id] = i;
});

const edgeWeights = edges.map((e) => e.weight);
const MIN_WEIGHT = Math.min(...edgeWeights);
const MAX_WEIGHT = Math.max(...edgeWeights);

// Weighted degree = sum of incident edge weights, drives node radius.
const weightedDegree = nodes.map(() => 0);
edges.forEach((e) => {
  weightedDegree[nodeIndex[e.source]] += e.weight;
  weightedDegree[nodeIndex[e.target]] += e.weight;
});
const MIN_DEGREE = Math.min(...weightedDegree);
const MAX_DEGREE = Math.max(...weightedDegree);

// --- Force-directed layout (Fruchterman-Reingold, weighted attraction) ------
// A tiny fixed-seed LCG stands in for a seeded RNG (the browser has none);
// only the initial scatter is randomized, the physics is fully deterministic.
let lcgState = 42;
function rand() {
  lcgState = (lcgState * 1664525 + 1013904223) % 4294967296;
  return lcgState / 4294967296;
}

const N = nodes.length;
const AREA = 4.5;
const K = Math.sqrt(AREA / N);
const ITERATIONS = 500;

const positions = nodes.map(() => ({ x: rand() * 2 - 1, y: rand() * 2 - 1 }));
let temperature = 0.12;

for (let iter = 0; iter < ITERATIONS; iter++) {
  const disp = positions.map(() => ({ x: 0, y: 0 }));

  // Repulsion between every node pair keeps the layout from collapsing.
  for (let i = 0; i < N; i++) {
    for (let j = i + 1; j < N; j++) {
      const dx = positions[i].x - positions[j].x;
      const dy = positions[i].y - positions[j].y;
      const dist = Math.sqrt(dx * dx + dy * dy) || 0.01;
      const force = (K * K) / dist;
      const ux = dx / dist;
      const uy = dy / dist;
      disp[i].x += ux * force;
      disp[i].y += uy * force;
      disp[j].x -= ux * force;
      disp[j].y -= uy * force;
    }
  }

  // Attraction along edges — heavier weight pulls the pair closer together,
  // so the layout itself, not just line width, communicates connection strength.
  edges.forEach((e) => {
    const i = nodeIndex[e.source];
    const j = nodeIndex[e.target];
    const dx = positions[i].x - positions[j].x;
    const dy = positions[i].y - positions[j].y;
    const dist = Math.sqrt(dx * dx + dy * dy) || 0.01;
    const wRatio = (e.weight - MIN_WEIGHT) / (MAX_WEIGHT - MIN_WEIGHT || 1);
    const idealDist = K * (1.5 - 1.0 * wRatio);
    const force = (dist * dist) / idealDist;
    const ux = dx / dist;
    const uy = dy / dist;
    disp[i].x -= ux * force;
    disp[i].y -= uy * force;
    disp[j].x += ux * force;
    disp[j].y += uy * force;
  });

  for (let i = 0; i < N; i++) {
    const dx = disp[i].x;
    const dy = disp[i].y;
    const dist = Math.sqrt(dx * dx + dy * dy) || 0.01;
    const limited = Math.min(dist, temperature);
    positions[i].x += (dx / dist) * limited;
    positions[i].y += (dy / dist) * limited;
  }
  temperature *= 0.99;
}

// Center the layout, then fit its actual (generally non-circular) bounding
// box to the drawing area independently per axis — a chain-shaped network
// like this one would otherwise sit inside a huge, mostly-empty circle.
const centroidX = positions.reduce((s, p) => s + p.x, 0) / N;
const centroidY = positions.reduce((s, p) => s + p.y, 0) / N;
positions.forEach((p) => {
  p.x -= centroidX;
  p.y -= centroidY;
});

const MARGIN = { top: 100, right: 60, bottom: 170, left: 60 };
const { width: CANVAS_W, height: CANVAS_H } = window.ANYPLOT_SIZE;
const PAD = 1.25; // headroom for node radius + label above the outermost nodes
const rangeX = Math.max(...positions.map((p) => Math.abs(p.x))) || 1;
const rangeY = Math.max(...positions.map((p) => Math.abs(p.y))) || 1;
const X_HALF = rangeX * PAD;
const Y_HALF = rangeY * PAD;

const NODE_MIN_R = 15;
const NODE_MAX_R = 40;
const EDGE_MIN_W = 2;
const EDGE_MAX_W = 13;

function nodeRadius(i) {
  const ratio = (weightedDegree[i] - MIN_DEGREE) / (MAX_DEGREE - MIN_DEGREE || 1);
  return NODE_MIN_R + ratio * (NODE_MAX_R - NODE_MIN_R);
}

function edgeWidth(weight) {
  const ratio = (weight - MIN_WEIGHT) / (MAX_WEIGHT - MIN_WEIGHT || 1);
  return EDGE_MIN_W + ratio * (EDGE_MAX_W - EDGE_MIN_W);
}

// Draw heaviest edges last so the strongest collaborations stay legible on top.
const sortedEdges = [...edges].sort((a, b) => a.weight - b.weight);

// --- Overlay: title drawn in the reserved top margin -------------------------
function GraphTitle() {
  return (
    <text x={CANVAS_W / 2} y={44} textAnchor="middle" dominantBaseline="hanging" fontSize={28} fontWeight={500} fill={t.ink}>
      {TITLE}
    </text>
  );
}

// --- Overlay: edges + nodes, both hoverable for the interactive HTML export -
function NetworkOverlay({ onHoverChange }) {
  const xScale = useXScale();
  const yScale = useYScale();

  return (
    <g>
      {sortedEdges.map((edge, i) => {
        const s = positions[nodeIndex[edge.source]];
        const d = positions[nodeIndex[edge.target]];
        const x1 = xScale(s.x);
        const y1 = yScale(s.y);
        const x2 = xScale(d.x);
        const y2 = yScale(d.y);
        const width = edgeWidth(edge.weight);
        const ratio = (edge.weight - MIN_WEIGHT) / (MAX_WEIGHT - MIN_WEIGHT || 1);
        const tooltip = {
          label: `${nodes[nodeIndex[edge.source]].label} ↔ ${nodes[nodeIndex[edge.target]].label}`,
          detail: `${edge.weight} co-authored papers`,
          x: (x1 + x2) / 2,
          y: (y1 + y2) / 2,
        };
        return (
          <g key={`${edge.source}-${edge.target}-${i}`}>
            <line x1={x1} y1={y1} x2={x2} y2={y2} stroke={t.ink} strokeOpacity={0.22 + ratio * 0.4} strokeWidth={width} strokeLinecap="round" />
            {/* Wider transparent hit path: the visible stroke is often too thin to hover reliably. */}
            <line
              x1={x1}
              y1={y1}
              x2={x2}
              y2={y2}
              stroke="transparent"
              strokeWidth={Math.max(width, 18)}
              style={{ cursor: "pointer" }}
              onMouseEnter={() => onHoverChange(tooltip)}
              onMouseLeave={() => onHoverChange(null)}
            />
          </g>
        );
      })}
      {nodes.map((node, i) => {
        const p = positions[i];
        const cx = xScale(p.x);
        const cy = yScale(p.y);
        const radius = nodeRadius(i);
        const tooltip = {
          label: node.label,
          detail: `${DOMAINS[node.domain]} · weighted degree ${weightedDegree[i]}`,
          x: cx,
          y: cy - radius - 10,
        };
        return (
          <g key={node.id}>
            <circle
              cx={cx}
              cy={cy}
              r={radius}
              fill={t.palette[node.domain]}
              stroke={t.pageBg}
              strokeWidth={3}
              style={{ cursor: "pointer" }}
              onMouseEnter={() => onHoverChange(tooltip)}
              onMouseLeave={() => onHoverChange(null)}
            />
            <text x={cx} y={cy - radius - 10} textAnchor="middle" fontSize={16} fontWeight={600} fill={t.ink} style={{ pointerEvents: "none" }}>
              {node.id}
            </text>
          </g>
        );
      })}
    </g>
  );
}

// --- Overlay: hover tooltip for edges and nodes ------------------------------
function HoverTooltip({ hover }) {
  if (!hover) return null;
  const charWidth = 7.4;
  const width = Math.max(hover.label.length, hover.detail.length) * charWidth + 24;
  const height = 46;
  const x = Math.min(Math.max(hover.x - width / 2, 8), CANVAS_W - width - 8);
  const y = Math.max(hover.y - height - 12, 8);
  return (
    <g style={{ pointerEvents: "none" }}>
      <rect x={x} y={y} width={width} height={height} rx={6} fill={t.elevatedBg} stroke={t.inkSoft} strokeOpacity={0.4} />
      <text x={x + width / 2} y={y + 19} textAnchor="middle" fontSize={13} fontWeight={600} fill={t.ink}>
        {hover.label}
      </text>
      <text x={x + width / 2} y={y + 36} textAnchor="middle" fontSize={12} fill={t.inkSoft}>
        {hover.detail}
      </text>
    </g>
  );
}

// --- Overlay: domain-color legend + edge-weight scale, in the bottom margin -
function Legend() {
  const drawingArea = useDrawingArea();
  const rowY = drawingArea.top + drawingArea.height + 55;
  const swatchR = 9;
  const groupGap = 225;

  const weightSamples = [MIN_WEIGHT, Math.round((MIN_WEIGHT + MAX_WEIGHT) / 2), MAX_WEIGHT];
  const weightRowY = rowY + 55;
  const weightStartX = drawingArea.left;

  return (
    <g>
      {DOMAINS.map((name, i) => {
        const x = drawingArea.left + i * groupGap;
        return (
          <g key={name}>
            <circle cx={x} cy={rowY} r={swatchR} fill={t.palette[i]} />
            <text x={x + swatchR + 8} y={rowY + 5} fontSize={16} fill={t.inkSoft}>
              {name}
            </text>
          </g>
        );
      })}
      <text x={weightStartX} y={weightRowY - 14} fontSize={14} fill={t.inkSoft}>
        Edge width = co-authored papers · node size = weighted degree
      </text>
      {weightSamples.map((w, i) => {
        const x = weightStartX + i * 140;
        const lineY = weightRowY + 12;
        return (
          <g key={w}>
            <line x1={x} y1={lineY} x2={x + 60} y2={lineY} stroke={t.ink} strokeOpacity={0.55} strokeWidth={edgeWidth(w)} strokeLinecap="round" />
            <text x={x + 30} y={lineY + 22} textAnchor="middle" fontSize={14} fill={t.inkSoft}>
              {w}
            </text>
          </g>
        );
      })}
    </g>
  );
}

// --- Chart (default-exported component — the harness mounts it) -------------
export default function Chart() {
  const [hover, setHover] = useState(null);
  return (
    <ChartContainer
      width={CANVAS_W}
      height={CANVAS_H}
      margin={MARGIN}
      series={[]}
      skipAnimation
      disableAxisListener
      xAxis={[{ scaleType: "linear", min: -X_HALF, max: X_HALF }]}
      yAxis={[{ scaleType: "linear", min: -Y_HALF, max: Y_HALF }]}
    >
      <NetworkOverlay onHoverChange={setHover} />
      <GraphTitle />
      <Legend />
      <HoverTooltip hover={hover} />
    </ChartContainer>
  );
}
Runnable source as JSON, for any HTTP client: https://api.anyplot.ai/specs/network-weighted/muix/code. Any spec id and library id listed in llms-full.txt fit the same URL shape; every URL below is complete and callable.
{
  "spec_id": "network-weighted",
  "language": "javascript",
  "library": "muix",
  "page": "https://anyplot.ai/network-weighted/javascript/muix",
  "hub": "https://anyplot.ai/network-weighted",
  "code_json": "https://api.anyplot.ai/specs/network-weighted/muix/code",
  "spec_json": "https://api.anyplot.ai/specs/network-weighted",
  "render_light_png": "https://storage.googleapis.com/anyplot-images/plots/network-weighted/javascript/muix/plot-light.png",
  "render_dark_png": "https://storage.googleapis.com/anyplot-images/plots/network-weighted/javascript/muix/plot-dark.png",
  "interactive_light_html": "https://storage.googleapis.com/anyplot-images/plots/network-weighted/javascript/muix/plot-light.html",
  "interactive_dark_html": "https://storage.googleapis.com/anyplot-images/plots/network-weighted/javascript/muix/plot-dark.html",
  "quality_score": 90.0,
  "license": "MIT",
  "guide": "https://anyplot.ai/llms.txt"
}
Part of Weighted Network Graph with Edge Thickness on anyplot.ai.