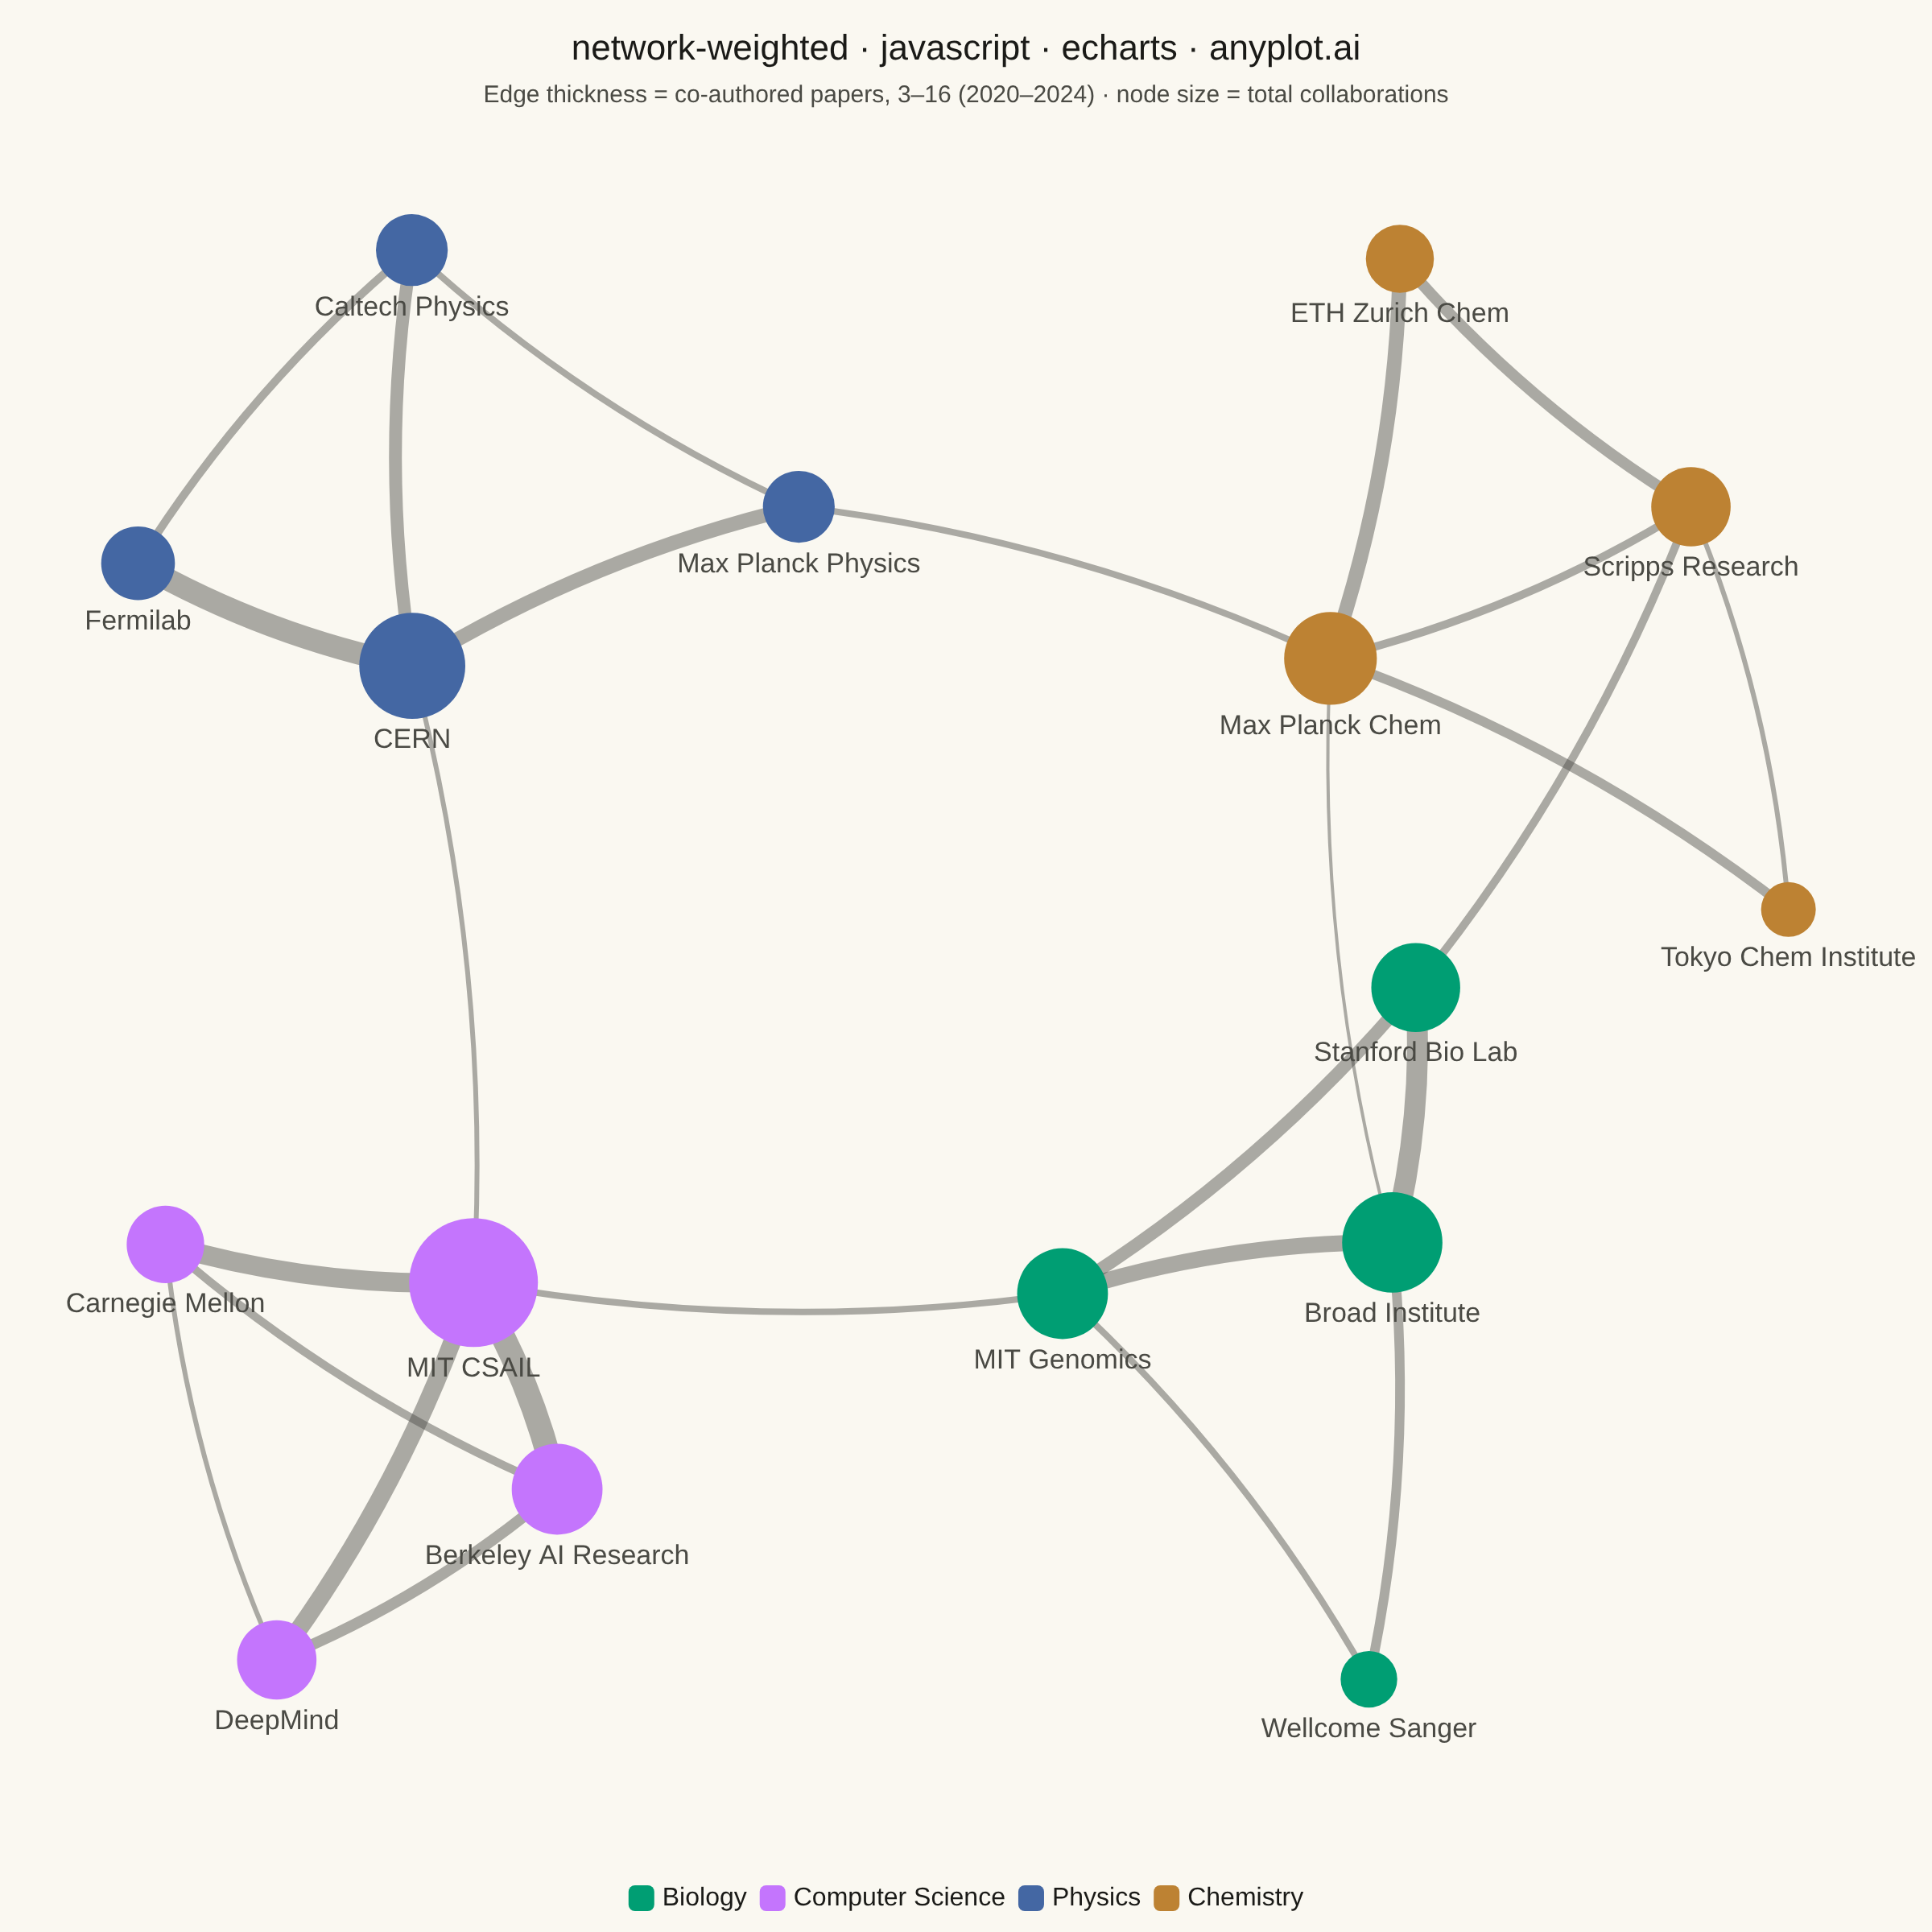
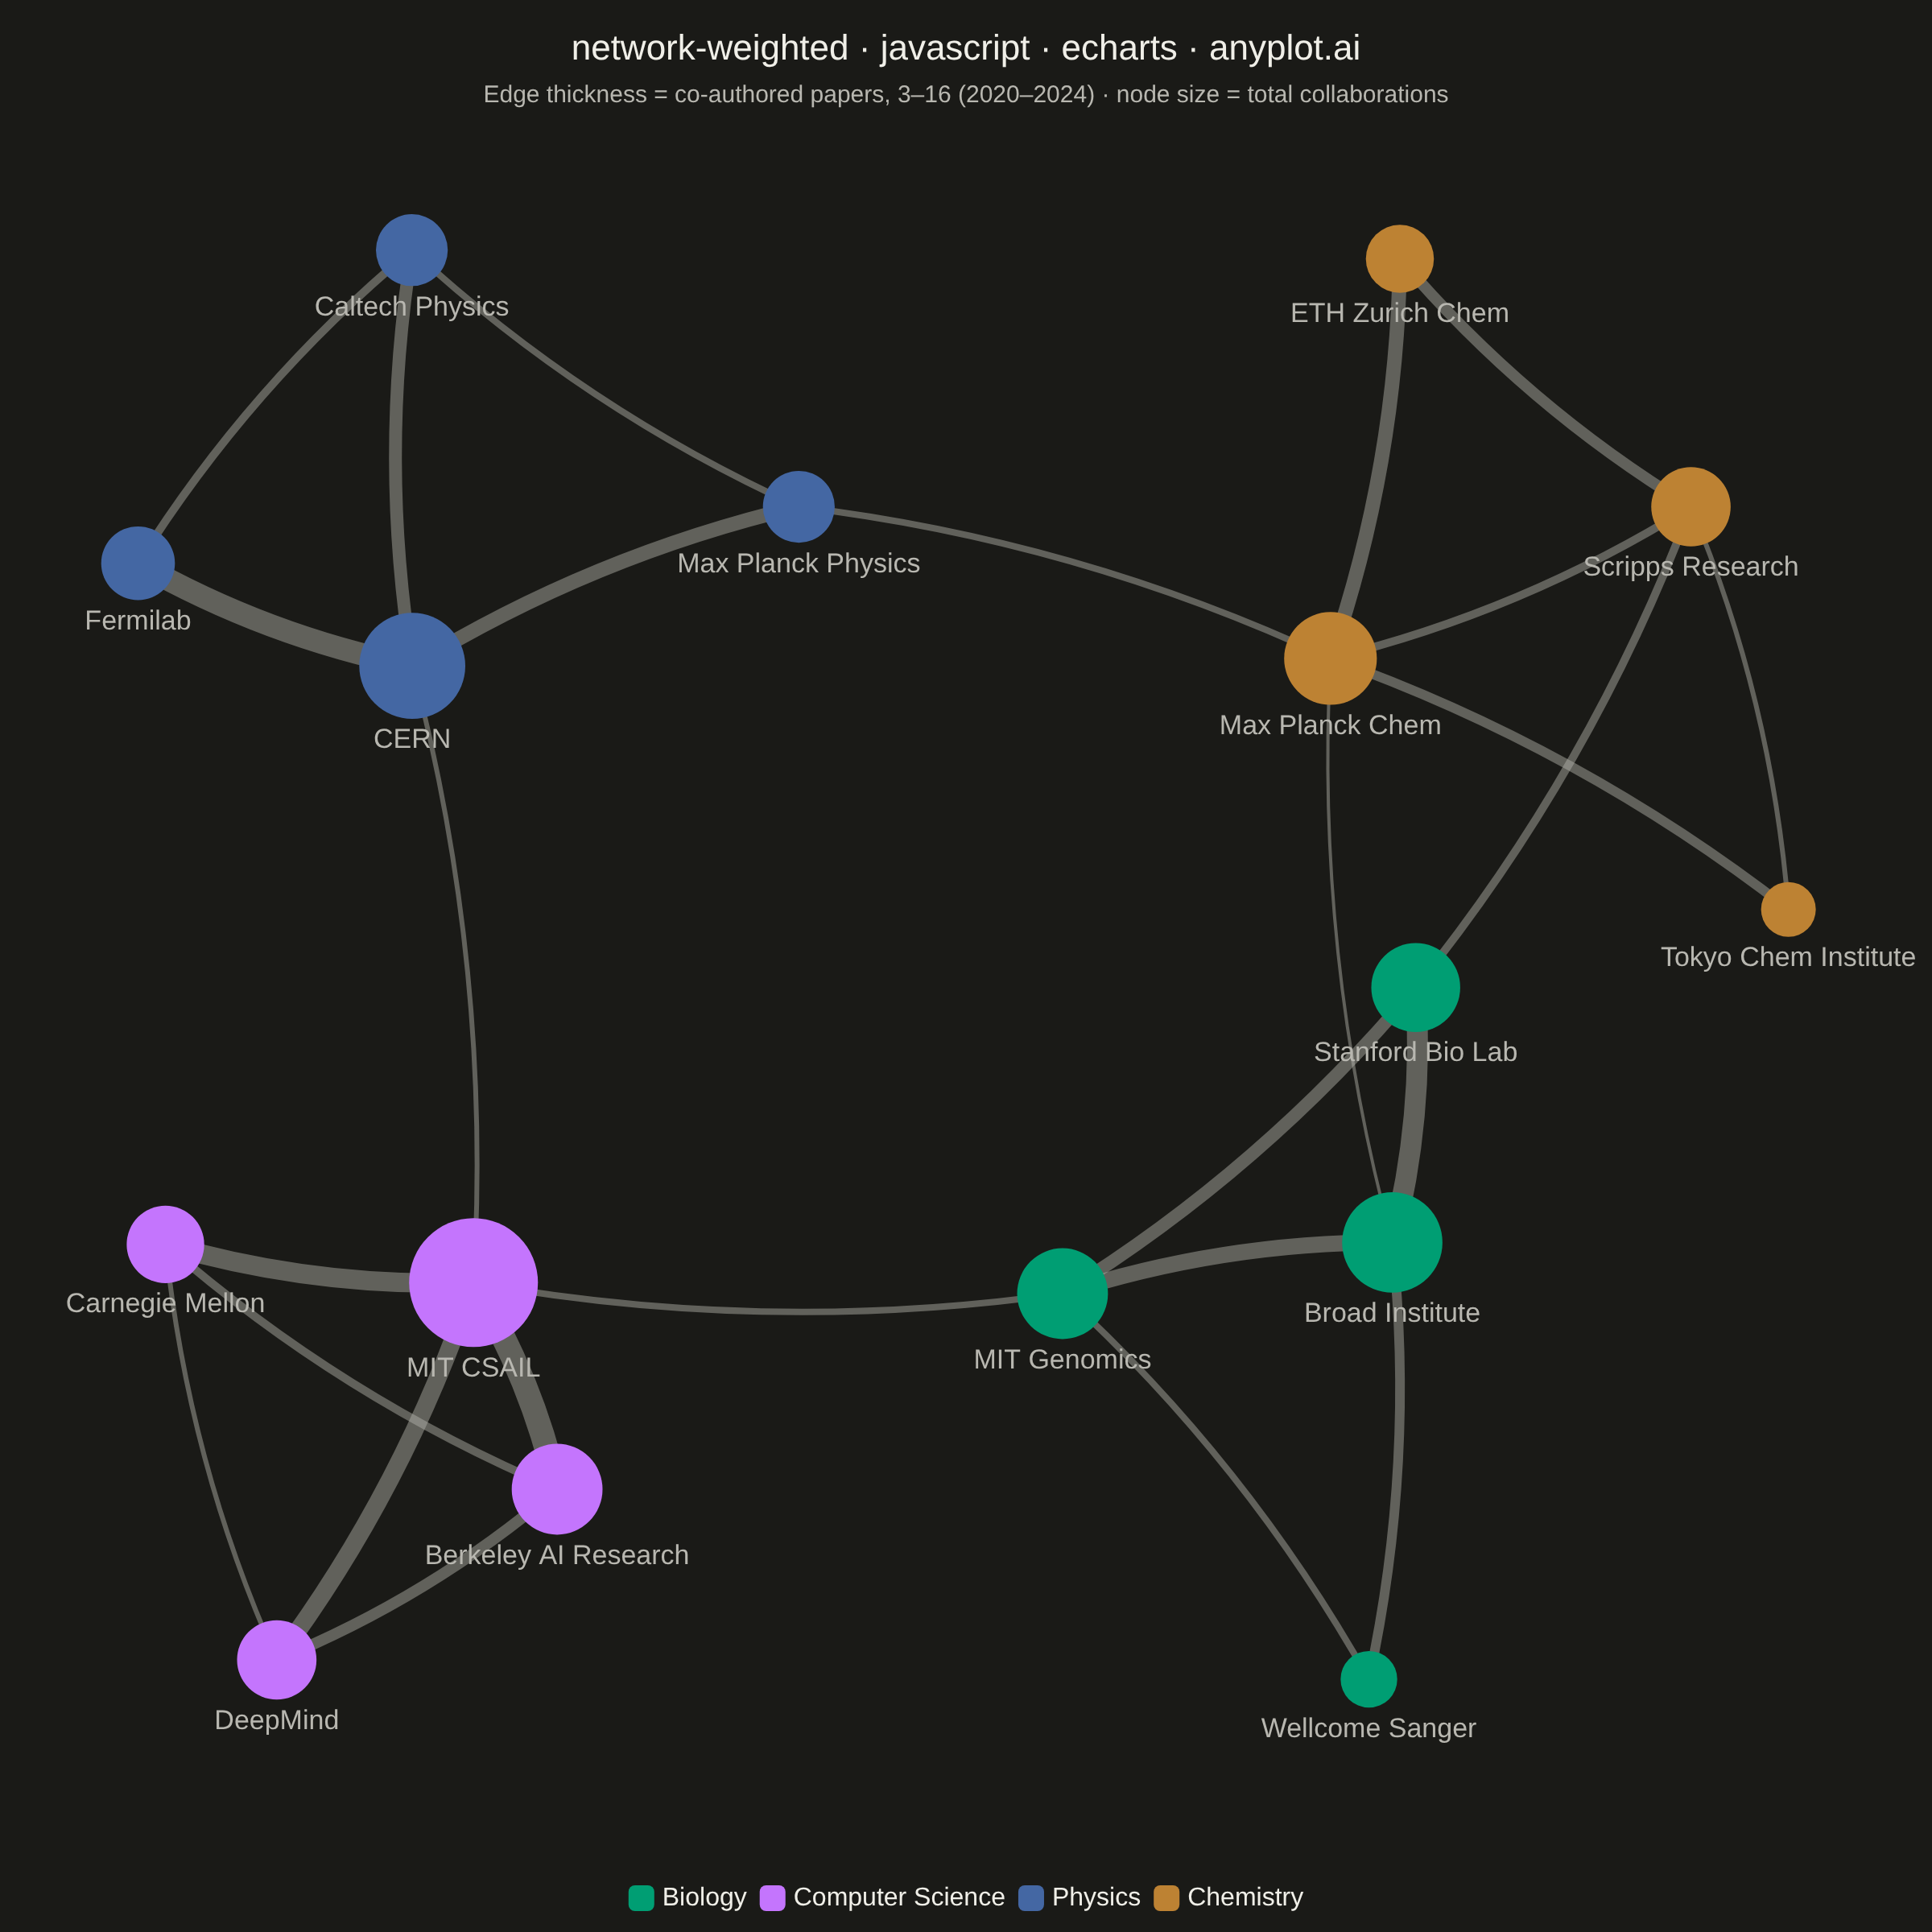
The same plot in 14 other libraries — JavaScript: Chart.js, D3.js, Highcharts, MUI X Charts; Python: Altair, Bokeh, lets-plot, Matplotlib, Plotly, plotnine, Pygal, Seaborn; R: ggplot2; Julia: Makie.jl. Compare all 15 side by side: Weighted Network Graph with Edge Thickness in Python, R, Julia and JavaScript.
A weighted network graph displays relationships between entities using edge thickness to represent connection strength or weight. Unlike basic network graphs where edges are uniform, the varying line widths immediately communicate the relative importance of each relationship. This visualization makes it easy to identify strong vs weak connections, central hubs with many heavy links, and structural patterns in weighted relational data.
// anyplot.ai
// network-weighted: Weighted Network Graph with Edge Thickness
// Library: echarts 6.1.0 | JavaScript 22.23.2
// Quality: 93/100 | Created: 2026-09-02

//# anyplot-orientation: square
const t = window.ANYPLOT_TOKENS;

// --- Data (in-memory, deterministic) ----------------------------------------
// Research collaboration network: institutions grouped by field, edge weight
// = number of co-authored papers (2020-2024).
const categories = [
  { name: "Biology" },
  { name: "Computer Science" },
  { name: "Physics" },
  { name: "Chemistry" },
];

const nodeCategory = {
  "Stanford Bio Lab": 0,
  "MIT Genomics": 0,
  "Broad Institute": 0,
  "Wellcome Sanger": 0,
  "MIT CSAIL": 1,
  "Berkeley AI Research": 1,
  DeepMind: 1,
  "Carnegie Mellon": 1,
  CERN: 2,
  Fermilab: 2,
  "Max Planck Physics": 2,
  "Caltech Physics": 2,
  "Scripps Research": 3,
  "ETH Zurich Chem": 3,
  "Max Planck Chem": 3,
  "Tokyo Chem Institute": 3,
};

const edges = [
  ["Stanford Bio Lab", "MIT Genomics", 9],
  ["Stanford Bio Lab", "Broad Institute", 14],
  ["MIT Genomics", "Broad Institute", 11],
  ["Broad Institute", "Wellcome Sanger", 7],
  ["MIT Genomics", "Wellcome Sanger", 5],
  ["MIT CSAIL", "Berkeley AI Research", 16],
  ["MIT CSAIL", "DeepMind", 12],
  ["MIT CSAIL", "Carnegie Mellon", 13],
  ["Berkeley AI Research", "DeepMind", 8],
  ["Berkeley AI Research", "Carnegie Mellon", 6],
  ["DeepMind", "Carnegie Mellon", 4],
  ["CERN", "Fermilab", 15],
  ["CERN", "Max Planck Physics", 10],
  ["CERN", "Caltech Physics", 9],
  ["Fermilab", "Caltech Physics", 6],
  ["Max Planck Physics", "Caltech Physics", 5],
  ["Scripps Research", "ETH Zurich Chem", 8],
  ["Scripps Research", "Max Planck Chem", 6],
  ["ETH Zurich Chem", "Max Planck Chem", 10],
  ["Max Planck Chem", "Tokyo Chem Institute", 7],
  ["Scripps Research", "Tokyo Chem Institute", 4],
  ["MIT Genomics", "MIT CSAIL", 5],
  ["Broad Institute", "Max Planck Chem", 3],
  ["CERN", "MIT CSAIL", 4],
  ["Scripps Research", "Stanford Bio Lab", 6],
  ["Max Planck Physics", "Max Planck Chem", 5],
];

// Weighted degree (sum of incident edge weights) drives node size.
const weightedDegree = {};
for (const [source, target, weight] of edges) {
  weightedDegree[source] = (weightedDegree[source] || 0) + weight;
  weightedDegree[target] = (weightedDegree[target] || 0) + weight;
}
const degrees = Object.values(weightedDegree);
const minDegree = Math.min(...degrees);
const maxDegree = Math.max(...degrees);
const weights = edges.map((edge) => edge[2]);
const minWeight = Math.min(...weights);
const maxWeight = Math.max(...weights);

const nodeSize = (name) =>
  34 + ((weightedDegree[name] - minDegree) / (maxDegree - minDegree)) * 46;
const edgeWidth = (weight) =>
  2 + ((weight - minWeight) / (maxWeight - minWeight)) * 13;

// --- Init ---------------------------------------------------------------------
const chart = echarts.init(document.getElementById("container"));

// --- Option ---------------------------------------------------------------------
chart.setOption({
  animation: false,
  color: t.palette,
  backgroundColor: "transparent",
  title: {
    text: "network-weighted · javascript · echarts · anyplot.ai",
    subtext: `Edge thickness = co-authored papers, ${minWeight}–${maxWeight} (2020–2024) · node size = total collaborations`,
    left: "center",
    textStyle: { color: t.ink, fontSize: 22, fontWeight: 500 },
    subtextStyle: { color: t.inkSoft, fontSize: 15 },
  },
  legend: {
    data: categories.map((category) => category.name),
    bottom: 8,
    left: "center",
    textStyle: { color: t.ink, fontSize: 16 },
    itemWidth: 16,
    itemHeight: 16,
  },
  series: [
    {
      type: "graph",
      layout: "force",
      top: 150,
      bottom: 170,
      left: 150,
      right: 210,
      roam: false,
      draggable: true,
      categories,
      force: {
        initLayout: "circular",
        repulsion: 1550,
        edgeLength: [100, 300],
        gravity: 0.06,
        friction: 0.6,
        layoutAnimation: false,
      },
      label: {
        show: true,
        position: "bottom",
        color: t.inkSoft,
        fontSize: 17,
      },
      labelLayout: { moveOverlap: "shiftX" },
      lineStyle: {
        color: t.inkSoft,
        opacity: 0.45,
        curveness: 0.08,
      },
      emphasis: {
        focus: "adjacency",
        lineStyle: { opacity: 0.9 },
        label: { fontWeight: "bold" },
      },
      data: Object.keys(nodeCategory).map((name) => ({
        name,
        category: nodeCategory[name],
        symbolSize: nodeSize(name),
      })),
      links: edges.map(([source, target, weight]) => ({
        source,
        target,
        value: weight,
        lineStyle: { width: edgeWidth(weight) },
      })),
    },
  ],
});
Runnable source as JSON, for any HTTP client: https://api.anyplot.ai/specs/network-weighted/echarts/code. Any spec id and library id listed in llms-full.txt fit the same URL shape; every URL below is complete and callable.
{
  "spec_id": "network-weighted",
  "language": "javascript",
  "library": "echarts",
  "page": "https://anyplot.ai/network-weighted/javascript/echarts",
  "hub": "https://anyplot.ai/network-weighted",
  "code_json": "https://api.anyplot.ai/specs/network-weighted/echarts/code",
  "spec_json": "https://api.anyplot.ai/specs/network-weighted",
  "render_light_png": "https://storage.googleapis.com/anyplot-images/plots/network-weighted/javascript/echarts/plot-light.png",
  "render_dark_png": "https://storage.googleapis.com/anyplot-images/plots/network-weighted/javascript/echarts/plot-dark.png",
  "interactive_light_html": "https://storage.googleapis.com/anyplot-images/plots/network-weighted/javascript/echarts/plot-light.html",
  "interactive_dark_html": "https://storage.googleapis.com/anyplot-images/plots/network-weighted/javascript/echarts/plot-dark.html",
  "quality_score": 93.0,
  "license": "MIT",
  "guide": "https://anyplot.ai/llms.txt"
}
Part of Weighted Network Graph with Edge Thickness on anyplot.ai.