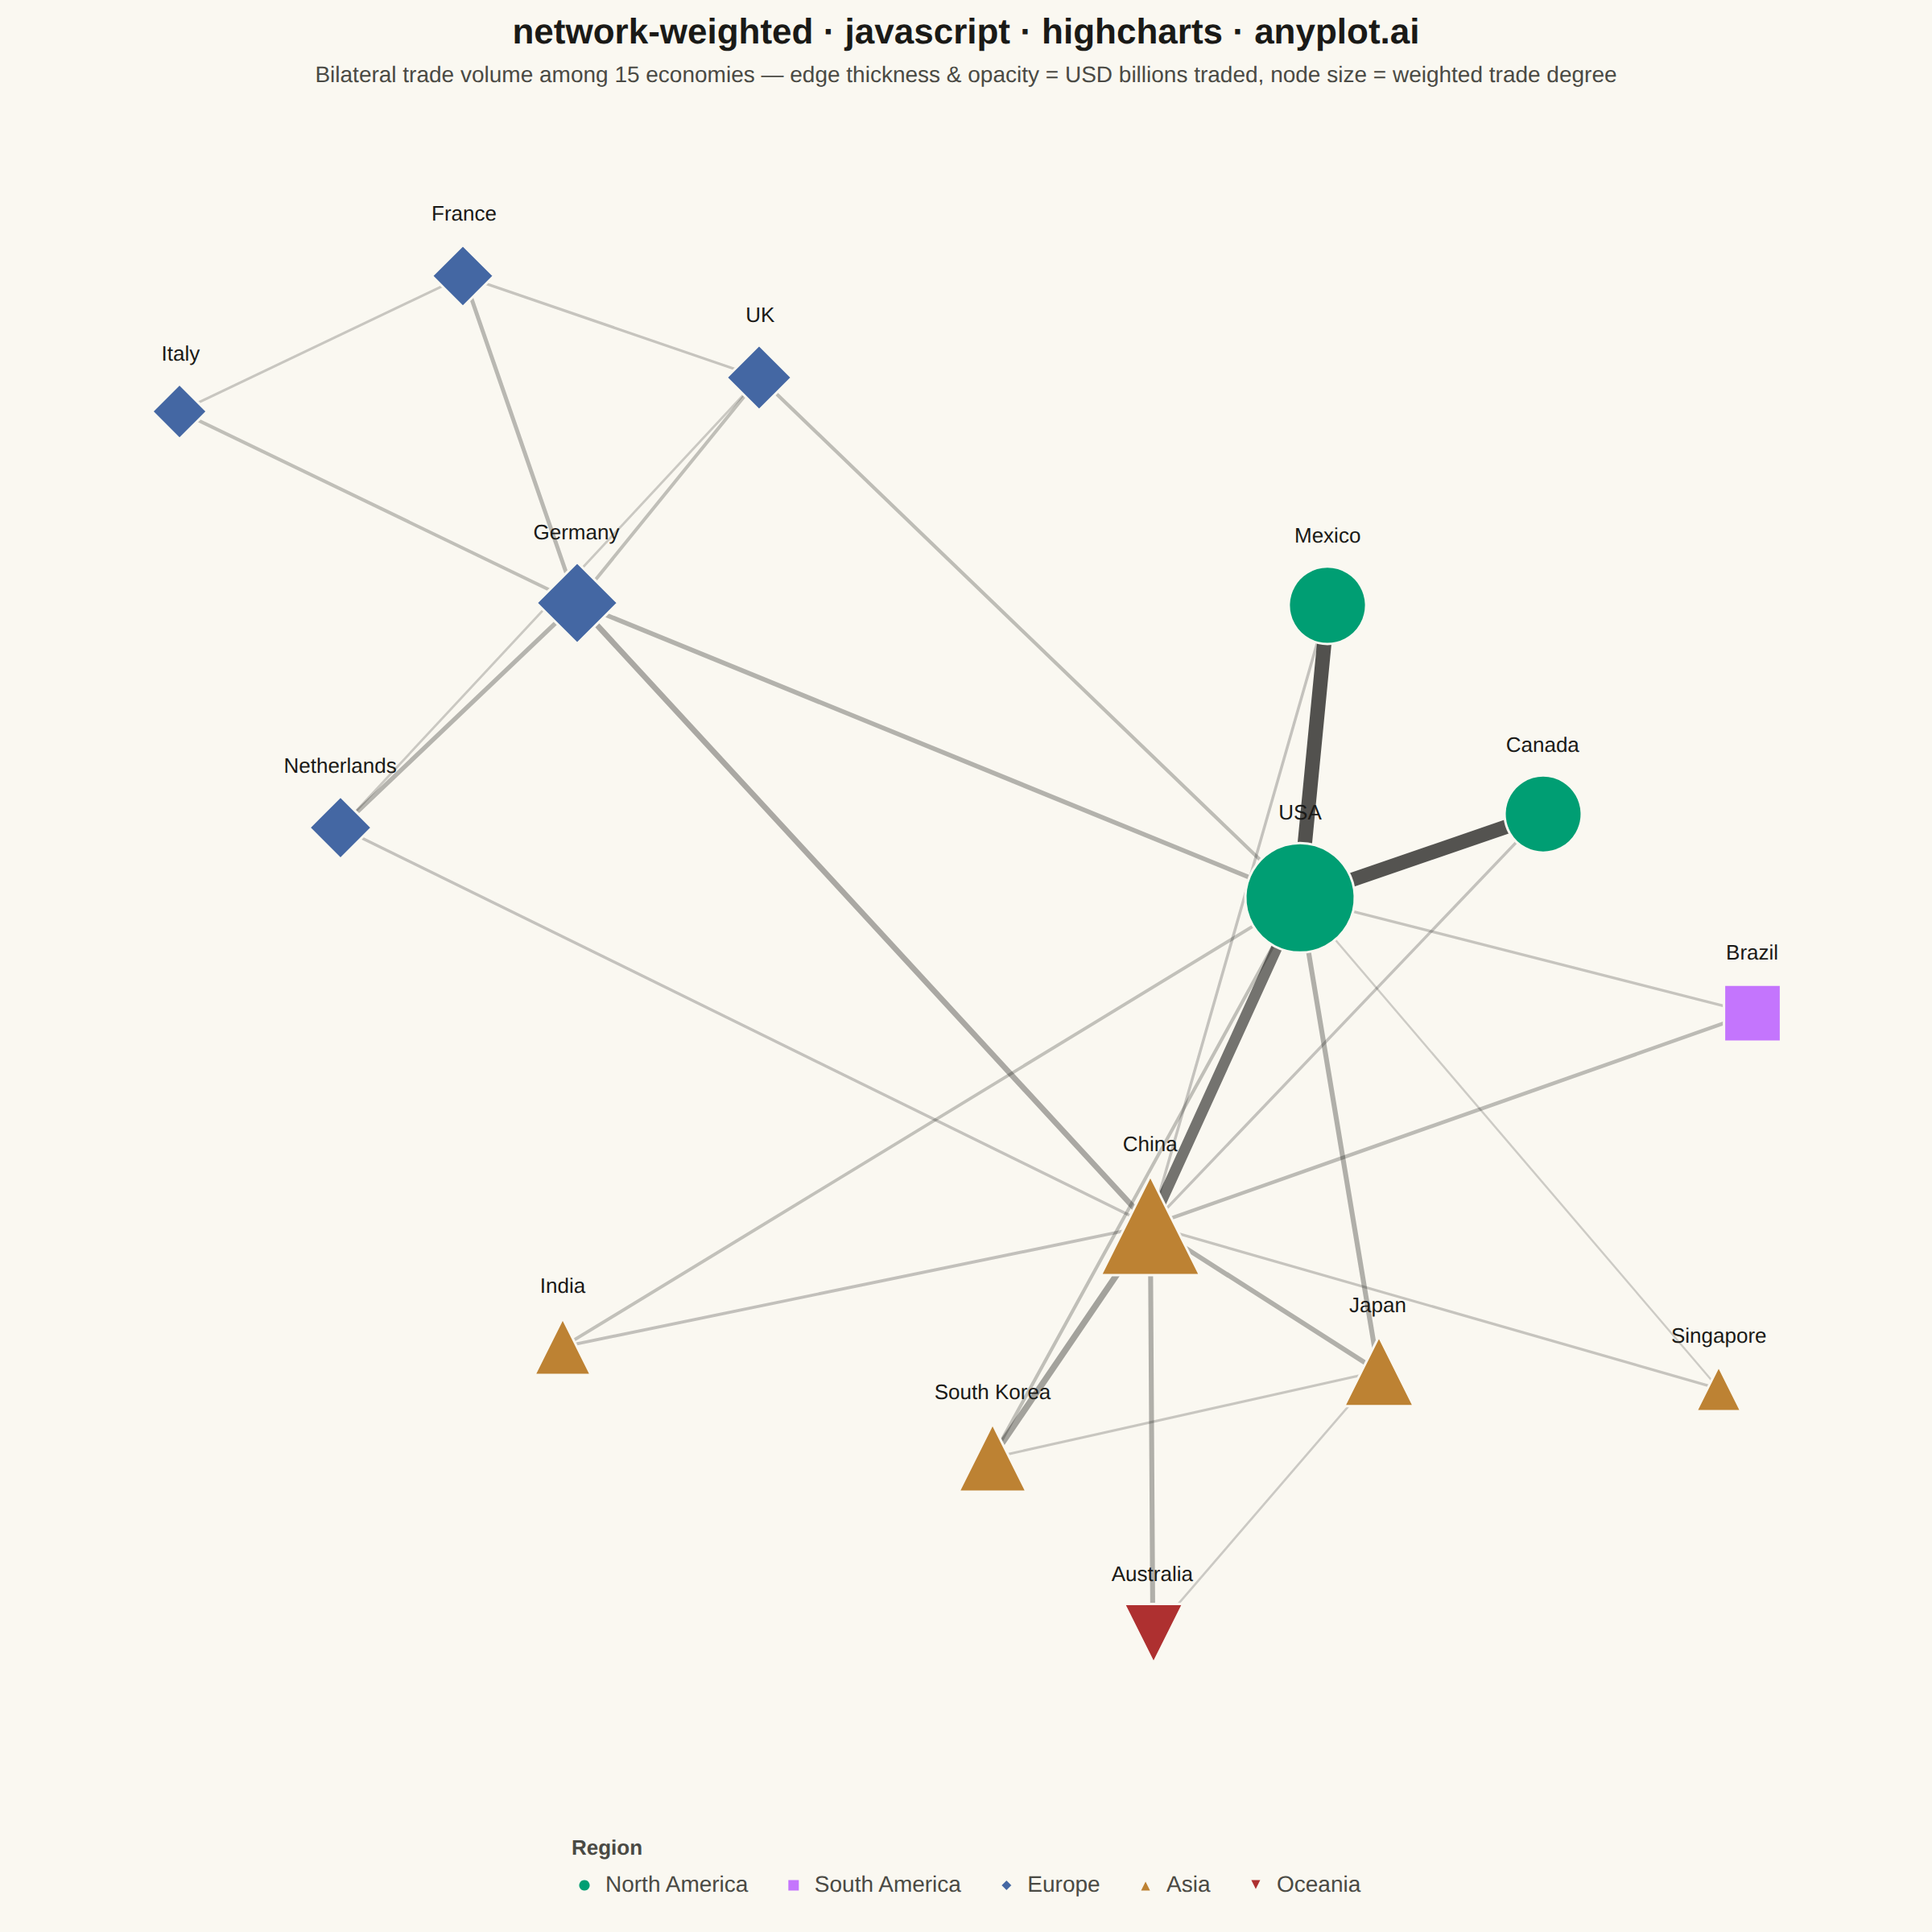
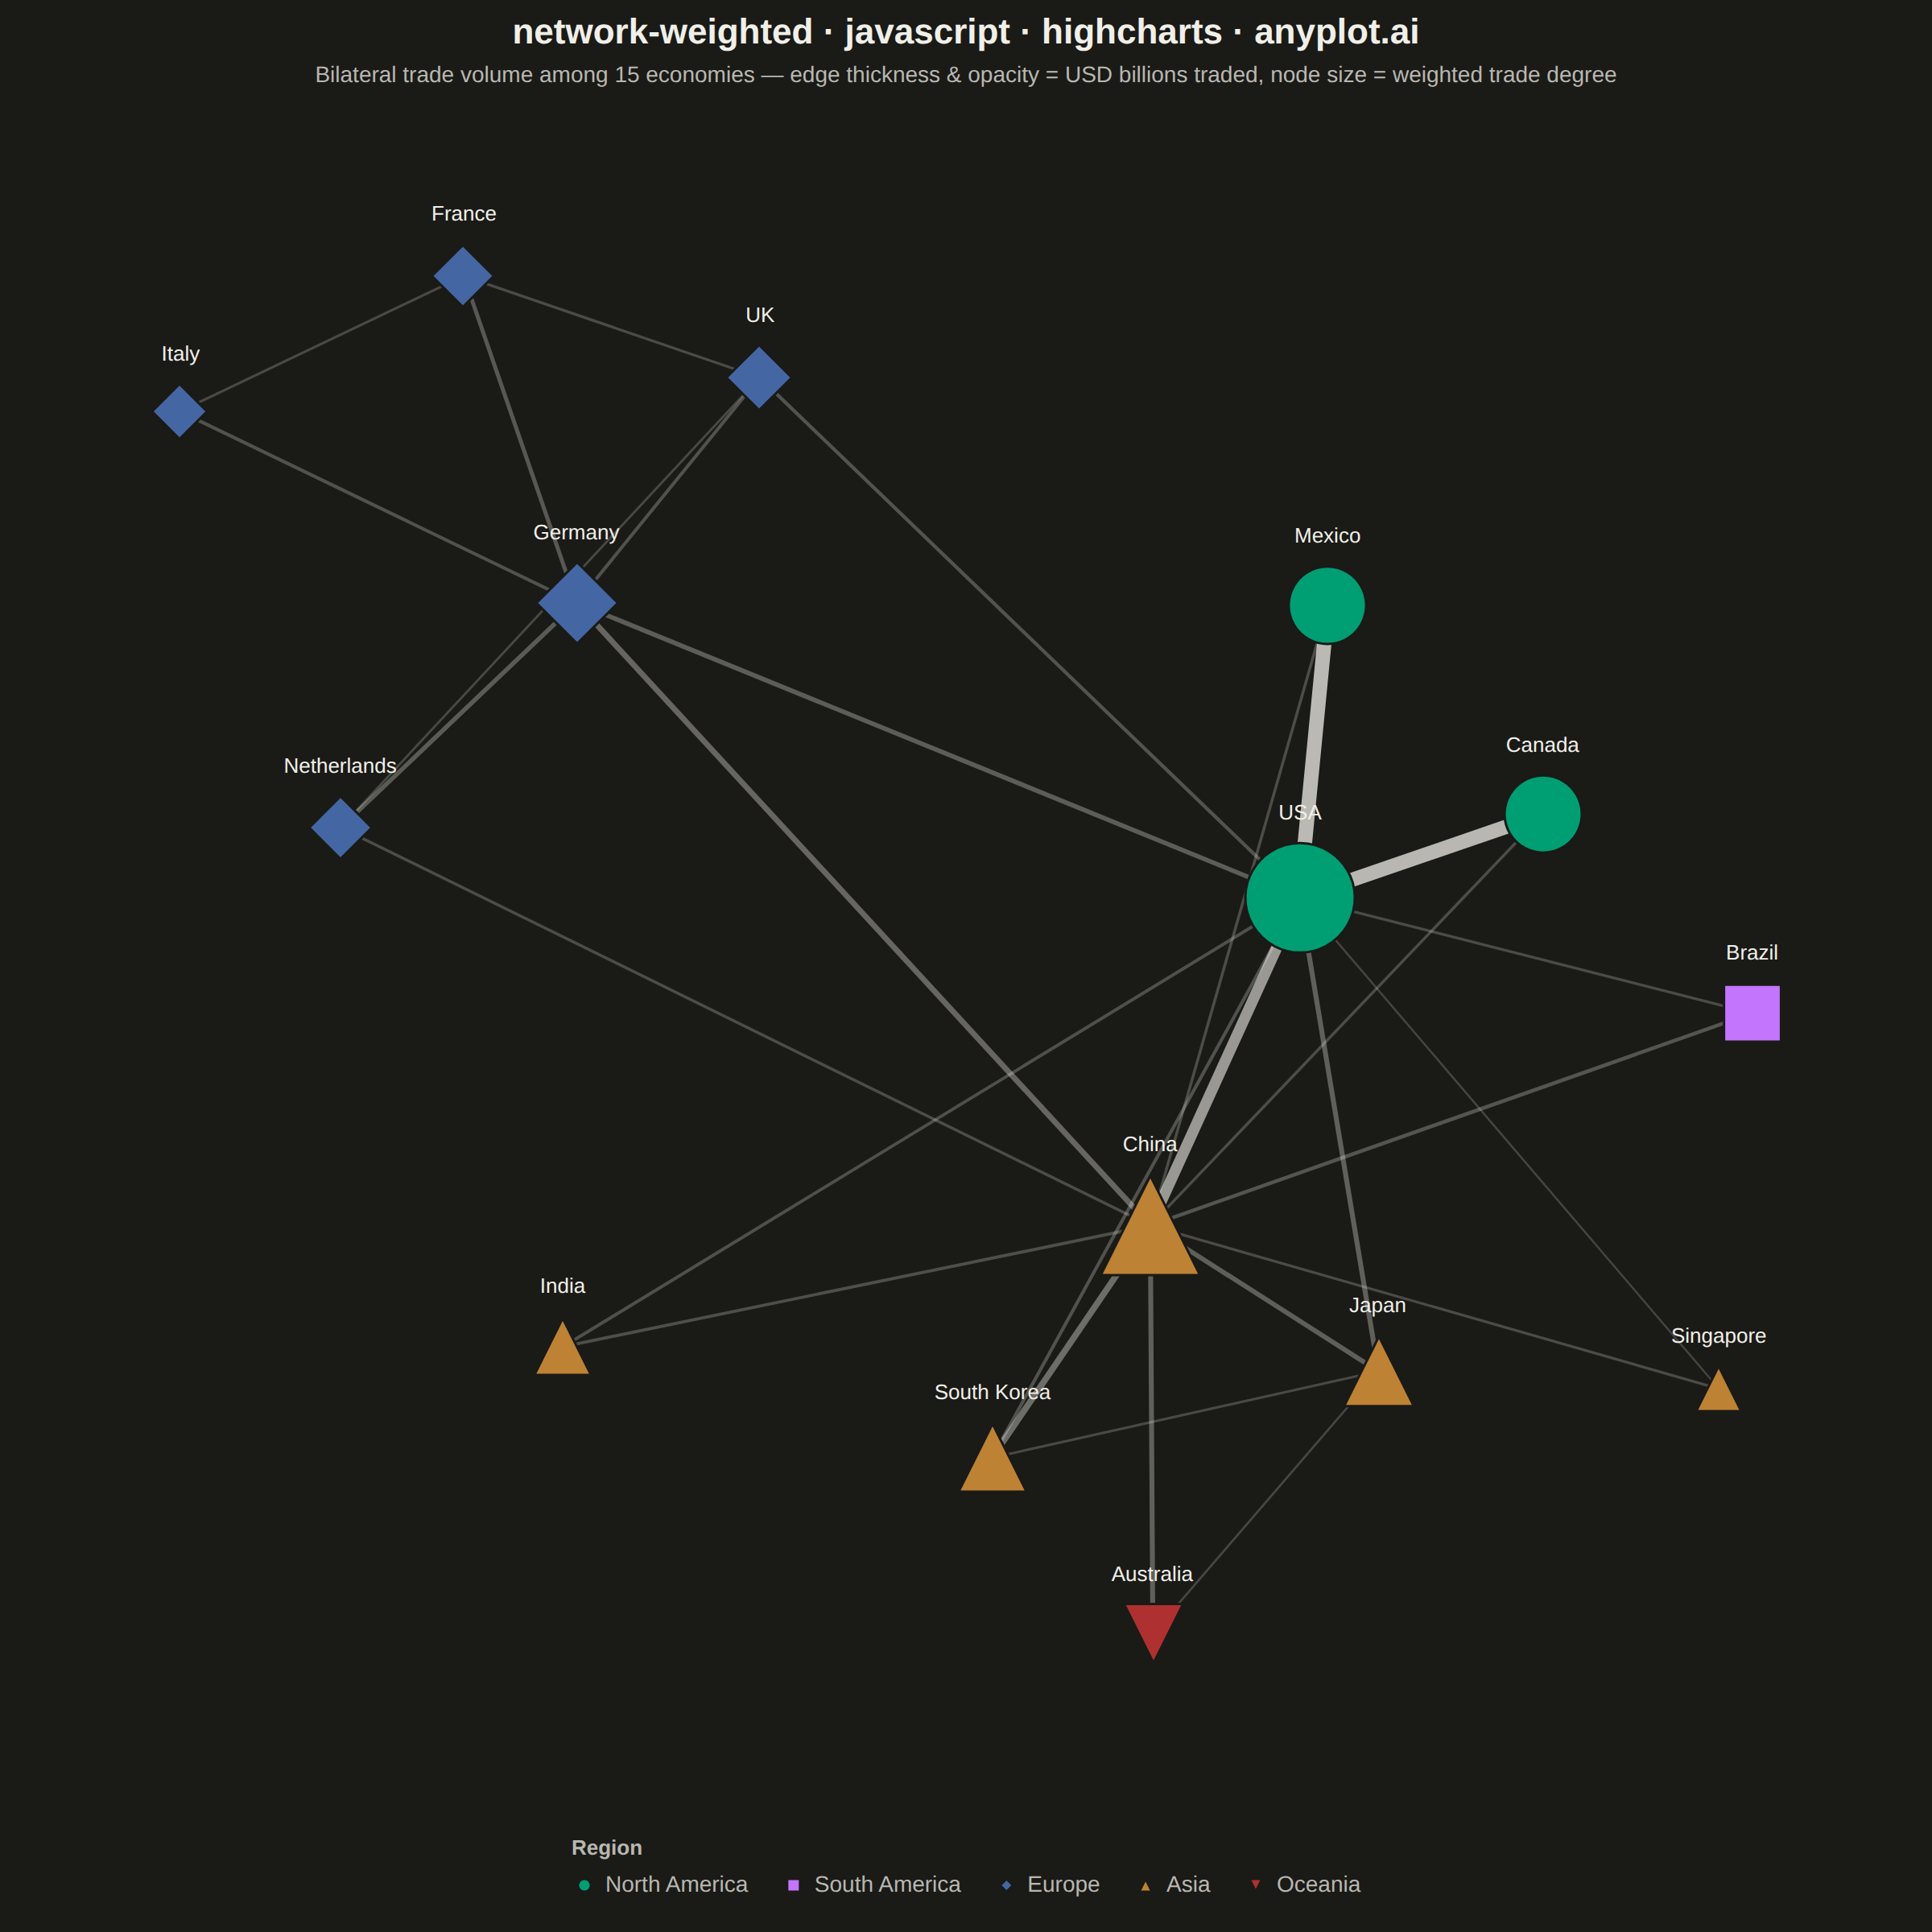
The same plot in 14 other libraries — JavaScript: Chart.js, D3.js, Apache ECharts, MUI X Charts; Python: Altair, Bokeh, lets-plot, Matplotlib, Plotly, plotnine, Pygal, Seaborn; R: ggplot2; Julia: Makie.jl. Compare all 15 side by side: Weighted Network Graph with Edge Thickness in Python, R, Julia and JavaScript.
A weighted network graph displays relationships between entities using edge thickness to represent connection strength or weight. Unlike basic network graphs where edges are uniform, the varying line widths immediately communicate the relative importance of each relationship. This visualization makes it easy to identify strong vs weak connections, central hubs with many heavy links, and structural patterns in weighted relational data.
// anyplot.ai
// network-weighted: Weighted Network Graph with Edge Thickness
// Library: highcharts 12.6.0 | JavaScript 22.23.2
// Quality: 89/100 | Created: 2026-09-02
//# anyplot-orientation: square

// Only the core Highcharts bundle is loaded (no `networkgraph` module), so
// node positions are computed here with a Fruchterman-Reingold force-directed
// layout — edge weight feeds directly into the attractive force so heavily
// traded pairs are pulled closer together, not just drawn thicker. Every edge
// is its own two-point `line` series so width and opacity can scale
// continuously with weight (a single series can't vary per-segment).
const t = window.ANYPLOT_TOKENS;

// --- Data: bilateral goods-trade volume among 15 major economies (USD billions, approx.) ---
const NODES = [
  { id: "USA", region: "North America" },
  { id: "Canada", region: "North America" },
  { id: "Mexico", region: "North America" },
  { id: "Brazil", region: "South America" },
  { id: "Germany", region: "Europe" },
  { id: "France", region: "Europe" },
  { id: "UK", region: "Europe" },
  { id: "Netherlands", region: "Europe" },
  { id: "Italy", region: "Europe" },
  { id: "China", region: "Asia" },
  { id: "Japan", region: "Asia" },
  { id: "South Korea", region: "Asia" },
  { id: "India", region: "Asia" },
  { id: "Singapore", region: "Asia" },
  { id: "Australia", region: "Oceania" },
];

const EDGES = [
  ["USA", "China", 575], ["USA", "Mexico", 780], ["USA", "Canada", 770],
  ["USA", "Germany", 200], ["USA", "Japan", 220], ["USA", "UK", 140],
  ["USA", "India", 120], ["USA", "South Korea", 130], ["USA", "Brazil", 90],
  ["USA", "Singapore", 50], ["Canada", "China", 100], ["Mexico", "China", 100],
  ["China", "Germany", 260], ["China", "Japan", 210], ["China", "South Korea", 300],
  ["China", "Australia", 220], ["China", "Netherlands", 100], ["China", "Brazil", 150],
  ["China", "India", 115], ["China", "Singapore", 90], ["Germany", "France", 170],
  ["Germany", "Netherlands", 190], ["Germany", "Italy", 130], ["Germany", "UK", 130],
  ["France", "UK", 90], ["France", "Italy", 80], ["Netherlands", "UK", 70],
  ["Japan", "South Korea", 80], ["Japan", "Australia", 60],
];

// Weighted degree (sum of incident trade volume) drives node size — a hub
// with many small links can rank below a pair with one dominant trade lane.
const weightedDegree = {};
NODES.forEach((node) => { weightedDegree[node.id] = 0; });
EDGES.forEach(([a, b, w]) => {
  weightedDegree[a] += w;
  weightedDegree[b] += w;
});
const degreeValues = Object.values(weightedDegree);
const minDegree = Math.min(...degreeValues);
const maxDegree = Math.max(...degreeValues);
function nodeRadius(id) {
  const norm = (weightedDegree[id] - minDegree) / (maxDegree - minDegree);
  return 14 + Math.sqrt(norm) * (34 - 14);
}
// All country labels share one size — node radius alone carries the degree
// hierarchy, so the labels stay uniform and easy to scan.
const NODE_LABEL_SIZE = 13;

// Edge weight -> line width / opacity, both scaled continuously (never a
// fixed handful of tiers) so the thickness itself communicates magnitude.
const edgeWeights = EDGES.map(([, , w]) => w);
const minWeight = Math.min(...edgeWeights);
const maxWeight = Math.max(...edgeWeights);
function edgeWidth(w) {
  const norm = (w - minWeight) / (maxWeight - minWeight);
  return 1.25 + norm * (9 - 1.25);
}
function edgeAlpha(w) {
  const norm = (w - minWeight) / (maxWeight - minWeight);
  return 0.2 + norm * (0.75 - 0.2);
}

// --- Force-directed layout (Fruchterman-Reingold, weight-aware attraction) --
const AREA = 100;
const idealDistance = Math.sqrt((AREA * AREA) / NODES.length);
const avgWeight = edgeWeights.reduce((sum, w) => sum + w, 0) / edgeWeights.length;
const pos = {};
NODES.forEach((node, i) => {
  const angle = (i / NODES.length) * 2 * Math.PI;
  pos[node.id] = { x: 42 * Math.cos(angle), y: 42 * Math.sin(angle) };
});

let temperature = AREA / 10;
for (let iter = 0; iter < 350; iter += 1) {
  const disp = {};
  NODES.forEach((node) => { disp[node.id] = { x: 0, y: 0 }; });

  for (let i = 0; i < NODES.length; i += 1) {
    for (let j = i + 1; j < NODES.length; j += 1) {
      const a = NODES[i].id;
      const b = NODES[j].id;
      const dx = pos[a].x - pos[b].x;
      const dy = pos[a].y - pos[b].y;
      const dist = Math.max(Math.sqrt(dx * dx + dy * dy), 0.01);
      const force = (idealDistance * idealDistance) / dist;
      disp[a].x += (dx / dist) * force;
      disp[a].y += (dy / dist) * force;
      disp[b].x -= (dx / dist) * force;
      disp[b].y -= (dy / dist) * force;
    }
  }

  // Attraction scales with edge weight relative to the network average — a
  // trade lane twice the average volume pulls its two endpoints twice as
  // hard, so heavily-linked economies cluster while thin ties stay loose.
  EDGES.forEach(([a, b, w]) => {
    const dx = pos[a].x - pos[b].x;
    const dy = pos[a].y - pos[b].y;
    const dist = Math.max(Math.sqrt(dx * dx + dy * dy), 0.01);
    const weightFactor = w / avgWeight;
    const force = ((dist * dist) / idealDistance) * weightFactor;
    disp[a].x -= (dx / dist) * force;
    disp[a].y -= (dy / dist) * force;
    disp[b].x += (dx / dist) * force;
    disp[b].y += (dy / dist) * force;
  });

  NODES.forEach((node) => {
    const dx = disp[node.id].x;
    const dy = disp[node.id].y;
    const dist = Math.max(Math.sqrt(dx * dx + dy * dy), 0.01);
    const capped = Math.min(dist, temperature);
    pos[node.id].x += (dx / dist) * capped;
    pos[node.id].y += (dy / dist) * capped;
  });
  temperature *= 0.97;
}

// Weighted-degree hubs sit close to the centroid while lightly-connected
// nodes (Singapore, Italy) settle far outside the core under pure repulsion —
// a continuous spread, not just one or two outliers. A min/max rescale
// stretches the whole canvas to fit the single farthest node, cramming the
// rest of the network into a small central patch and leaving wide empty
// bands near the edges. Apply a radial power-law compression (exponent < 1)
// around the centroid: distances shrink relative to each other the farther
// out they are, so the far nodes move inward and the near ones spread out,
// filling the canvas evenly while preserving each node's direction and
// relative ordering from the centroid.
const centroid0 = { x: 0, y: 0 };
NODES.forEach((node) => {
  centroid0.x += pos[node.id].x / NODES.length;
  centroid0.y += pos[node.id].y / NODES.length;
});
const distsFromCentroid = NODES.map((node) => {
  const dx = pos[node.id].x - centroid0.x;
  const dy = pos[node.id].y - centroid0.y;
  return Math.sqrt(dx * dx + dy * dy);
}).sort((a, b) => a - b);
const medianDist = distsFromCentroid[Math.floor(distsFromCentroid.length / 2)];
const RADIAL_COMPRESSION = 0.6;
NODES.forEach((node) => {
  const dx = pos[node.id].x - centroid0.x;
  const dy = pos[node.id].y - centroid0.y;
  const dist = Math.max(Math.sqrt(dx * dx + dy * dy), 0.01);
  const newDist = medianDist * (dist / medianDist) ** RADIAL_COMPRESSION;
  const scale = newDist / dist;
  pos[node.id].x = centroid0.x + dx * scale;
  pos[node.id].y = centroid0.y + dy * scale;
});

// The layout has no fixed boundary — recenter and rescale it into a known
// frame before handing coordinates to the axes.
let minX = Infinity;
let maxX = -Infinity;
let minY = Infinity;
let maxY = -Infinity;
NODES.forEach((node) => {
  minX = Math.min(minX, pos[node.id].x);
  maxX = Math.max(maxX, pos[node.id].x);
  minY = Math.min(minY, pos[node.id].y);
  maxY = Math.max(maxY, pos[node.id].y);
});
// Independent x/y scaling (rather than a shared aspect-preserving factor) —
// force-directed positions only encode approximate proximity, not exact
// distance, so stretching each axis to fill the square canvas is safe and
// avoids leaving one axis mostly blank when the graph's natural bounding
// box isn't itself square.
const centerX = (minX + maxX) / 2;
const centerY = (minY + maxY) / 2;
const scaleX = 48 / ((maxX - minX) / 2);
const scaleY = 48 / ((maxY - minY) / 2);
NODES.forEach((node) => {
  pos[node.id].x = (pos[node.id].x - centerX) * scaleX;
  pos[node.id].y = (pos[node.id].y - centerY) * scaleY;
});

// --- Chart -------------------------------------------------------------------
const REGIONS = ["North America", "South America", "Europe", "Asia", "Oceania"];
const REGION_COLOR = {};
const REGION_SYMBOL = {};
const SYMBOLS = ["circle", "square", "diamond", "triangle", "triangle-down"];
REGIONS.forEach((region, i) => {
  REGION_COLOR[region] = t.palette[i];
  REGION_SYMBOL[region] = SYMBOLS[i];
});

const edgeSeries = EDGES.map(([a, b, w]) => ({
  type: "line",
  name: `${a} ↔ ${b}`,
  data: [[pos[a].x, pos[a].y], [pos[b].x, pos[b].y]],
  color: t.grid.replace(/[\d.]+\)$/, `${edgeAlpha(w)})`),
  lineWidth: edgeWidth(w),
  marker: { enabled: false },
  enableMouseTracking: true,
  stickyTracking: false,
  showInLegend: false,
  custom: { source: a, target: b, weight: w },
  zIndex: 0,
}));

const nodeSeries = REGIONS.map((region) => ({
  type: "scatter",
  name: region,
  color: REGION_COLOR[region],
  marker: { symbol: REGION_SYMBOL[region], lineColor: t.pageBg, lineWidth: 1.5 },
  data: NODES.filter((node) => node.region === region).map((node) => {
    const radius = nodeRadius(node.id);
    return {
      x: pos[node.id].x,
      y: pos[node.id].y,
      name: node.id,
      custom: { weightedDegree: weightedDegree[node.id] },
      marker: { radius },
      dataLabels: { y: -(radius + 8), style: { fontSize: `${NODE_LABEL_SIZE}px` } },
    };
  }),
  dataLabels: {
    enabled: true,
    format: "{point.name}",
    allowOverlap: false,
    style: { color: t.ink, fontWeight: "normal", textOutline: "none" },
  },
  zIndex: 1,
}));

Highcharts.chart("container", {
  chart: {
    backgroundColor: "transparent",
    animation: false,
    style: { fontFamily: "inherit" },
  },
  credits: { enabled: false },
  title: {
    text: "network-weighted · javascript · highcharts · anyplot.ai",
    style: { color: t.ink, fontSize: "22px", fontWeight: "600" },
  },
  subtitle: {
    text: "Bilateral trade volume among 15 economies — edge thickness & opacity = USD billions traded, node size = weighted trade degree",
    style: { color: t.inkSoft, fontSize: "14px" },
  },
  xAxis: { visible: false, min: -58, max: 58 },
  yAxis: { visible: false, min: -58, max: 58, title: { text: null } },
  legend: {
    enabled: true,
    title: { text: "Region", style: { color: t.inkSoft, fontSize: "13px" } },
    itemStyle: { color: t.inkSoft, fontSize: "14px" },
    itemHoverStyle: { color: t.ink },
  },
  tooltip: {
    backgroundColor: t.elevatedBg,
    borderColor: t.grid,
    style: { color: t.ink, fontSize: "13px" },
    formatter: function formatTooltip() {
      const seriesCustom = this.series.userOptions.custom;
      if (seriesCustom && seriesCustom.weight !== undefined) {
        return `<b>${seriesCustom.source} ↔ ${seriesCustom.target}</b><br/>Trade volume: $${seriesCustom.weight}B`;
      }
      return `<b>${this.point.name}</b><br/>Weighted trade degree: $${this.point.custom.weightedDegree}B`;
    },
  },
  plotOptions: {
    series: { animation: false },
    scatter: { states: { hover: { enabled: false } } },
    line: { states: { hover: { enabled: false } } },
  },
  series: [...edgeSeries, ...nodeSeries],
});
Runnable source as JSON, for any HTTP client: https://api.anyplot.ai/specs/network-weighted/highcharts/code. Any spec id and library id listed in llms-full.txt fit the same URL shape; every URL below is complete and callable.
{
  "spec_id": "network-weighted",
  "language": "javascript",
  "library": "highcharts",
  "page": "https://anyplot.ai/network-weighted/javascript/highcharts",
  "hub": "https://anyplot.ai/network-weighted",
  "code_json": "https://api.anyplot.ai/specs/network-weighted/highcharts/code",
  "spec_json": "https://api.anyplot.ai/specs/network-weighted",
  "render_light_png": "https://storage.googleapis.com/anyplot-images/plots/network-weighted/javascript/highcharts/plot-light.png",
  "render_dark_png": "https://storage.googleapis.com/anyplot-images/plots/network-weighted/javascript/highcharts/plot-dark.png",
  "interactive_light_html": "https://storage.googleapis.com/anyplot-images/plots/network-weighted/javascript/highcharts/plot-light.html",
  "interactive_dark_html": "https://storage.googleapis.com/anyplot-images/plots/network-weighted/javascript/highcharts/plot-dark.html",
  "quality_score": 89.0,
  "license": "MIT",
  "guide": "https://anyplot.ai/llms.txt"
}
Part of Weighted Network Graph with Edge Thickness on anyplot.ai.