The same plot in 14 other libraries — JavaScript: D3.js, Apache ECharts, Highcharts, MUI X Charts; Python: Altair, Bokeh, lets-plot, Matplotlib, Plotly, plotnine, Pygal, Seaborn; R: ggplot2; Julia: Makie.jl. Compare all 15 side by side: Basic Q-Q Plot in Python, R, Julia and JavaScript.
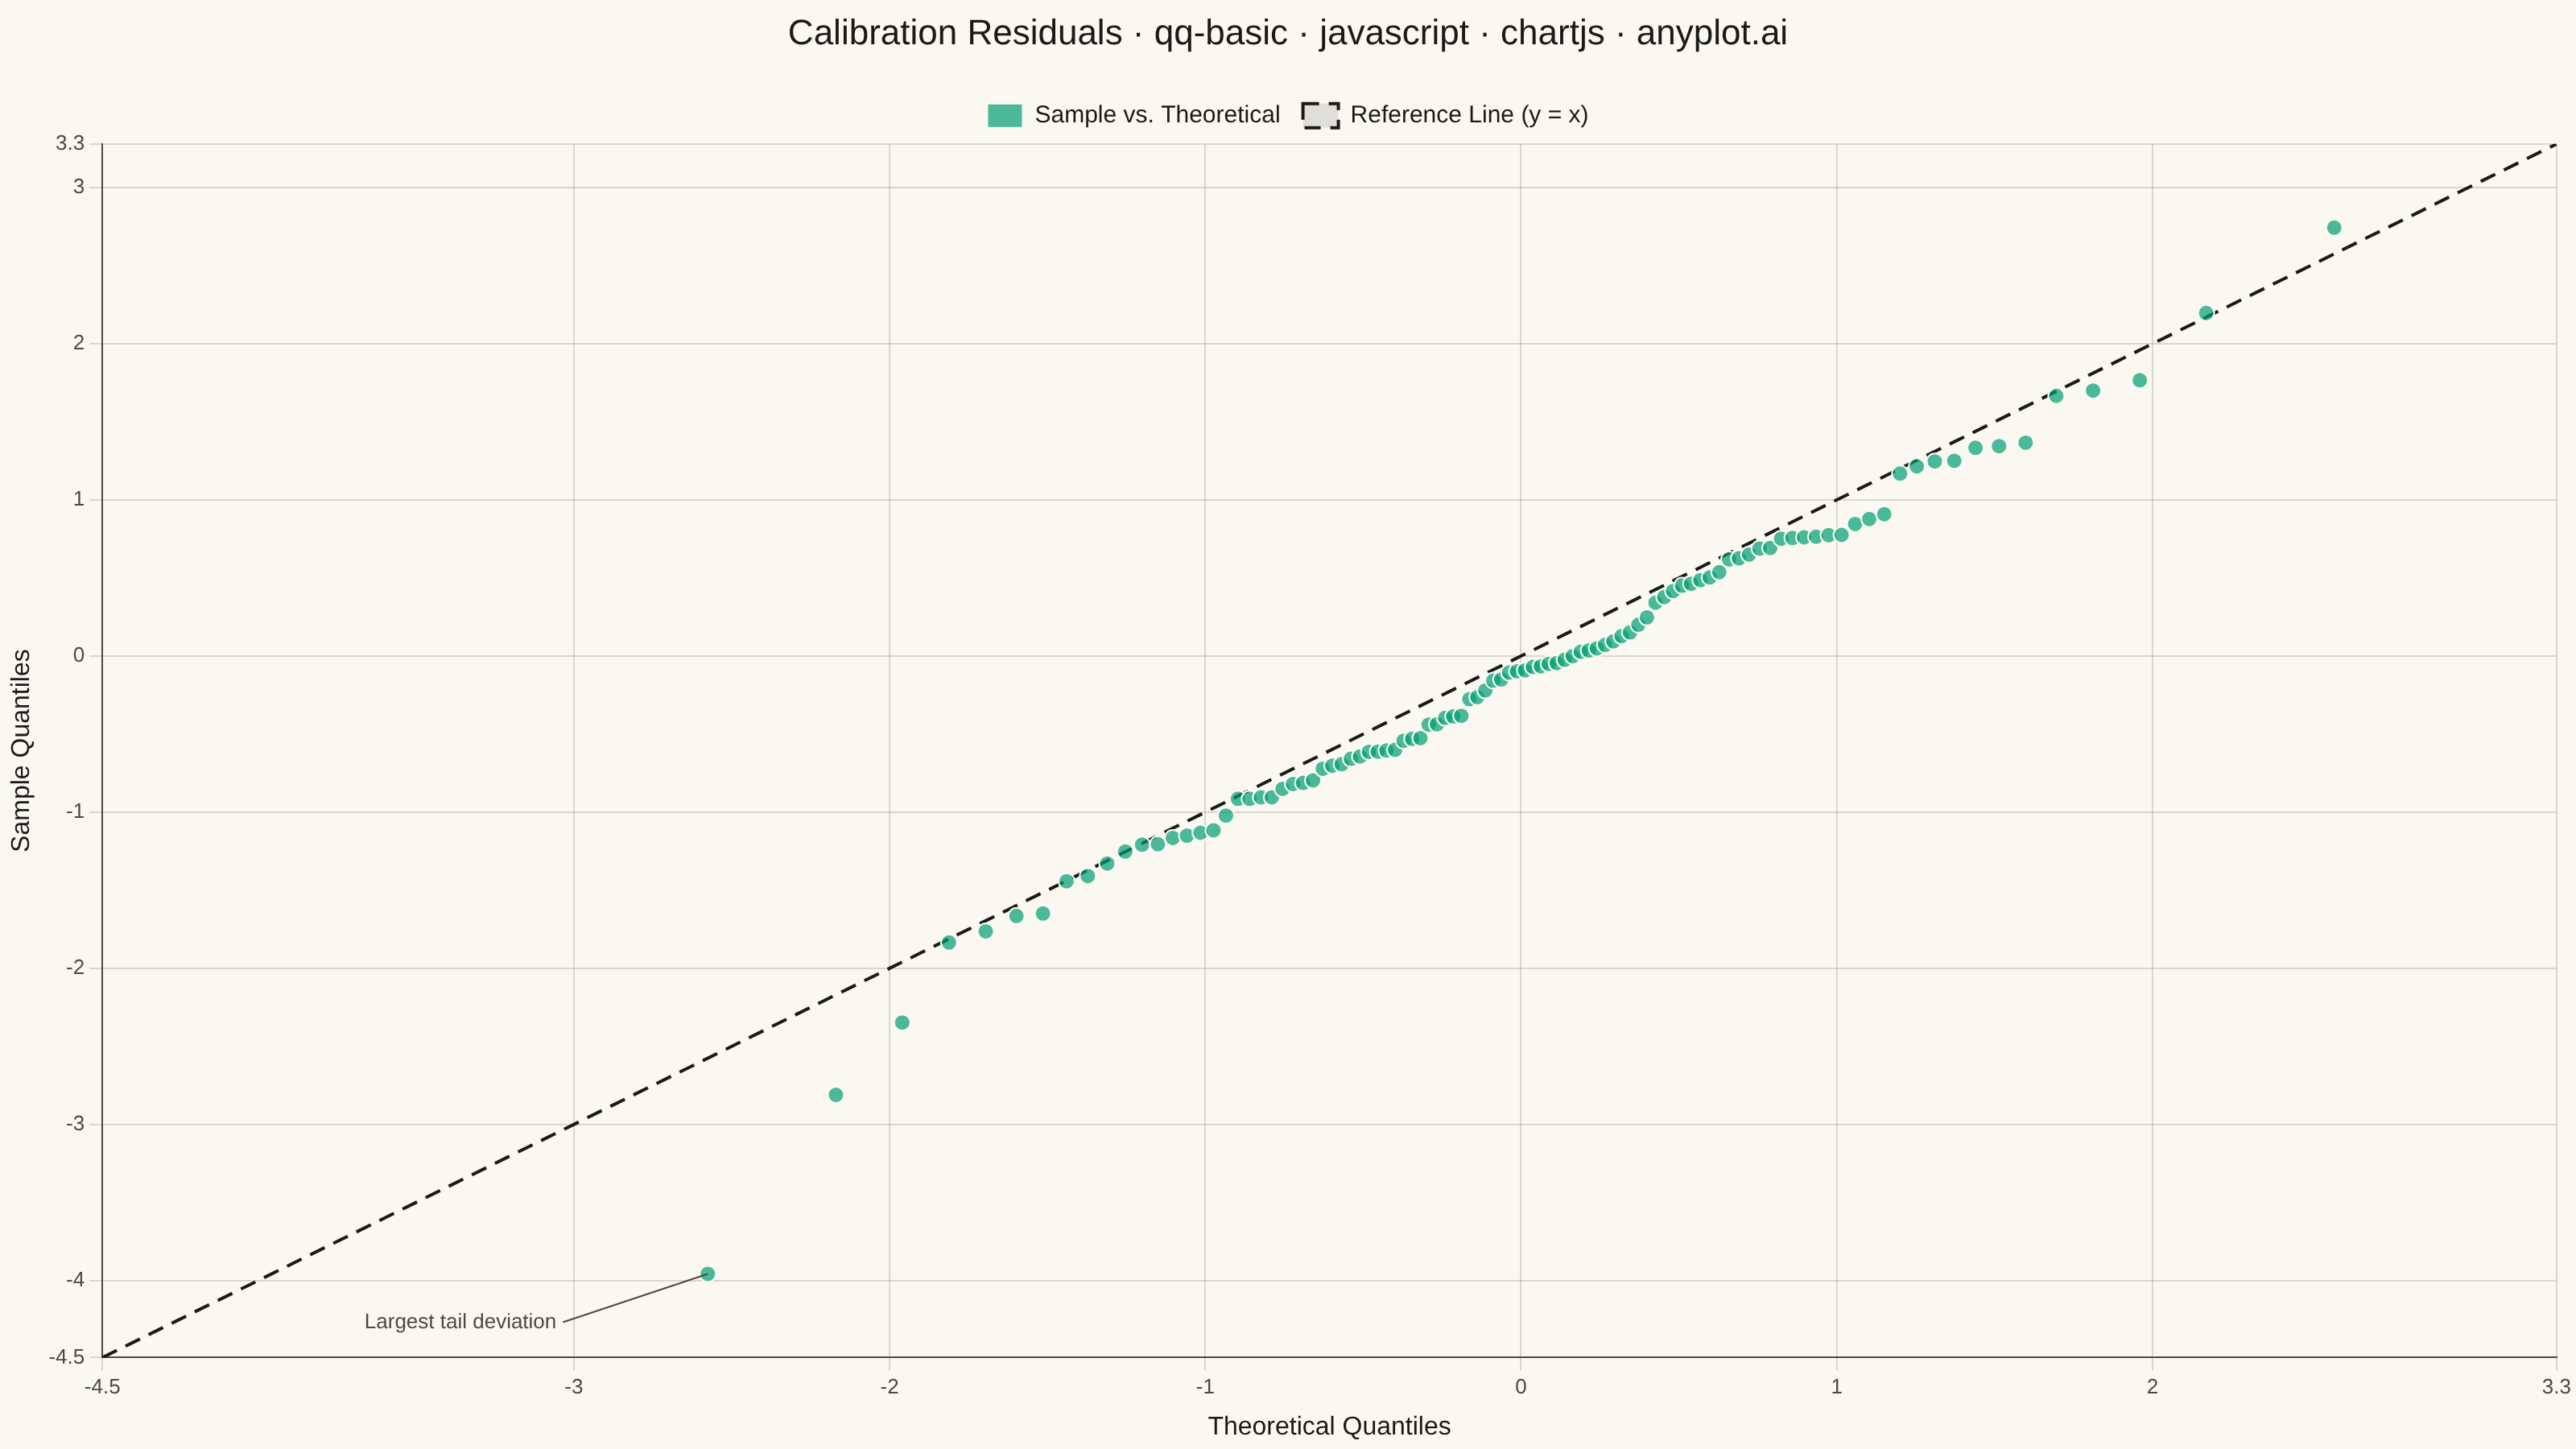
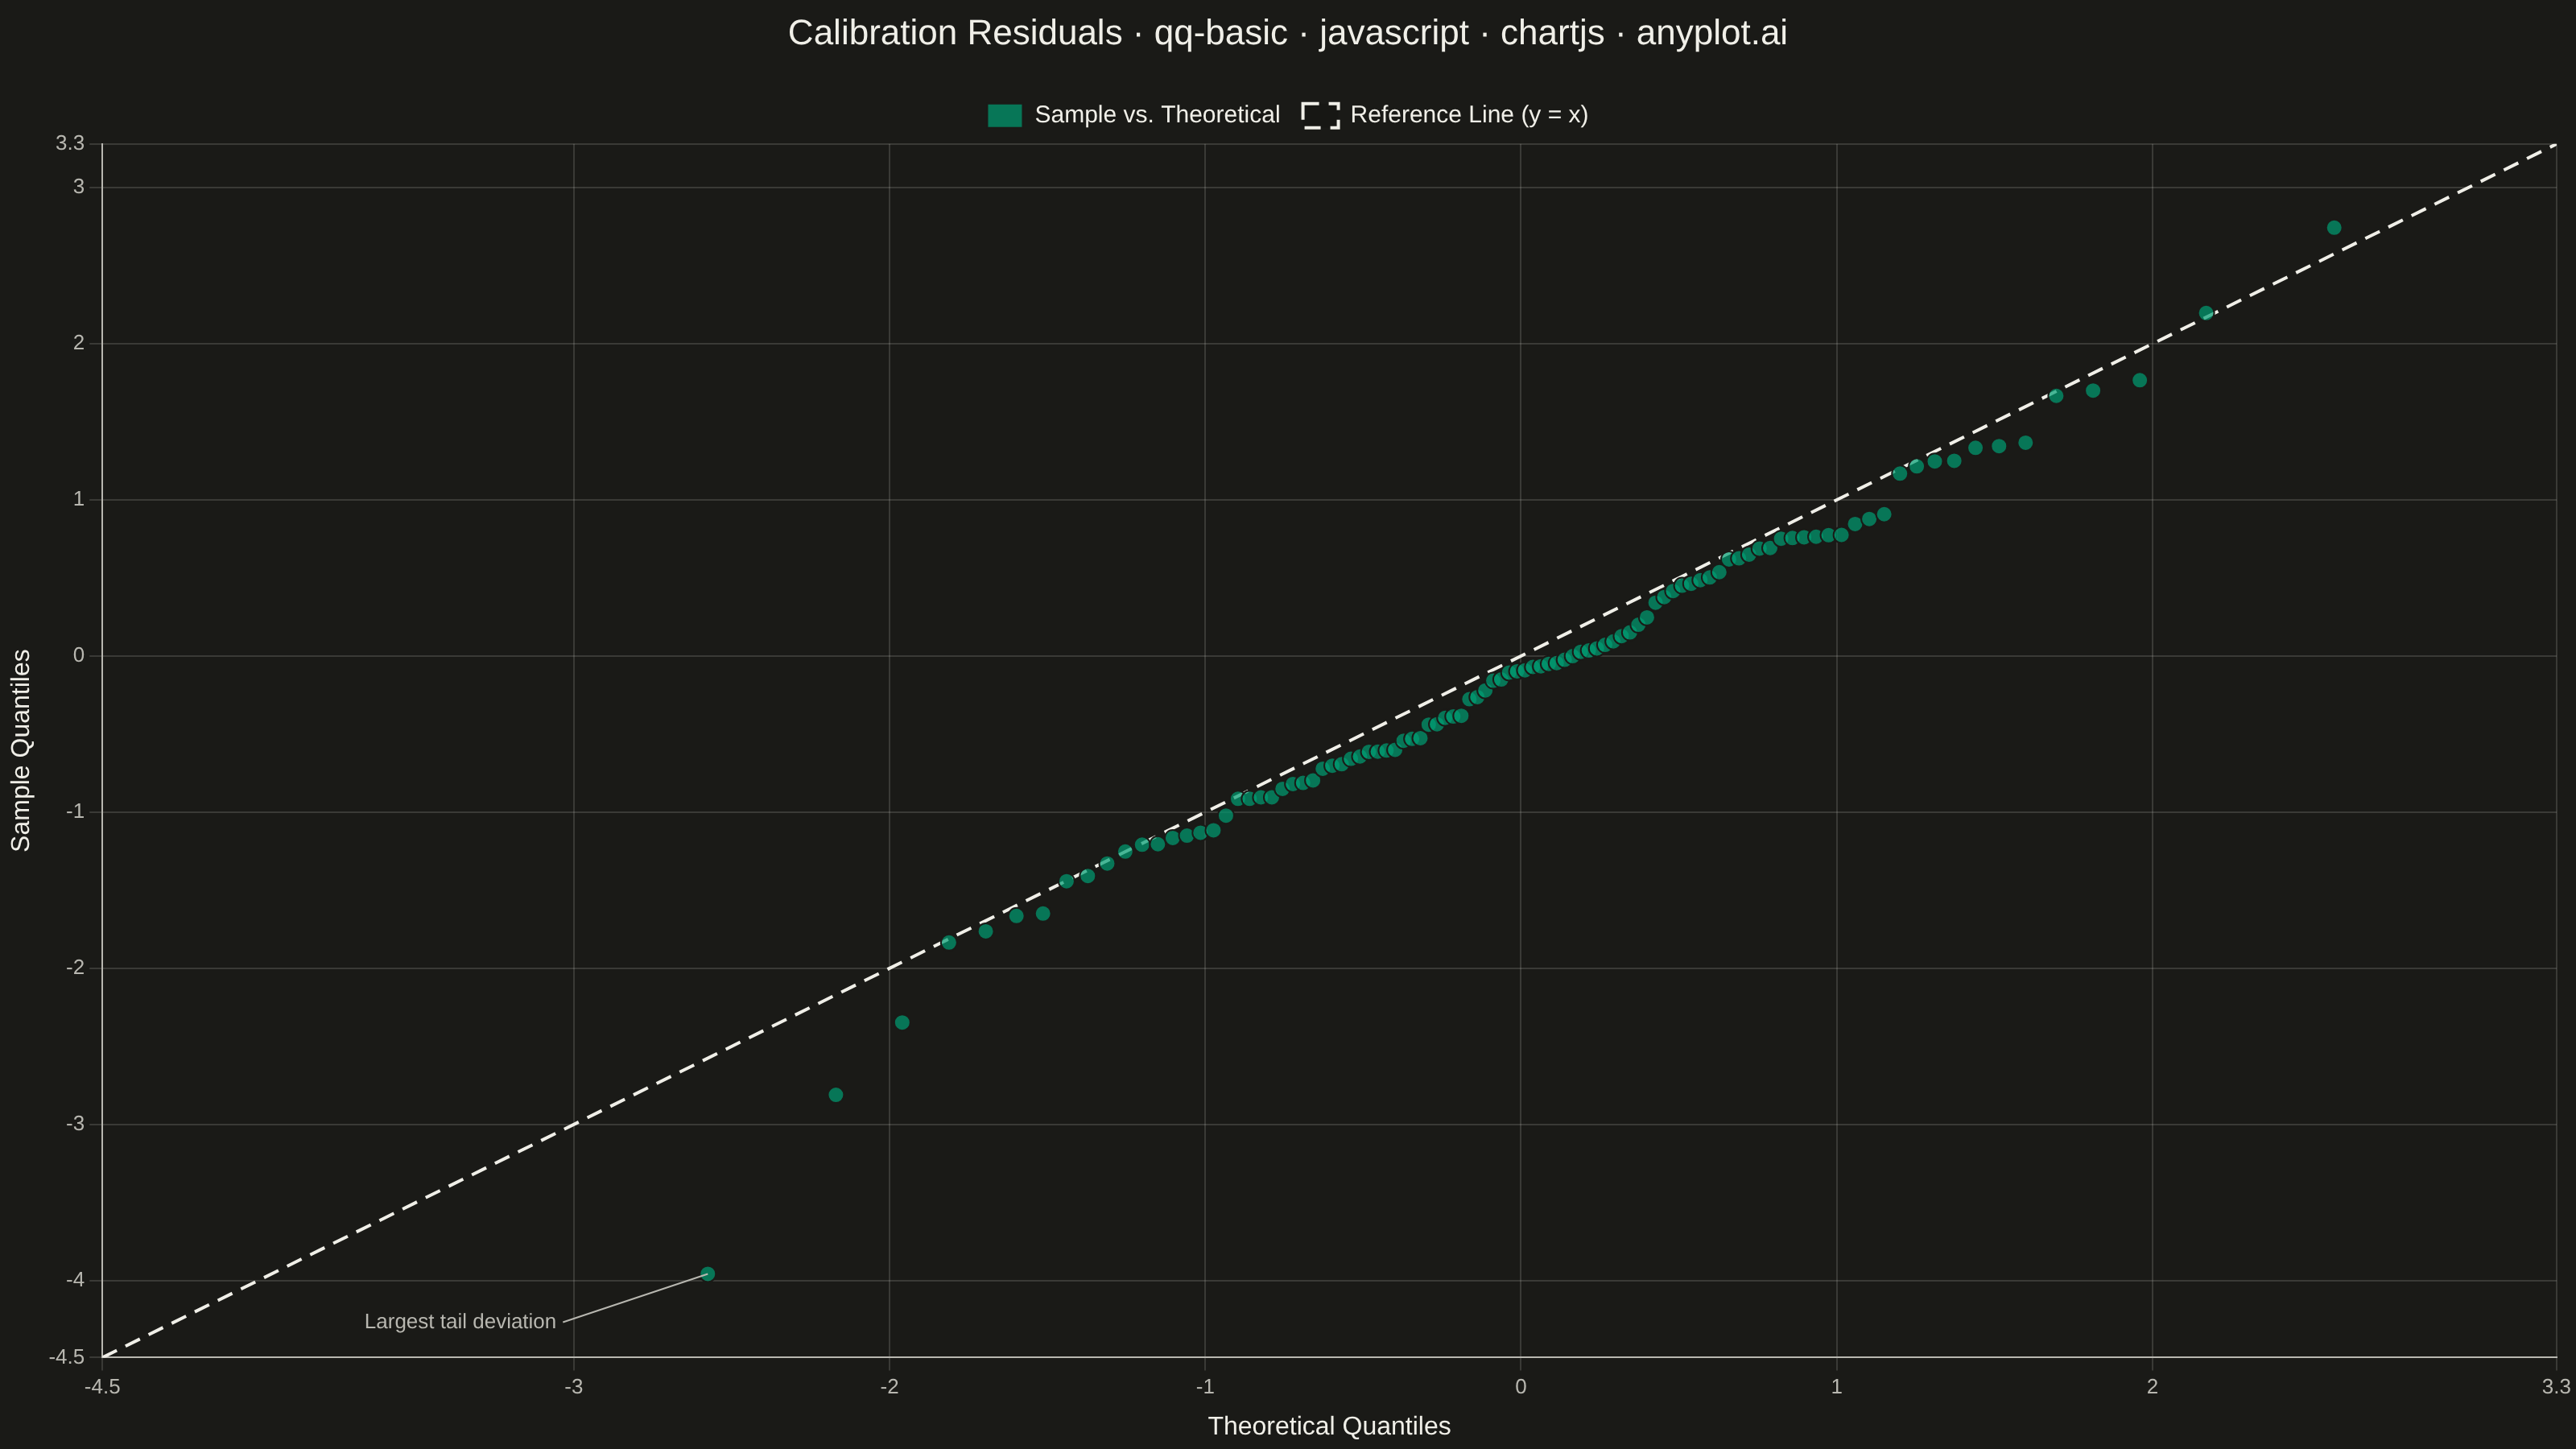
A Q-Q (Quantile-Quantile) plot compares the distribution of a dataset against a theoretical distribution (typically normal) or another dataset. Points are plotted by matching sample quantiles to theoretical quantiles, with a reference line indicating perfect distribution match. Deviations from the line reveal distribution characteristics such as skewness, heavy tails, and outliers.
// anyplot.ai
// qq-basic: Basic Q-Q Plot
// Library: chartjs 4.4.7 | JavaScript 22.23.1
// Quality: 92/100 | Created: 2026-07-24
//# anyplot-orientation: landscape

const t = window.ANYPLOT_TOKENS;

// --- Deterministic PRNG (Park-Miller LCG) + Box-Muller normal sampler ------
let seed = 42;
function nextUniform() {
  seed = (seed * 16807) % 2147483647;
  return seed / 2147483647;
}
function nextStandardNormal() {
  const u1 = Math.max(nextUniform(), 1e-12);
  const u2 = nextUniform();
  return Math.sqrt(-2 * Math.log(u1)) * Math.cos(2 * Math.PI * u2);
}

// --- Inverse standard-normal CDF (Acklam's rational approximation) --------
function normInv(p) {
  const a = [-3.969683028665376e1, 2.209460984245205e2, -2.759285104469687e2,
    1.383577518672690e2, -3.066479806614716e1, 2.506628277459239e0];
  const b = [-5.447609879822406e1, 1.615858368580409e2, -1.556989798598866e2,
    6.680131188771972e1, -1.328068155288572e1];
  const c = [-7.784894002430293e-3, -3.223964580411365e-1, -2.400758277161838e0,
    -2.549732539343734e0, 4.374664141464968e0, 2.938163982698783e0];
  const d = [7.784695709041462e-3, 3.224671290700398e-1, 2.445134137142996e0,
    3.754408661907416e0];
  const pLow = 0.02425;
  const pHigh = 1 - pLow;
  if (p < pLow) {
    const q = Math.sqrt(-2 * Math.log(p));
    return (((((c[0] * q + c[1]) * q + c[2]) * q + c[3]) * q + c[4]) * q + c[5]) /
      ((((d[0] * q + d[1]) * q + d[2]) * q + d[3]) * q + 1);
  }
  if (p <= pHigh) {
    const q = p - 0.5;
    const r = q * q;
    return (((((a[0] * r + a[1]) * r + a[2]) * r + a[3]) * r + a[4]) * r + a[5]) * q /
      (((((b[0] * r + b[1]) * r + b[2]) * r + b[3]) * r + b[4]) * r + 1);
  }
  const q = Math.sqrt(-2 * Math.log(1 - p));
  return -(((((c[0] * q + c[1]) * q + c[2]) * q + c[3]) * q + c[4]) * q + c[5]) /
    ((((d[0] * q + d[1]) * q + d[2]) * q + d[3]) * q + 1);
}

// --- Data: standardized residuals from a precision gauge calibration run ---
// (z-scores; a Q-Q plot against the standard normal tests whether the
// instrument's error distribution supports the normality assumption behind
// its control-chart limits)
const n = 100;
const residuals = [];
for (let i = 0; i < n; i++) residuals.push(nextStandardNormal());
residuals.sort((x, y) => x - y);

const qqPoints = residuals.map((sampleQuantile, i) => ({
  x: normInv((i + 0.5) / n),
  y: sampleQuantile,
}));

// The point with the largest departure from the reference line — the visual
// signature of the heavy-tail/outlier behavior this plot is meant to surface.
const maxDevPoint = qqPoints.reduce((worst, p) =>
  Math.abs(p.y - p.x) > Math.abs(worst.y - worst.x) ? p : worst
);

// 45-degree reference line spanning the data range, with a little padding.
// The axis min/max below are set explicitly to this same [lo - pad, hi + pad]
// range, so the dashed line always reaches the plot corners instead of
// stopping short of Chart.js's auto-scaled (and independently rounded) extent.
const allCoords = qqPoints.flatMap((p) => [p.x, p.y]);
const lo = Math.min(...allCoords);
const hi = Math.max(...allCoords);
const pad = (hi - lo) * 0.08;
const axisMin = lo - pad;
const axisMax = hi + pad;
const referenceLine = [
  { x: axisMin, y: axisMin },
  { x: axisMax, y: axisMax },
];

// --- Mount -------------------------------------------------------------------
const canvas = document.createElement('canvas');
document.getElementById('container').appendChild(canvas);

// --- Title — scale font size for length (baseline: 22px at 67 chars) -------
const titleText = 'Calibration Residuals · qq-basic · javascript · chartjs · anyplot.ai';
const titleSize = Math.max(14, Math.round(22 * 67 / titleText.length));

// --- Custom plugin: callout labeling the largest tail deviation ------------
// A native Chart.js plugin (afterDatasetsDraw hook) rather than a bundled
// datalabels plugin — draws a leader line + text pointing at the point that
// diverges most from the reference line, reinforcing the outlier/heavy-tail
// story the spec calls for.
const tailCalloutPlugin = {
  id: 'tailCallout',
  afterDatasetsDraw(chart) {
    const { ctx, chartArea, scales } = chart;
    const px = scales.x.getPixelForValue(maxDevPoint.x);
    const py = scales.y.getPixelForValue(maxDevPoint.y);
    const cx = (chartArea.left + chartArea.right) / 2;
    const cy = (chartArea.top + chartArea.bottom) / 2;
    const dirX = px >= cx ? 1 : -1;
    const dirY = py >= cy ? 1 : -1;
    const labelX = px + dirX * 90;
    const labelY = py + dirY * 30;

    ctx.save();
    ctx.strokeStyle = t.inkSoft;
    ctx.lineWidth = 1;
    ctx.beginPath();
    ctx.moveTo(px, py);
    ctx.lineTo(labelX, labelY);
    ctx.stroke();

    ctx.fillStyle = t.inkSoft;
    ctx.font = '13px sans-serif';
    ctx.textAlign = dirX > 0 ? 'left' : 'right';
    ctx.textBaseline = 'middle';
    ctx.fillText('Largest tail deviation', labelX + dirX * 4, labelY);
    ctx.restore();
  },
};

// --- Chart -------------------------------------------------------------------
new Chart(canvas, {
  type: 'scatter',
  data: {
    datasets: [
      {
        type: 'line',
        label: 'Reference Line (y = x)',
        data: referenceLine,
        borderColor: t.ink,
        borderDash: [10, 6],
        borderWidth: 2,
        pointRadius: 0,
        fill: false,
        order: 2,
      },
      {
        type: 'scatter',
        label: 'Sample vs. Theoretical',
        data: qqPoints,
        backgroundColor: `${t.palette[0]}B3`,
        borderColor: t.pageBg,
        borderWidth: 1,
        pointRadius: 5,
        pointHoverRadius: 7,
        order: 1,
      },
    ],
  },
  plugins: [tailCalloutPlugin],
  options: {
    responsive: true,
    maintainAspectRatio: false,
    animation: false,
    plugins: {
      title: {
        display: true,
        text: titleText,
        color: t.ink,
        font: { size: titleSize, weight: '500' },
        padding: { top: 8, bottom: 16 },
      },
      legend: {
        labels: { color: t.ink, font: { size: 15 }, boxWidth: 22, padding: 14 },
      },
    },
    scales: {
      x: {
        min: axisMin,
        max: axisMax,
        title: { display: true, text: 'Theoretical Quantiles', color: t.ink, font: { size: 16 } },
        ticks: { color: t.inkSoft, font: { size: 13 } },
        grid: { color: t.grid },
        border: { color: t.inkSoft },
      },
      y: {
        min: axisMin,
        max: axisMax,
        title: { display: true, text: 'Sample Quantiles', color: t.ink, font: { size: 16 } },
        ticks: { color: t.inkSoft, font: { size: 13 } },
        grid: { color: t.grid },
        border: { color: t.inkSoft },
      },
    },
  },
});
Runnable source as JSON, for any HTTP client: https://api.anyplot.ai/specs/qq-basic/chartjs/code. Any spec id and library id listed in llms-full.txt fit the same URL shape; every URL below is complete and callable.
{
  "spec_id": "qq-basic",
  "language": "javascript",
  "library": "chartjs",
  "page": "https://anyplot.ai/qq-basic/javascript/chartjs",
  "hub": "https://anyplot.ai/qq-basic",
  "code_json": "https://api.anyplot.ai/specs/qq-basic/chartjs/code",
  "spec_json": "https://api.anyplot.ai/specs/qq-basic",
  "render_light_png": "https://storage.googleapis.com/anyplot-images/plots/qq-basic/javascript/chartjs/plot-light.png",
  "render_dark_png": "https://storage.googleapis.com/anyplot-images/plots/qq-basic/javascript/chartjs/plot-dark.png",
  "interactive_light_html": "https://storage.googleapis.com/anyplot-images/plots/qq-basic/javascript/chartjs/plot-light.html",
  "interactive_dark_html": "https://storage.googleapis.com/anyplot-images/plots/qq-basic/javascript/chartjs/plot-dark.html",
  "quality_score": 92.0,
  "license": "MIT",
  "guide": "https://anyplot.ai/llms.txt"
}
Part of Basic Q-Q Plot on anyplot.ai.