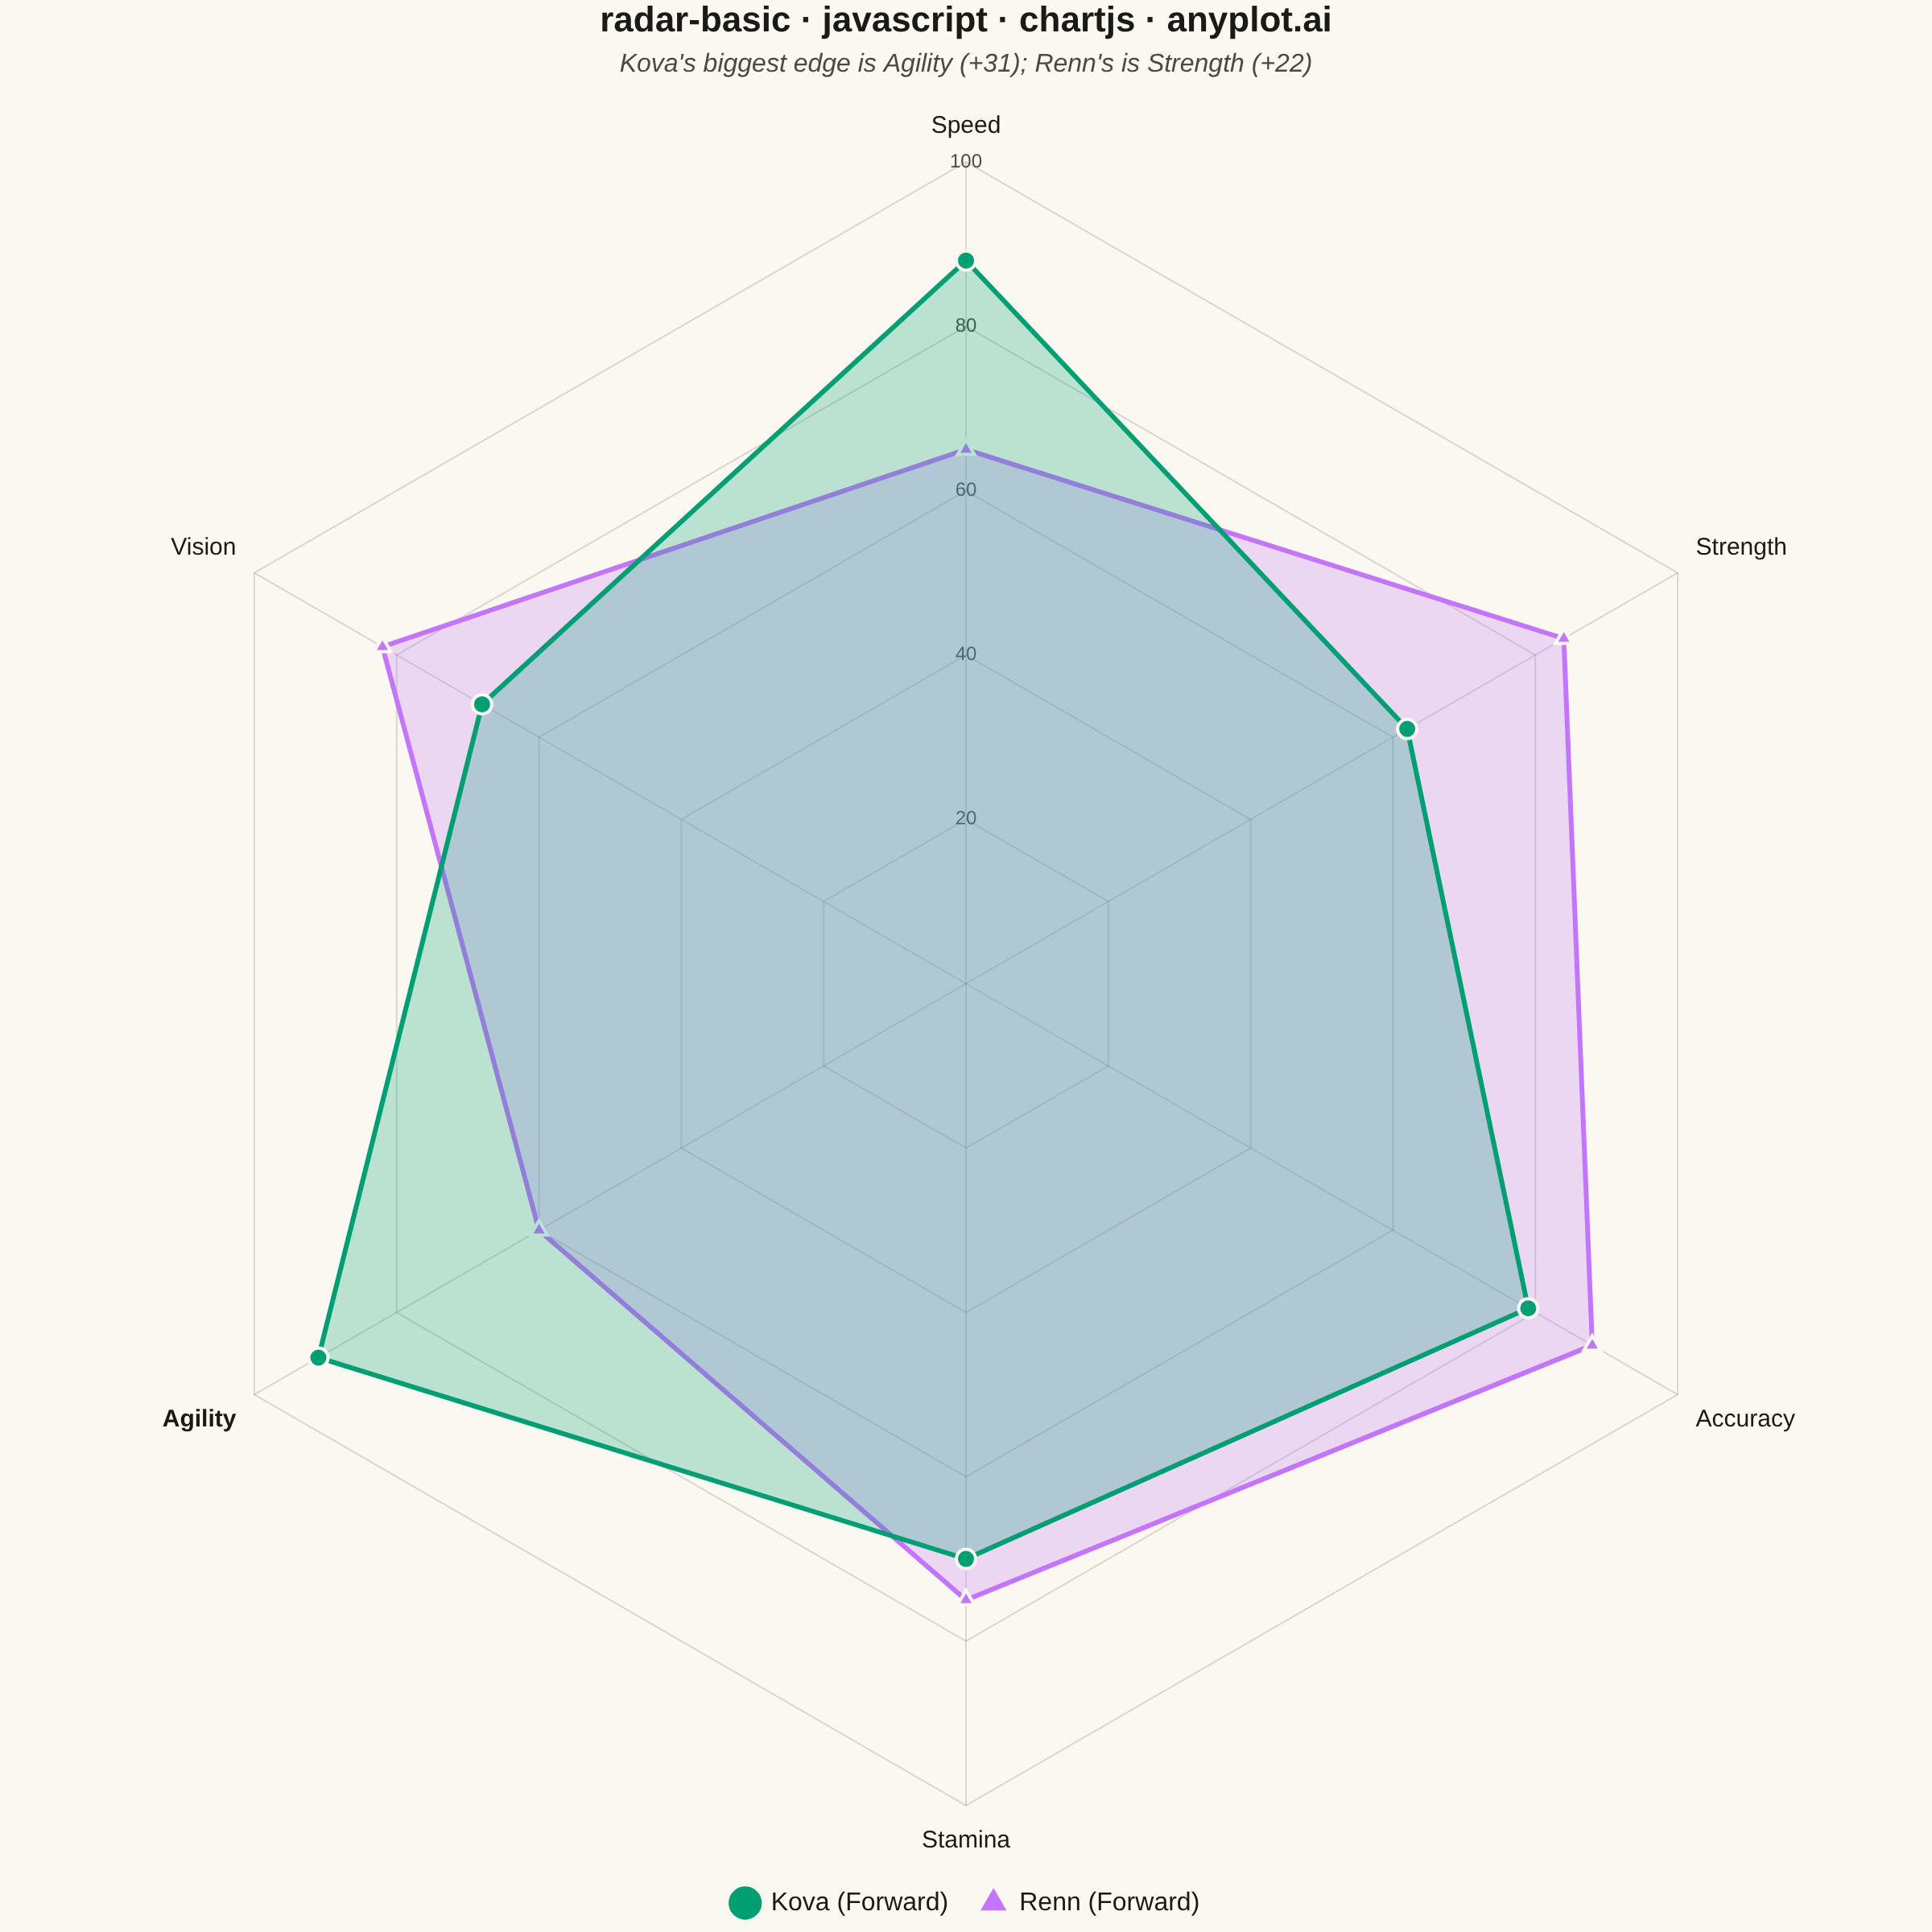
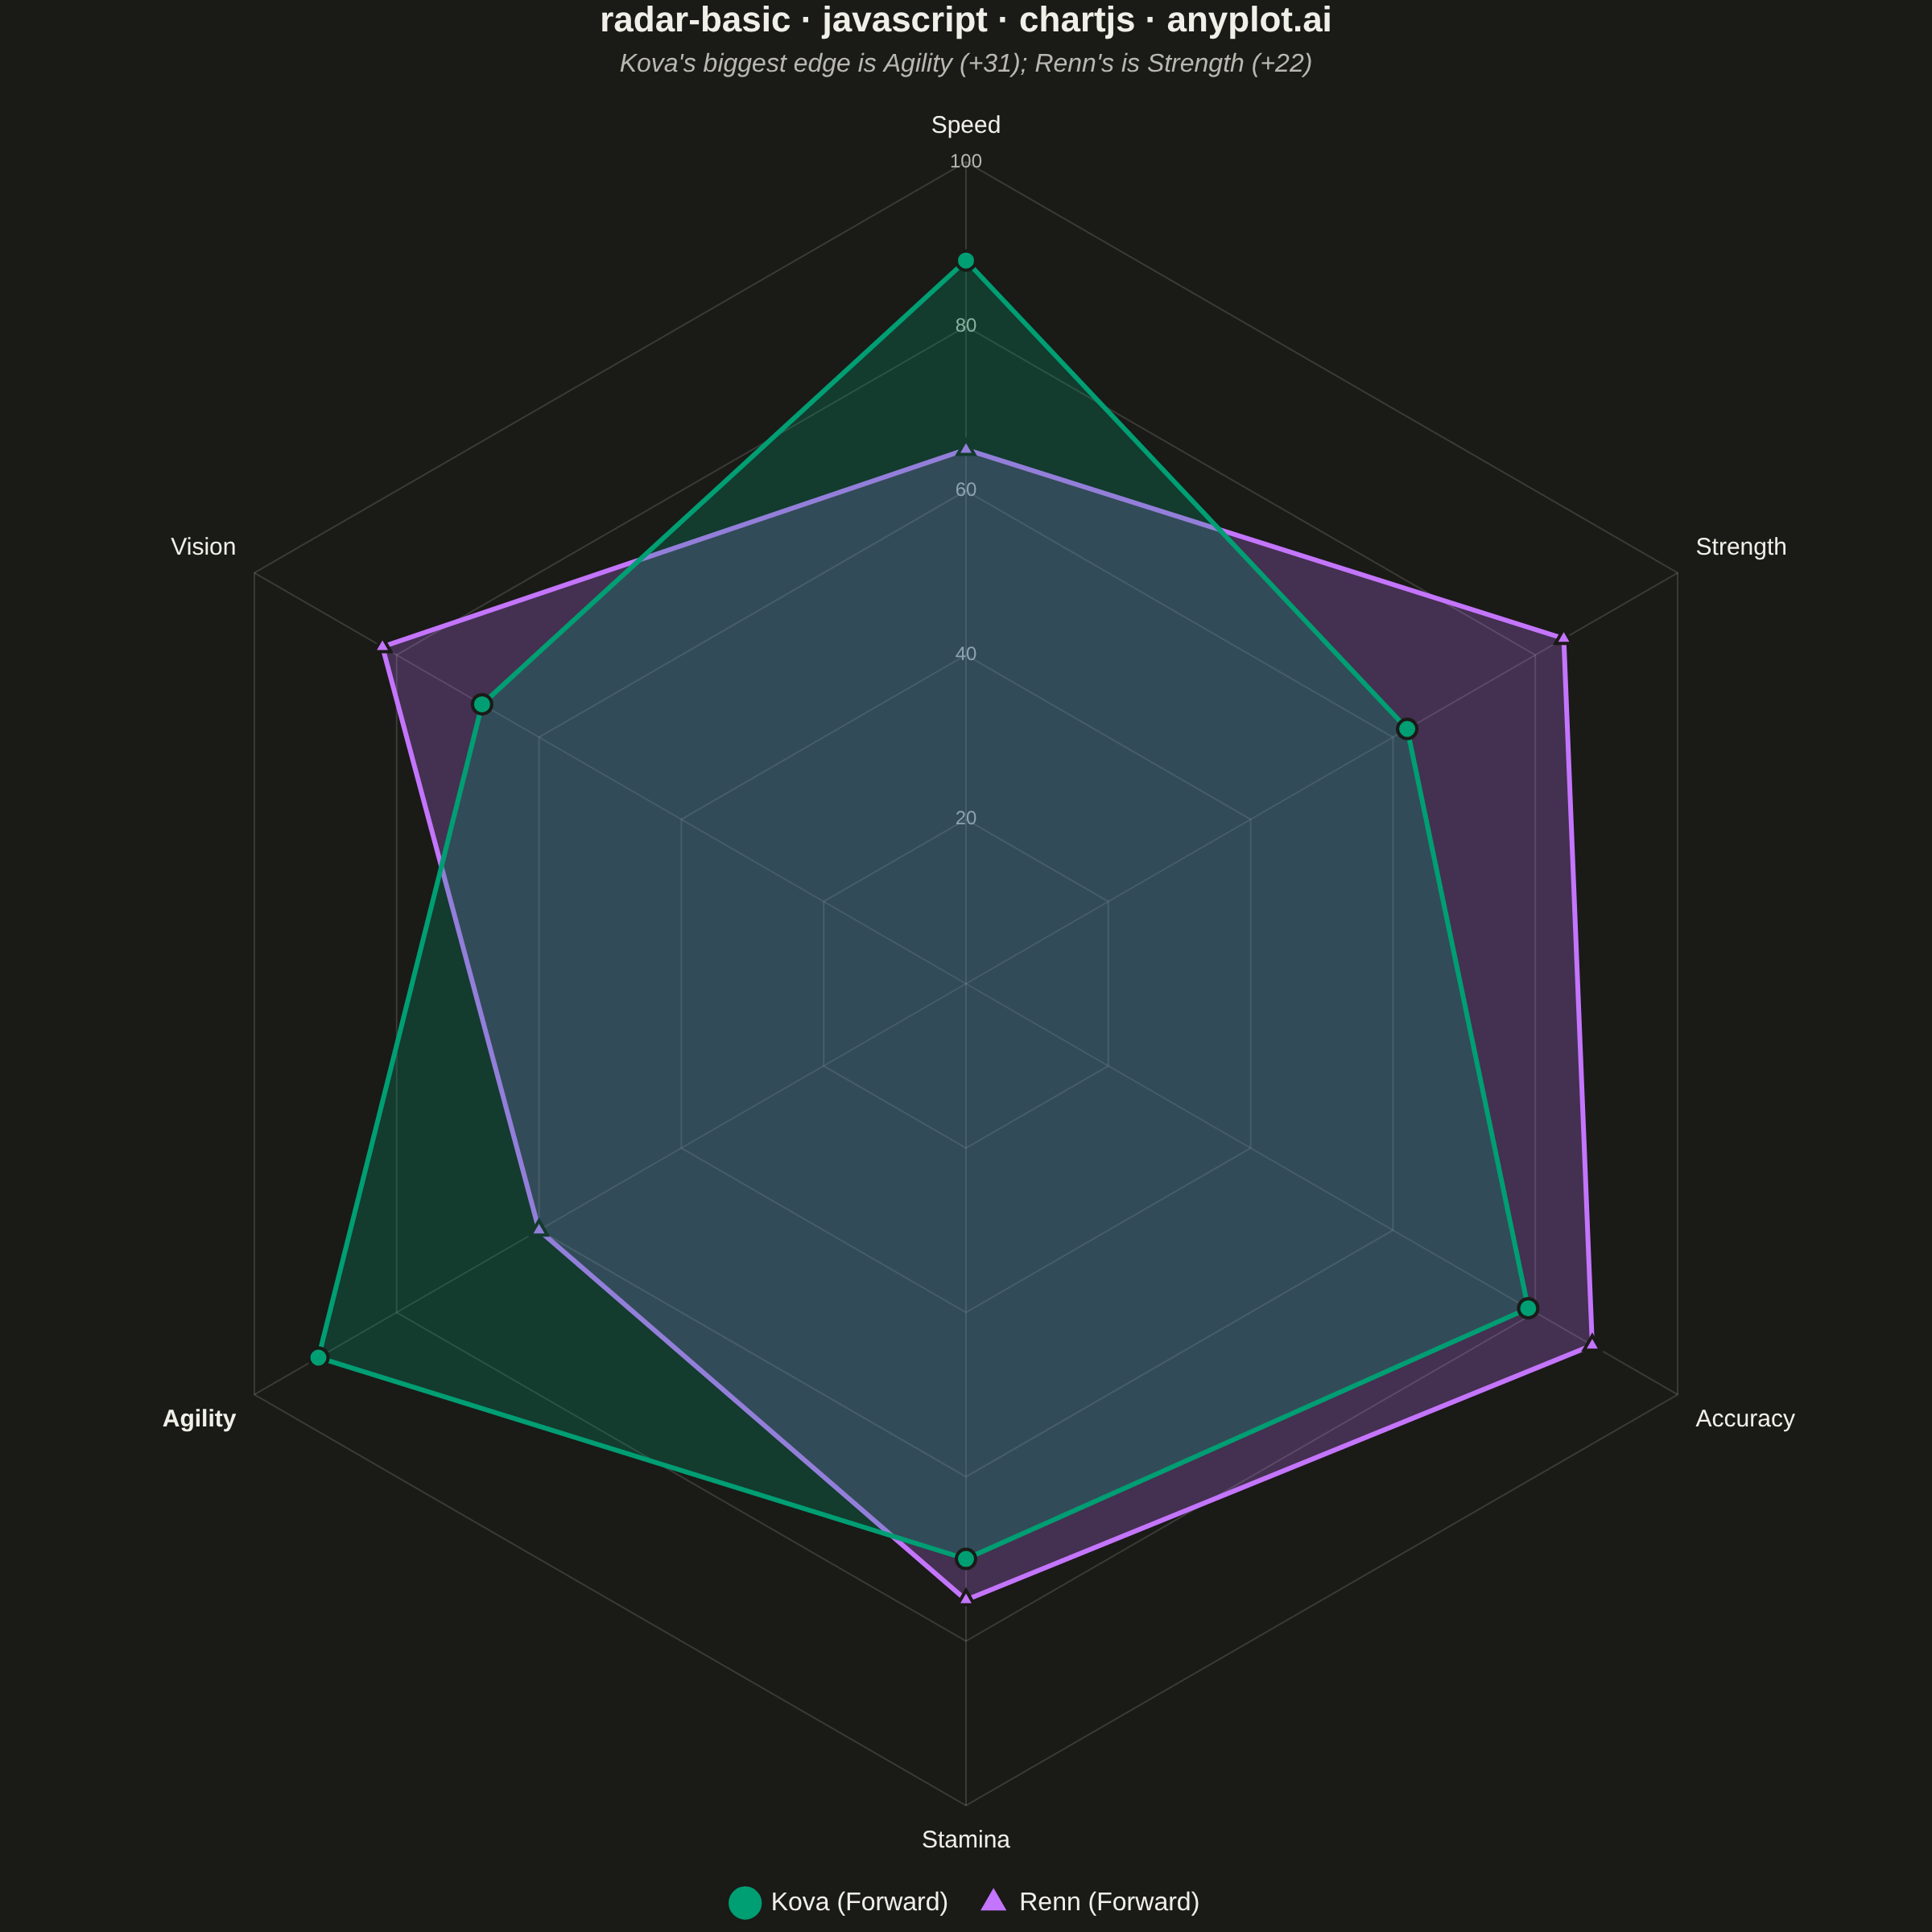
The same plot in 14 other libraries — JavaScript: D3.js, Apache ECharts, Highcharts, MUI X Charts; Python: Altair, Bokeh, lets-plot, Matplotlib, Plotly, plotnine, Pygal, Seaborn; R: ggplot2; Julia: Makie.jl. Compare all 15 side by side: Basic Radar Chart in Python, R, Julia and JavaScript.
A radar chart (also known as spider or web chart) displays multivariate data on axes starting from a common center point, with values connected to form a polygon. Each axis represents a different variable, making it ideal for comparing multiple quantitative variables at once or visualizing strengths and weaknesses across categories.
// anyplot.ai
// radar-basic: Basic Radar Chart
// Library: chartjs 4.4.7 | JavaScript 22.23.1
// Quality: 93/100 | Created: 2026-07-24

//# anyplot-orientation: square
const t = window.ANYPLOT_TOKENS;

// --- Data (in-memory, deterministic) ----------------------------------------
// Sports player statistics: two forwards compared across six attributes.
const attributes = [
  "Speed",
  "Strength",
  "Accuracy",
  "Stamina",
  "Agility",
  "Vision",
];
const playerA = [88, 62, 79, 70, 91, 68];
const playerB = [65, 84, 88, 75, 60, 82];

// --- Mount -------------------------------------------------------------------
const canvas = document.createElement("canvas");
document.getElementById("container").appendChild(canvas);

// --- Chart ---------------------------------------------------------------
new Chart(canvas, {
  type: "radar",
  data: {
    labels: attributes,
    datasets: [
      {
        label: "Kova (Forward)",
        data: playerA,
        borderColor: t.palette[0],
        backgroundColor: `${t.palette[0]}40`,
        borderWidth: 3,
        pointBackgroundColor: t.palette[0],
        pointBorderColor: t.pageBg,
        pointBorderWidth: 2,
        pointRadius: 6,
        pointStyle: "circle",
      },
      {
        label: "Renn (Forward)",
        data: playerB,
        borderColor: t.palette[1],
        backgroundColor: `${t.palette[1]}40`,
        borderWidth: 3,
        pointBackgroundColor: t.palette[1],
        pointBorderColor: t.pageBg,
        pointBorderWidth: 2,
        pointRadius: 6,
        pointStyle: "triangle",
      },
    ],
  },
  options: {
    responsive: true,
    maintainAspectRatio: false,
    animation: false,
    plugins: {
      title: {
        display: true,
        text: "radar-basic · javascript · chartjs · anyplot.ai",
        color: t.ink,
        font: { size: 22 },
        padding: { bottom: 4 },
      },
      subtitle: {
        display: true,
        text: "Kova's biggest edge is Agility (+31); Renn's is Strength (+22)",
        color: t.inkSoft,
        font: { size: 16, style: "italic" },
        padding: { bottom: 20 },
      },
      legend: {
        position: "bottom",
        labels: {
          color: t.ink,
          font: { size: 16 },
          padding: 20,
          usePointStyle: true,
        },
      },
    },
    scales: {
      r: {
        min: 0,
        max: 100,
        ticks: {
          stepSize: 20,
          color: t.inkSoft,
          font: { size: 12 },
          backdropColor: "transparent",
        },
        grid: { color: t.grid },
        angleLines: { color: t.grid },
        pointLabels: {
          color: t.ink,
          font: (ctx) => ({
            size: 15,
            weight: attributes[ctx.index] === "Agility" ? "bold" : "normal",
          }),
        },
      },
    },
  },
});
Runnable source as JSON, for any HTTP client: https://api.anyplot.ai/specs/radar-basic/chartjs/code. Any spec id and library id listed in llms-full.txt fit the same URL shape; every URL below is complete and callable.
{
  "spec_id": "radar-basic",
  "language": "javascript",
  "library": "chartjs",
  "page": "https://anyplot.ai/radar-basic/javascript/chartjs",
  "hub": "https://anyplot.ai/radar-basic",
  "code_json": "https://api.anyplot.ai/specs/radar-basic/chartjs/code",
  "spec_json": "https://api.anyplot.ai/specs/radar-basic",
  "render_light_png": "https://storage.googleapis.com/anyplot-images/plots/radar-basic/javascript/chartjs/plot-light.png",
  "render_dark_png": "https://storage.googleapis.com/anyplot-images/plots/radar-basic/javascript/chartjs/plot-dark.png",
  "interactive_light_html": "https://storage.googleapis.com/anyplot-images/plots/radar-basic/javascript/chartjs/plot-light.html",
  "interactive_dark_html": "https://storage.googleapis.com/anyplot-images/plots/radar-basic/javascript/chartjs/plot-dark.html",
  "quality_score": 93.0,
  "license": "MIT",
  "guide": "https://anyplot.ai/llms.txt"
}
Part of Basic Radar Chart on anyplot.ai.