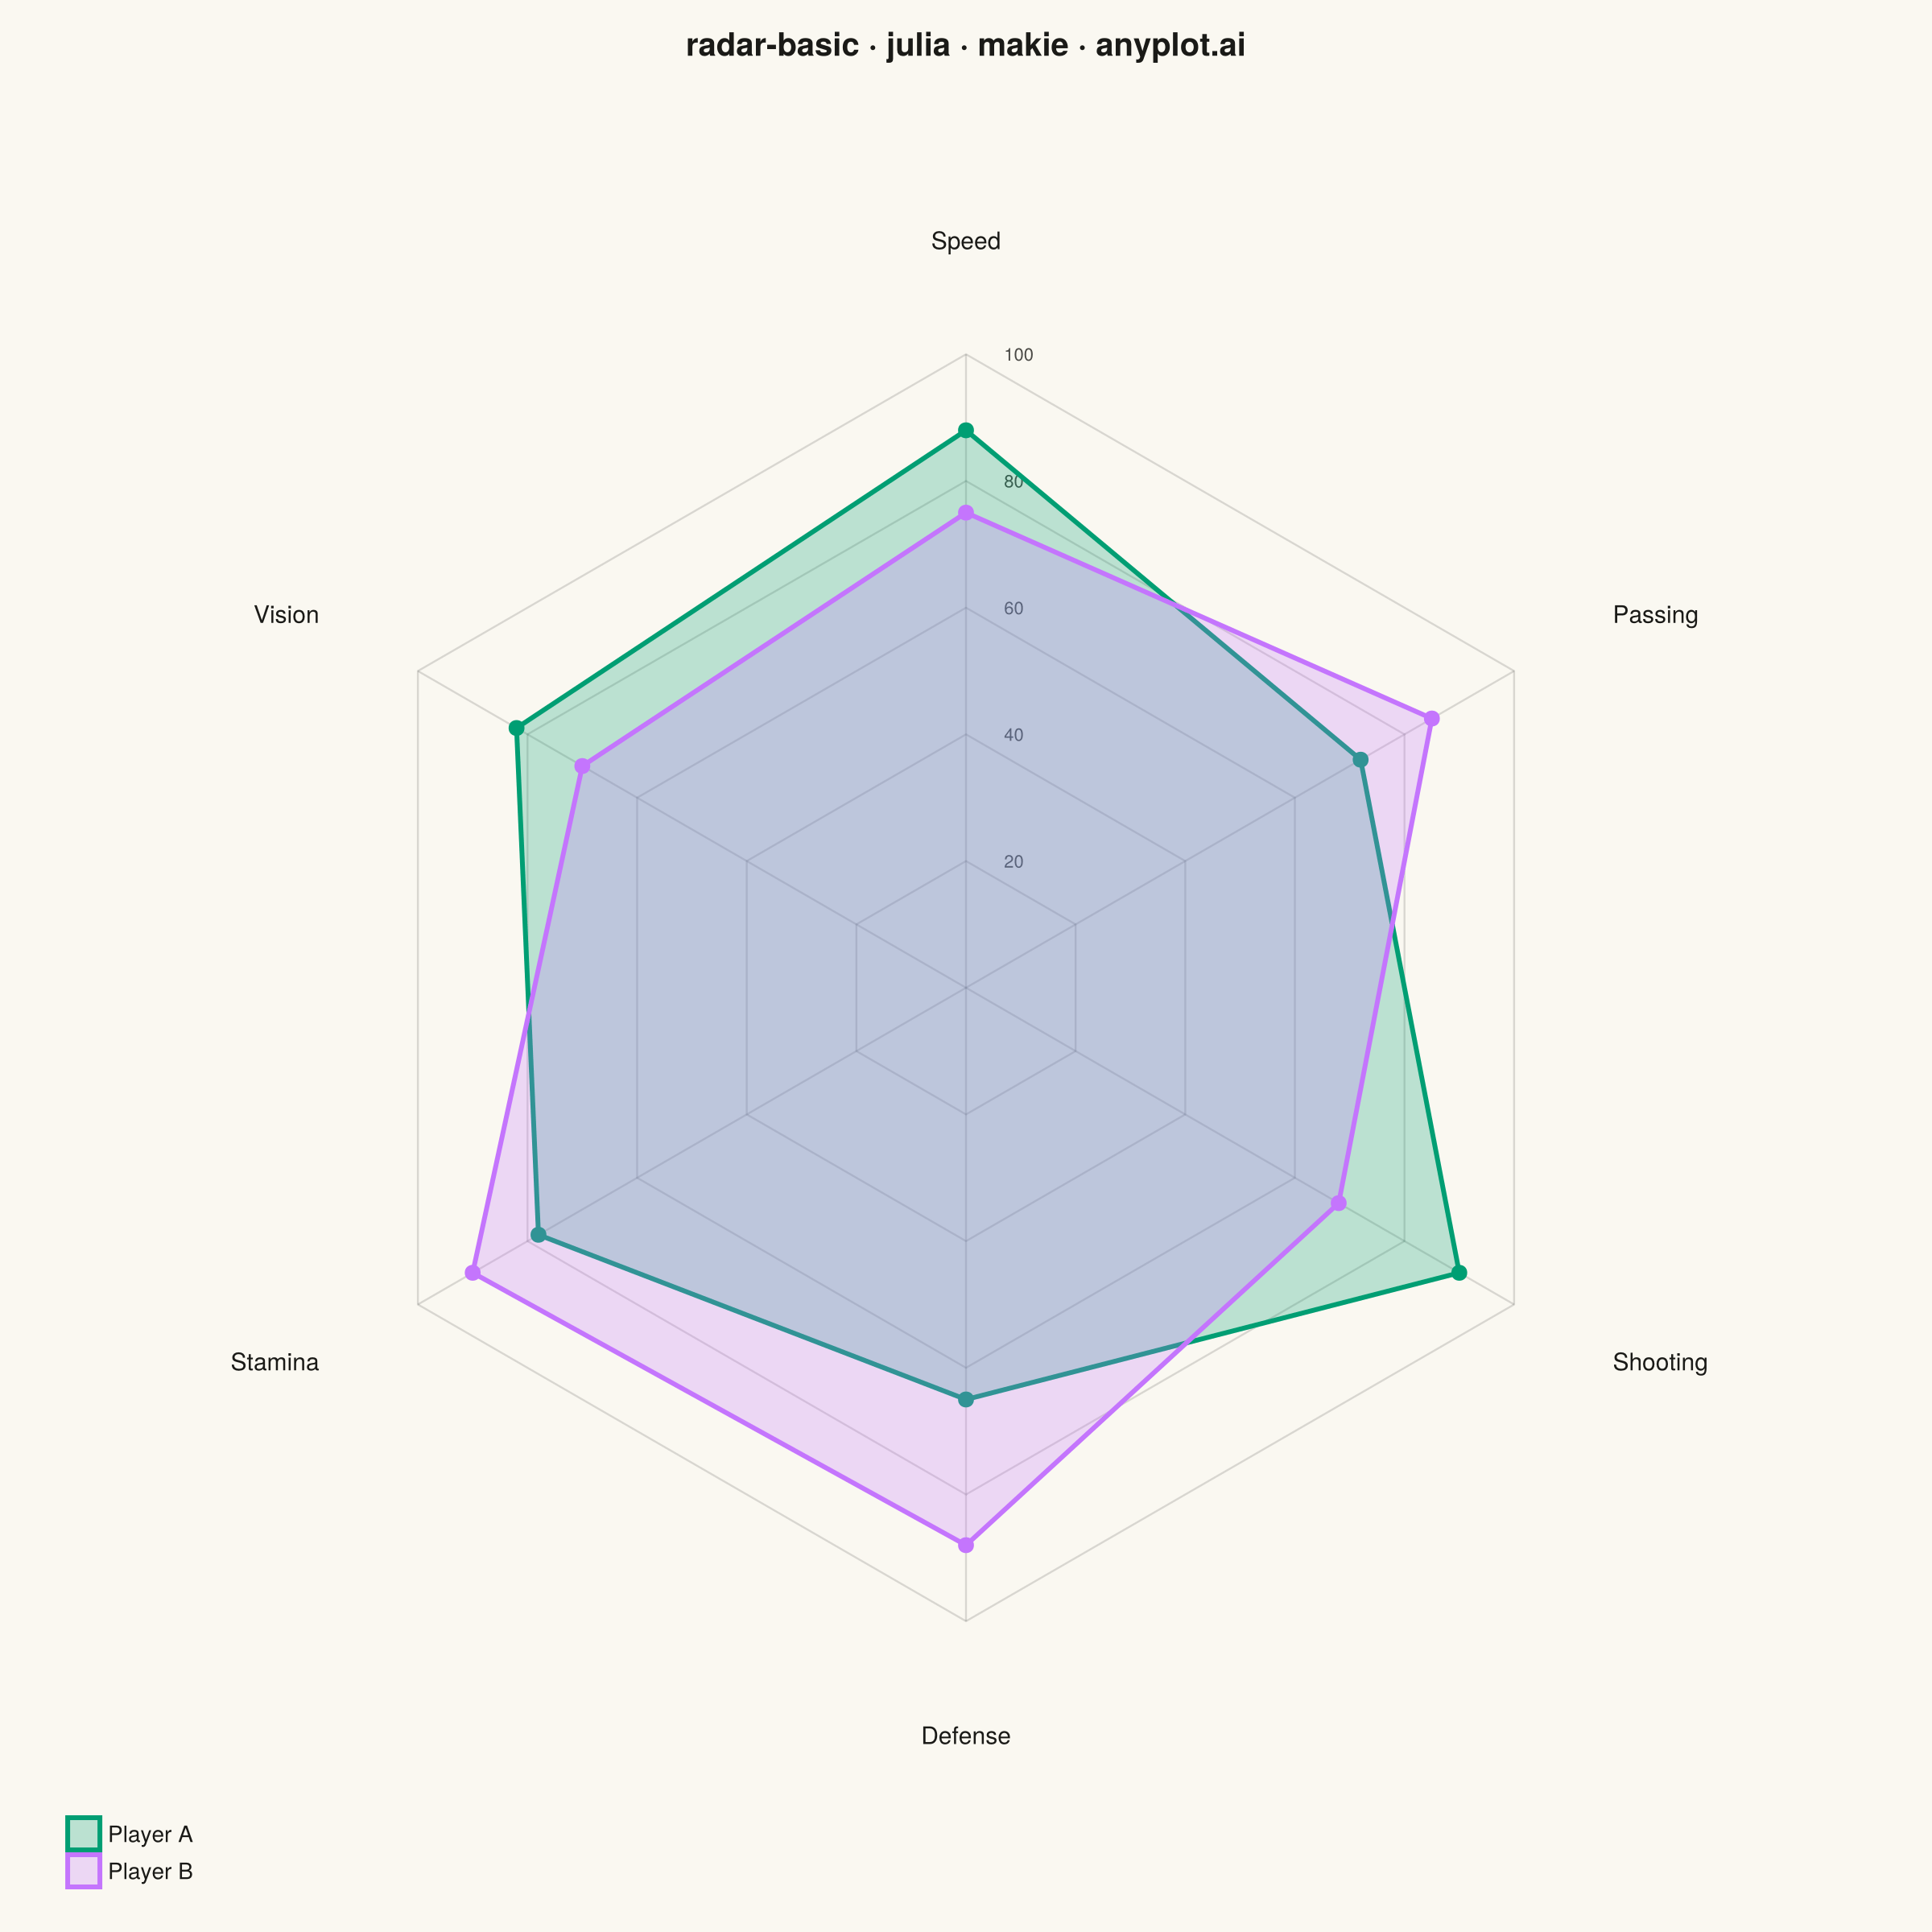
The same plot in 14 other libraries — Python: Altair, Bokeh, lets-plot, Matplotlib, Plotly, plotnine, Pygal, Seaborn; R: ggplot2; JavaScript: Chart.js, D3.js, Apache ECharts, Highcharts, MUI X Charts. Compare all 15 side by side: Basic Radar Chart in Python, R, Julia and JavaScript.
A radar chart (also known as spider or web chart) displays multivariate data on axes starting from a common center point, with values connected to form a polygon. Each axis represents a different variable, making it ideal for comparing multiple quantitative variables at once or visualizing strengths and weaknesses across categories.
# anyplot.ai
# radar-basic: Basic Radar Chart
# Library: makie 0.21.9 | Julia 1.11.9
# Quality: 87/100 | Created: 2026-07-24

using CairoMakie
using Colors

# --- Theme tokens -----------------------------------------------------------
const THEME    = get(ENV, "ANYPLOT_THEME", "light")
const PAGE_BG  = THEME == "light" ? colorant"#FAF8F1" : colorant"#1A1A17"
const INK      = THEME == "light" ? colorant"#1A1A17" : colorant"#F0EFE8"
const INK_SOFT = THEME == "light" ? colorant"#4A4A44" : colorant"#B8B7B0"
const GRID     = RGBAf(INK.r, INK.g, INK.b, 0.15)
const IMPRINT_PALETTE = [
    colorant"#009E73",  # 1 — first categorical series (anyplot brand green)
    colorant"#C475FD",  # 2 — lavender (second series)
]

# --- Data ---------------------------------------------------------------
# Two soccer players compared across six performance attributes (0-100 scale)
categories = ["Speed", "Passing", "Shooting", "Defense", "Stamina", "Vision"]
player_a = [88.0, 72.0, 90.0, 65.0, 78.0, 82.0]
player_b = [75.0, 85.0, 68.0, 88.0, 90.0, 70.0]

n = length(categories)
angles = [pi / 2 - 2 * pi * (i - 1) / n for i in 1:n]
grid_levels = [20, 40, 60, 80, 100]

# Largest gap between the two players — used to anchor a focal-point annotation
gaps = abs.(player_a .- player_b)
focus_idx = argmax(gaps)
focus_angle = angles[focus_idx]
focus_lo, focus_hi = extrema((player_a[focus_idx], player_b[focus_idx]))

# --- Plot -----------------------------------------------------------------
fig = Figure(
    size            = (1200, 1200),
    fontsize        = 14,
    backgroundcolor = PAGE_BG,
)

ax = Axis(
    fig[1, 1];
    title           = "radar-basic · julia · makie · anyplot.ai",
    titlesize       = 20,
    titlecolor      = INK,
    aspect          = DataAspect(),
    backgroundcolor = PAGE_BG,
)
hidedecorations!(ax)
hidespines!(ax)
limits!(ax, -145, 145, -134, 148)

# Concentric gridline polygons at 20/40/60/80/100
for level in grid_levels
    xs = [level * cos(a) for a in angles]
    ys = [level * sin(a) for a in angles]
    lines!(ax, [xs; xs[1]], [ys; ys[1]]; color = GRID, linewidth = 1.2)
end

# Radial spokes, one per category
for a in angles
    lines!(ax, [0.0, 100 * cos(a)], [0.0, 100 * sin(a)]; color = GRID, linewidth = 1.2)
end

# Gridline value labels along the top spoke
for level in grid_levels
    text!(ax, 6, Float64(level); text = string(level), fontsize = 13,
          color = INK_SOFT, align = (:left, :center), font = :bold)
end

# Category labels at the outer edge
label_radius = 118
for (i, cat) in enumerate(categories)
    a = angles[i]
    halign = cos(a) > 0.3 ? :left : (cos(a) < -0.3 ? :right : :center)
    text!(ax, label_radius * cos(a), label_radius * sin(a); text = cat,
          fontsize = 15, color = INK, align = (halign, :center))
end

# Series polygons — filled with transparency, closed back to the first point
for (values, color, name) in (
    (player_a, IMPRINT_PALETTE[1], "Player A"),
    (player_b, IMPRINT_PALETTE[2], "Player B"),
)
    xs = [v * cos(a) for (v, a) in zip(values, angles)]
    ys = [v * sin(a) for (v, a) in zip(values, angles)]
    poly!(ax, Point2f.([xs; xs[1]], [ys; ys[1]]);
          color = (color, 0.25), strokecolor = color, strokewidth = 3, label = name)
    scatter!(ax, xs, ys; color = color, markersize = 14, strokewidth = 0)
end

# Focal-point annotation: bracket the widest gap between the two players
bracket!(
    ax,
    focus_lo * cos(focus_angle), focus_lo * sin(focus_angle),
    focus_hi * cos(focus_angle), focus_hi * sin(focus_angle);
    text = "largest gap · $(round(Int, gaps[focus_idx])) pts",
    fontsize = 13,
    color = INK_SOFT,
    textcolor = INK,
    offset = 14,
    orientation = :down,
    style = :curly,
)

axislegend(ax, position = :lb, labelsize = 14, labelcolor = INK,
           framevisible = false, backgroundcolor = (PAGE_BG, 0.0))

# --- Save -------------------------------------------------------------------
save("plot-$(THEME).png", fig; px_per_unit = 2)
Runnable source as JSON, for any HTTP client: https://api.anyplot.ai/specs/radar-basic/makie/code. Any spec id and library id listed in llms-full.txt fit the same URL shape; every URL below is complete and callable.
{
  "spec_id": "radar-basic",
  "language": "julia",
  "library": "makie",
  "page": "https://anyplot.ai/radar-basic/julia/makie",
  "hub": "https://anyplot.ai/radar-basic",
  "code_json": "https://api.anyplot.ai/specs/radar-basic/makie/code",
  "spec_json": "https://api.anyplot.ai/specs/radar-basic",
  "render_light_png": "https://storage.googleapis.com/anyplot-images/plots/radar-basic/julia/makie/plot-light.png",
  "render_dark_png": "https://storage.googleapis.com/anyplot-images/plots/radar-basic/julia/makie/plot-dark.png",
  "quality_score": 87.0,
  "license": "MIT",
  "guide": "https://anyplot.ai/llms.txt"
}
Part of Basic Radar Chart on anyplot.ai.