The same plot in 14 other libraries — JavaScript: Chart.js, Apache ECharts, Highcharts, MUI X Charts; Python: Altair, Bokeh, lets-plot, Matplotlib, Plotly, plotnine, Pygal, Seaborn; R: ggplot2; Julia: Makie.jl. Compare all 15 side by side: Basic Radar Chart in Python, R, Julia and JavaScript.
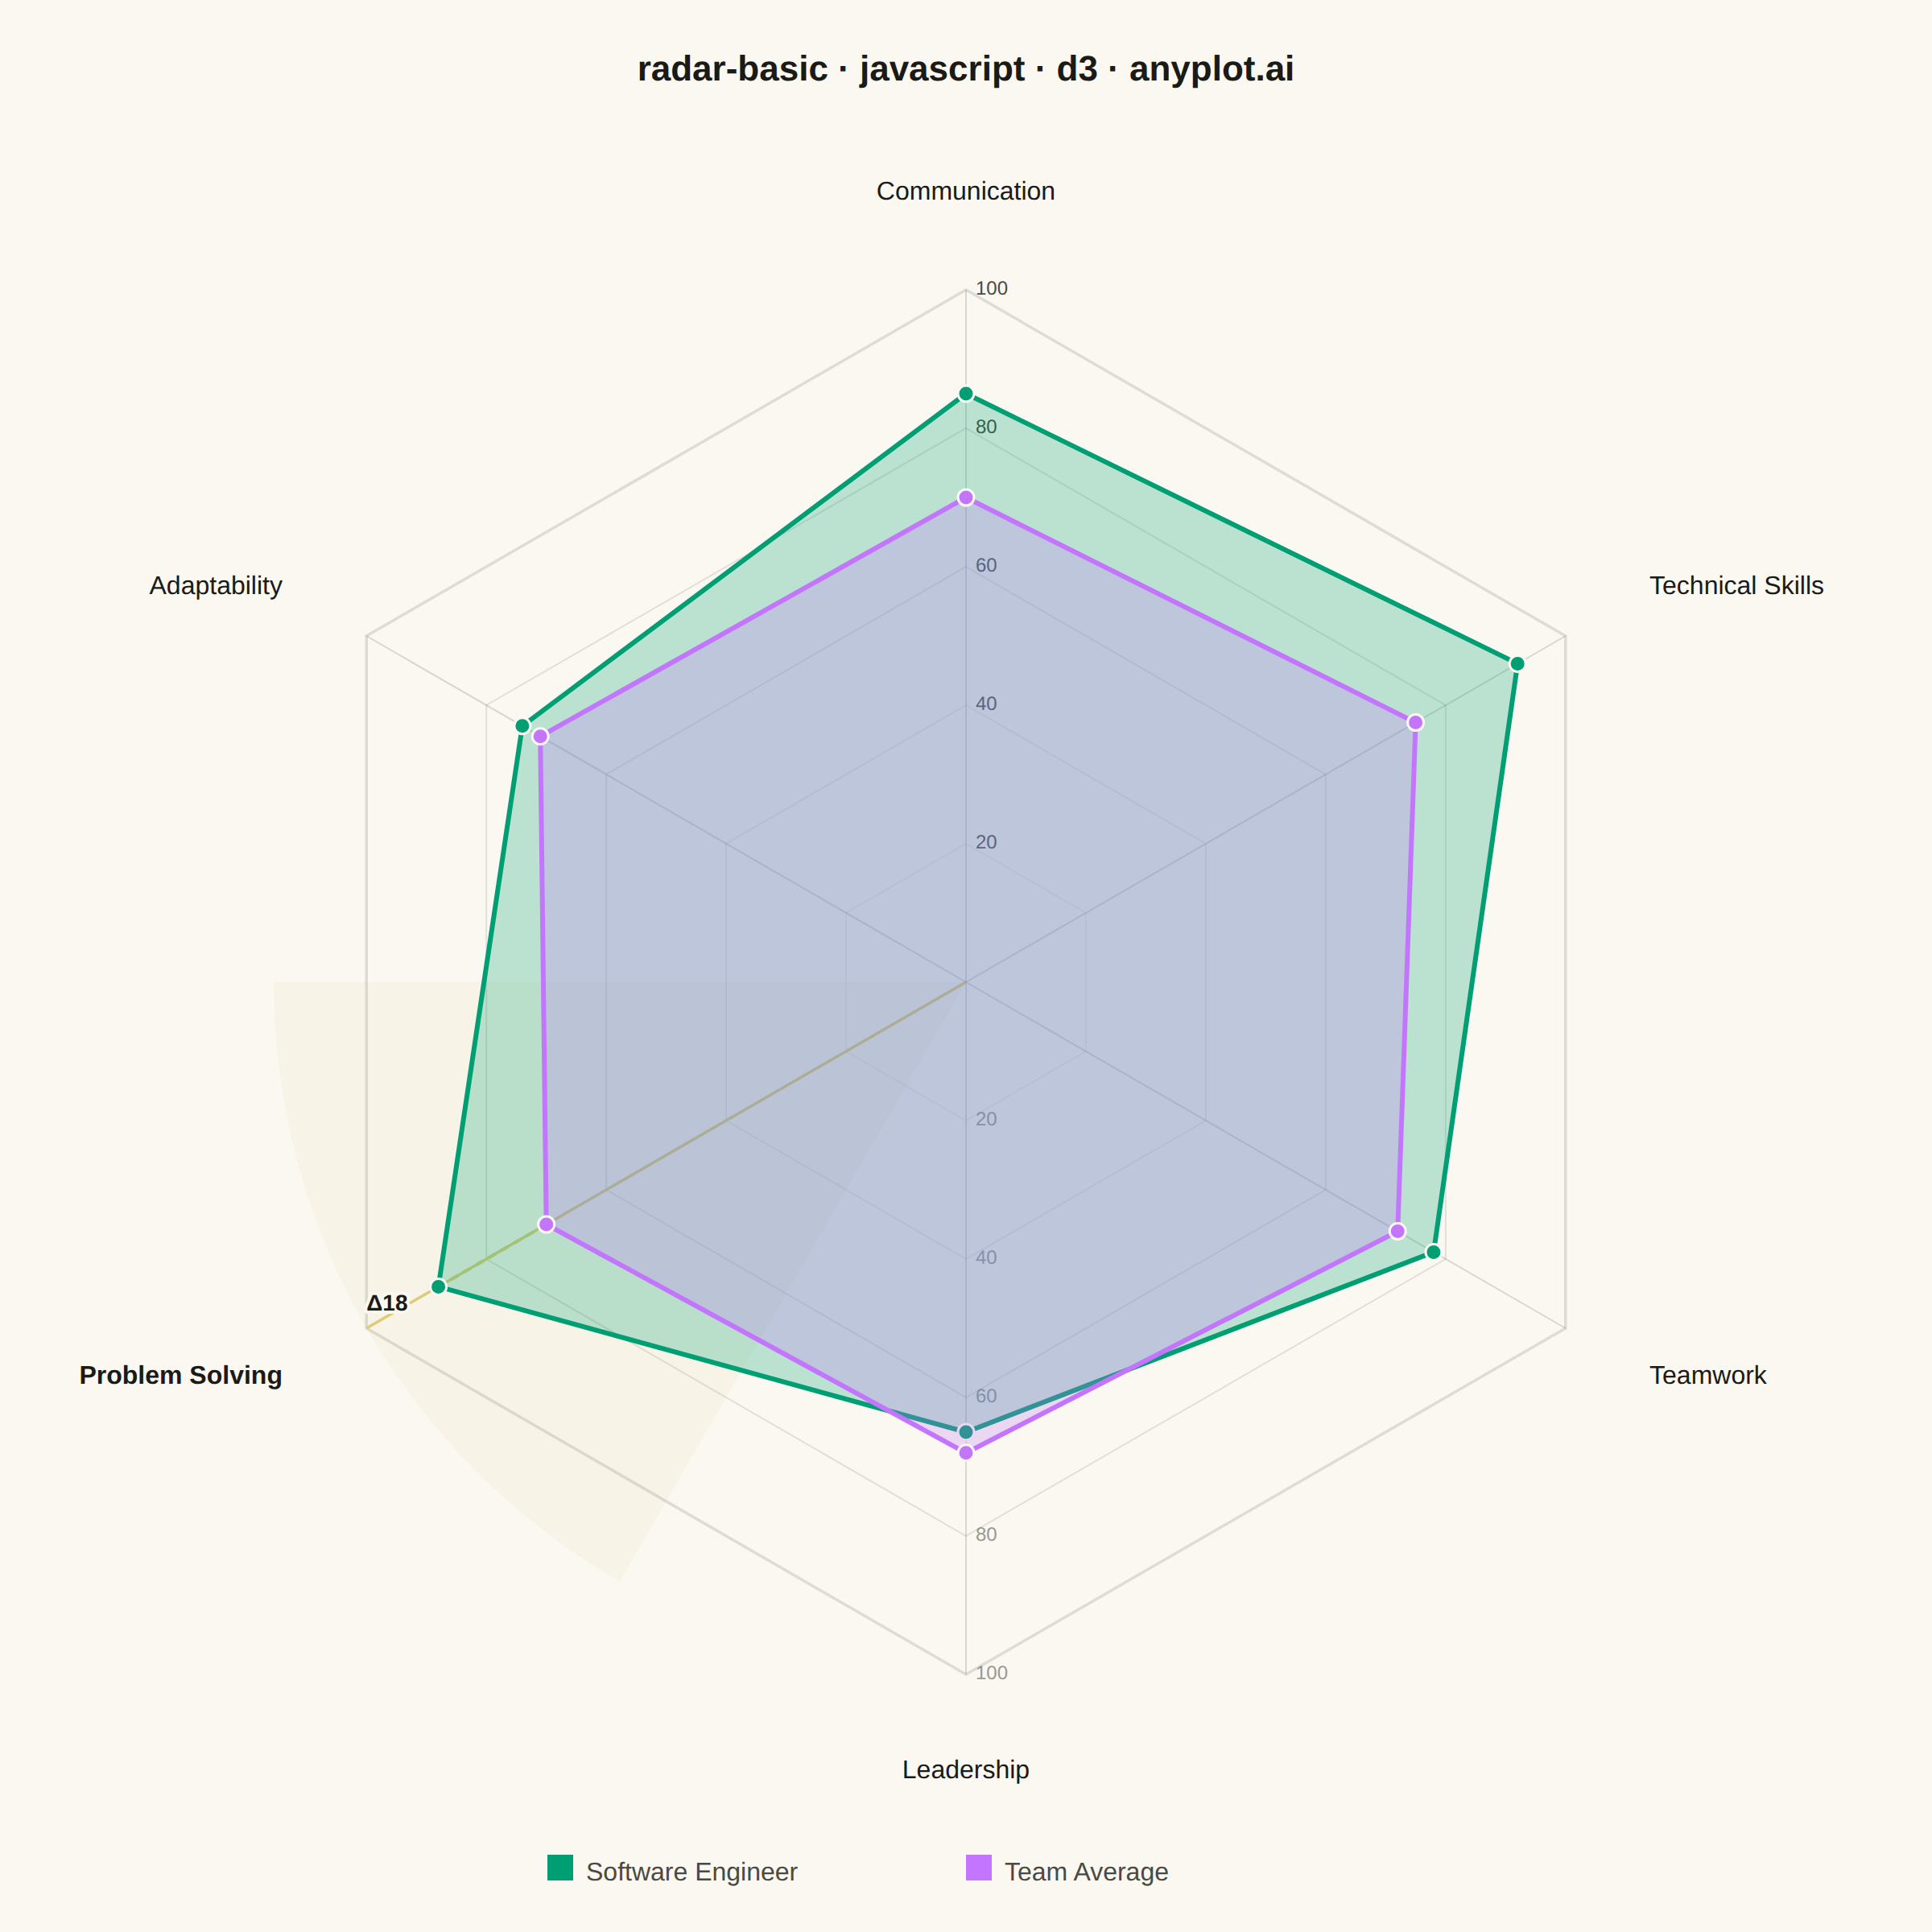
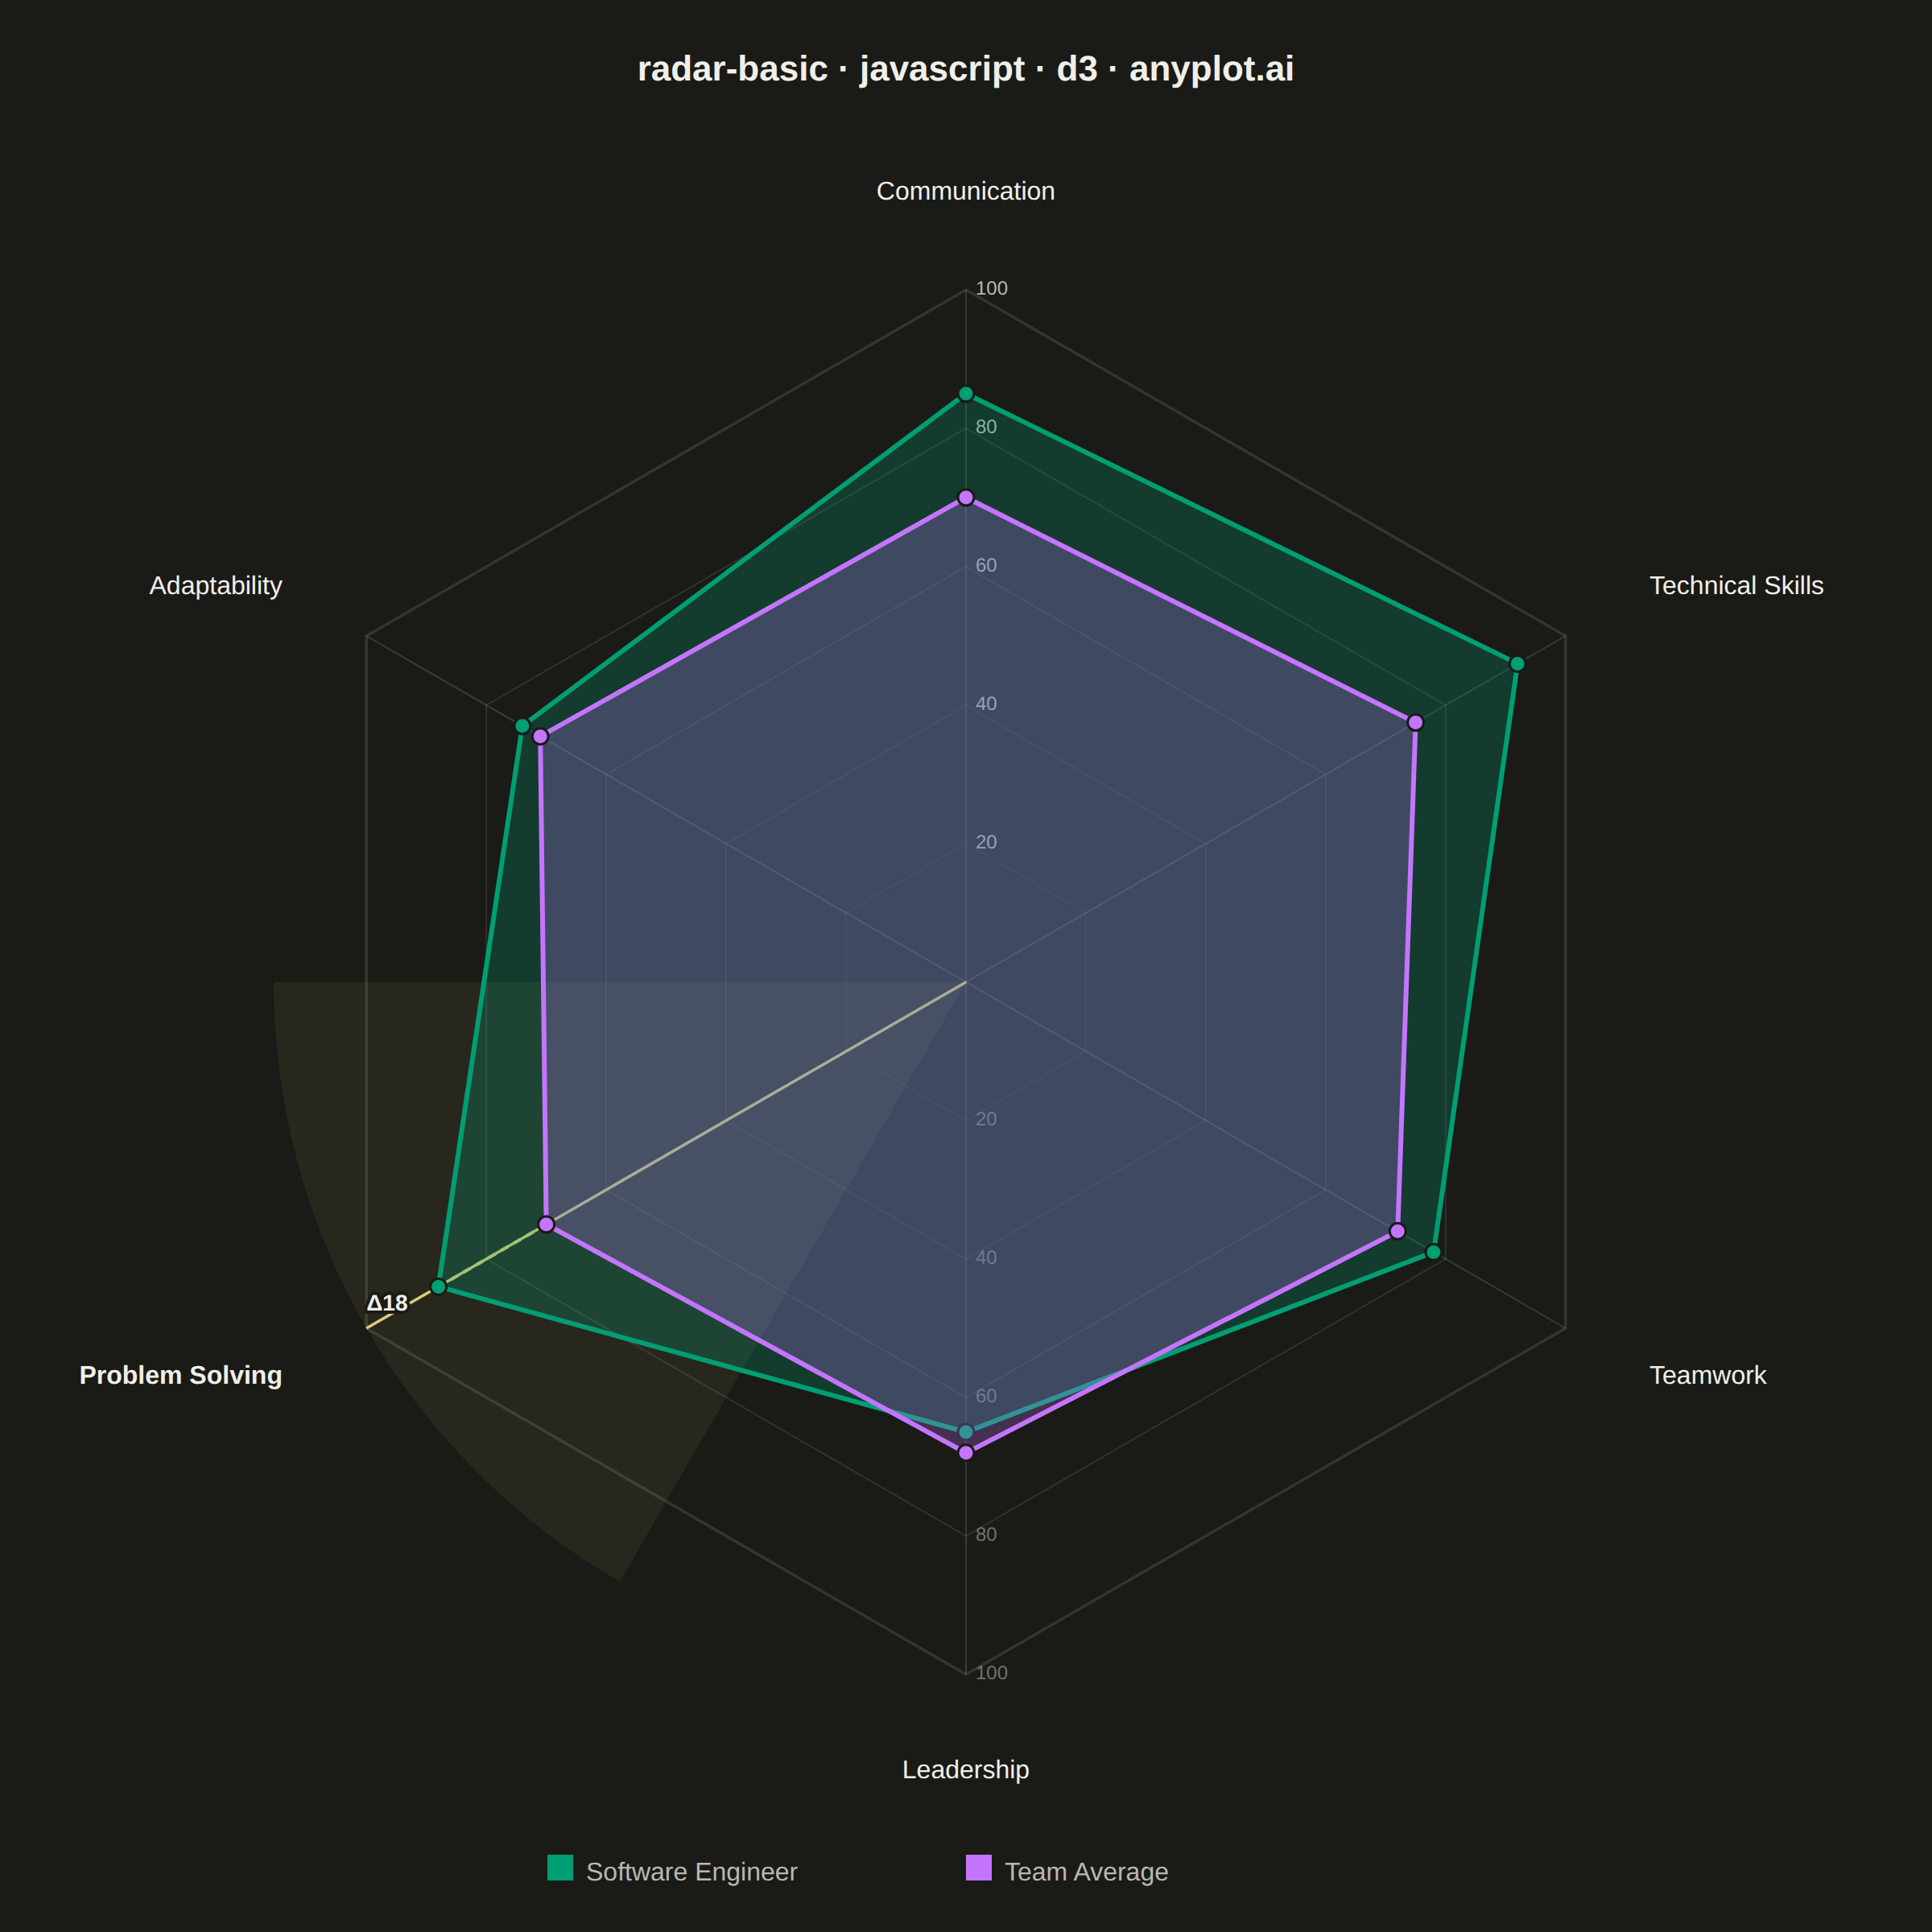
A radar chart (also known as spider or web chart) displays multivariate data on axes starting from a common center point, with values connected to form a polygon. Each axis represents a different variable, making it ideal for comparing multiple quantitative variables at once or visualizing strengths and weaknesses across categories.
// anyplot.ai
// radar-basic: Basic Radar Chart
// Library: d3 7.9.0 | JavaScript 22.23.1
// Quality: 95/100 | Created: 2026-07-24

//# anyplot-orientation: square
const t = window.ANYPLOT_TOKENS;
const { width, height } = window.ANYPLOT_SIZE;

// --- Data (in-memory, deterministic) ----------------------------------------
const categories = [
  "Communication", "Technical Skills", "Teamwork",
  "Leadership", "Problem Solving", "Adaptability",
];
const series = [
  { name: "Software Engineer", values: [85, 92, 78, 65, 88, 74], color: t.palette[0] },
  { name: "Team Average", values: [70, 75, 72, 68, 70, 71], color: t.palette[1] },
];
const maxValue = 100;
const gridLevels = [20, 40, 60, 80, 100];

// Largest cross-series gap — drives the storytelling highlight below.
const gaps = categories.map((_, i) => {
  const vals = series.map((s) => s.values[i]);
  return Math.max(...vals) - Math.min(...vals);
});
const maxGapIndex = gaps.indexOf(Math.max(...gaps));
const gapVals = series.map((s) => s.values[maxGapIndex]);
const gapHigh = Math.max(...gapVals);
const gapLow = Math.min(...gapVals);

// --- Layout ------------------------------------------------------------------
const titleSpace = 90;
const legendSpace = 70;
const cx = width / 2;
const cy = titleSpace + (height - titleSpace - legendSpace) / 2;
const radius = Math.min(width, height - titleSpace - legendSpace) / 2 - 90;
const angleSlice = (2 * Math.PI) / categories.length;
const rScale = d3.scaleLinear().domain([0, maxValue]).range([0, radius]);

const angleFor = (i) => i * angleSlice - Math.PI / 2;
const point = (i, value) => {
  const a = angleFor(i);
  return [cx + rScale(value) * Math.cos(a), cy + rScale(value) * Math.sin(a)];
};
const anchorFor = (i) => {
  const cos = Math.cos(angleFor(i));
  return cos > 0.15 ? "start" : cos < -0.15 ? "end" : "middle";
};

// --- SVG mount ----------------------------------------------------------------
const svg = d3.select("#container").append("svg").attr("width", width).attr("height", height);

// --- Storytelling highlight: shade the sector with the largest series gap ----
const gapArc = d3.arc()
  .innerRadius(0)
  .outerRadius(radius)
  .startAngle((maxGapIndex - 0.5) * angleSlice)
  .endAngle((maxGapIndex + 0.5) * angleSlice);

svg.append("path")
  .attr("transform", `translate(${cx},${cy})`)
  .attr("d", gapArc())
  .attr("fill", t.amber)
  .attr("fill-opacity", 0.08);

// --- Grid: concentric webs with visual hierarchy (outer ring emphasized) -----
const ringOpacity = d3.scaleLinear().domain([d3.min(gridLevels), d3.max(gridLevels)]).range([0.35, 0.85]);

svg.selectAll(".grid-ring")
  .data(gridLevels)
  .join("polygon")
  .attr("class", "grid-ring")
  .attr("points", (level) => categories.map((_, i) => point(i, level).join(",")).join(" "))
  .attr("fill", "none")
  .attr("stroke", t.grid)
  .attr("stroke-width", (level) => (level === maxValue ? 1.75 : 1))
  .attr("stroke-opacity", ringOpacity);

// --- Spokes (largest-gap axis emphasized in amber) ----------------------------
svg.selectAll(".spoke")
  .data(categories)
  .join("line")
  .attr("class", "spoke")
  .attr("x1", cx).attr("y1", cy)
  .attr("x2", (_, i) => point(i, maxValue)[0])
  .attr("y2", (_, i) => point(i, maxValue)[1])
  .attr("stroke", (_, i) => (i === maxGapIndex ? t.amber : t.grid))
  .attr("stroke-width", (_, i) => (i === maxGapIndex ? 1.75 : 1));

// --- Radial scale reference on two opposite spokes (top + bottom) ------------
const referenceAxes = [
  { index: 0, opacity: 1 },
  { index: Math.floor(categories.length / 2), opacity: 0.55 },
];
referenceAxes.forEach(({ index, opacity }) => {
  svg.selectAll(`.tick-label-${index}`)
    .data(gridLevels)
    .join("text")
    .attr("class", `tick-label-${index}`)
    .attr("x", (level) => point(index, level)[0] + 6)
    .attr("y", (level) => point(index, level)[1])
    .attr("fill", t.inkSoft)
    .attr("dominant-baseline", "middle")
    .attr("opacity", opacity)
    .style("font-size", "12px")
    .text((level) => level);
});

// --- Category axis labels (largest-gap category emphasized) ------------------
svg.selectAll(".cat-label")
  .data(categories)
  .join("text")
  .attr("class", "cat-label")
  .attr("x", (_, i) => point(i, maxValue * 1.14)[0])
  .attr("y", (_, i) => point(i, maxValue * 1.14)[1])
  .attr("text-anchor", (_, i) => anchorFor(i))
  .attr("dominant-baseline", "middle")
  .attr("fill", t.ink)
  .style("font-size", "16px")
  .style("font-weight", (_, i) => (i === maxGapIndex ? "700" : "400"))
  .text((d) => d);

// --- Gap callout: dashed connector + Δ badge on the largest-gap axis ----------
const gapP1 = point(maxGapIndex, gapHigh);
const gapP2 = point(maxGapIndex, gapLow);

svg.append("line")
  .attr("x1", gapP1[0]).attr("y1", gapP1[1])
  .attr("x2", gapP2[0]).attr("y2", gapP2[1])
  .attr("stroke", t.amber)
  .attr("stroke-width", 2)
  .attr("stroke-dasharray", "5,4");

const badgeRadius = rScale(gapHigh) + 22;
const badgeAngle = angleFor(maxGapIndex);
svg.append("text")
  .attr("x", cx + badgeRadius * Math.cos(badgeAngle))
  .attr("y", cy + badgeRadius * Math.sin(badgeAngle))
  .attr("text-anchor", anchorFor(maxGapIndex))
  .attr("dominant-baseline", "middle")
  .style("font-size", "14px")
  .style("font-weight", "700")
  .style("paint-order", "stroke")
  .attr("stroke", t.pageBg)
  .attr("stroke-width", 4)
  .attr("stroke-linejoin", "round")
  .attr("fill", t.ink)
  .text(`Δ${gapHigh - gapLow}`);

// --- Data polygons + point markers (nested data join per series) -------------
const radarLine = d3.line().x((d) => d[0]).y((d) => d[1]).curve(d3.curveLinearClosed);

const seriesGroups = svg.selectAll(".series-group")
  .data(series)
  .join("g")
  .attr("class", "series-group");

seriesGroups.append("path")
  .attr("d", (d) => radarLine(d.values.map((v, i) => point(i, v))))
  .attr("fill", (d) => d.color)
  .attr("fill-opacity", 0.25)
  .attr("stroke", (d) => d.color)
  .attr("stroke-width", 3);

seriesGroups.selectAll("circle")
  .data((d) => d.values.map((v, i) => ({ x: point(i, v)[0], y: point(i, v)[1], color: d.color })))
  .join("circle")
  .attr("cx", (d) => d.x)
  .attr("cy", (d) => d.y)
  .attr("r", 5)
  .attr("fill", (d) => d.color)
  .attr("stroke", t.pageBg)
  .attr("stroke-width", 1.5);

// --- Title ------------------------------------------------------------------
svg.append("text")
  .attr("x", width / 2).attr("y", 50)
  .attr("text-anchor", "middle")
  .attr("fill", t.ink)
  .style("font-size", "22px")
  .style("font-weight", "600")
  .text("radar-basic · javascript · d3 · anyplot.ai");

// --- Legend (nested data join per series) -------------------------------------
const legendY = height - 36;
const legendItemWidth = 260;
const legendStartX = width / 2 - (series.length * legendItemWidth) / 2;

const legendGroups = svg.selectAll(".legend-item")
  .data(series)
  .join("g")
  .attr("class", "legend-item")
  .attr("transform", (_, i) => `translate(${legendStartX + i * legendItemWidth},0)`);

legendGroups.append("rect")
  .attr("x", 0).attr("y", legendY - 12)
  .attr("width", 16).attr("height", 16)
  .attr("fill", (d) => d.color);

legendGroups.append("text")
  .attr("x", 24).attr("y", legendY)
  .attr("fill", t.inkSoft)
  .attr("dominant-baseline", "middle")
  .style("font-size", "16px")
  .text((d) => d.name);
Runnable source as JSON, for any HTTP client: https://api.anyplot.ai/specs/radar-basic/d3/code. Any spec id and library id listed in llms-full.txt fit the same URL shape; every URL below is complete and callable.
{
  "spec_id": "radar-basic",
  "language": "javascript",
  "library": "d3",
  "page": "https://anyplot.ai/radar-basic/javascript/d3",
  "hub": "https://anyplot.ai/radar-basic",
  "code_json": "https://api.anyplot.ai/specs/radar-basic/d3/code",
  "spec_json": "https://api.anyplot.ai/specs/radar-basic",
  "render_light_png": "https://storage.googleapis.com/anyplot-images/plots/radar-basic/javascript/d3/plot-light.png",
  "render_dark_png": "https://storage.googleapis.com/anyplot-images/plots/radar-basic/javascript/d3/plot-dark.png",
  "interactive_light_html": "https://storage.googleapis.com/anyplot-images/plots/radar-basic/javascript/d3/plot-light.html",
  "interactive_dark_html": "https://storage.googleapis.com/anyplot-images/plots/radar-basic/javascript/d3/plot-dark.html",
  "quality_score": 95.0,
  "license": "MIT",
  "guide": "https://anyplot.ai/llms.txt"
}
Part of Basic Radar Chart on anyplot.ai.