The same plot in 14 other libraries — JavaScript: Chart.js, D3.js, Highcharts, MUI X Charts; Python: Altair, Bokeh, lets-plot, Matplotlib, Plotly, plotnine, Pygal, Seaborn; R: ggplot2; Julia: Makie.jl. Compare all 15 side by side: Basic Radar Chart in Python, R, Julia and JavaScript.
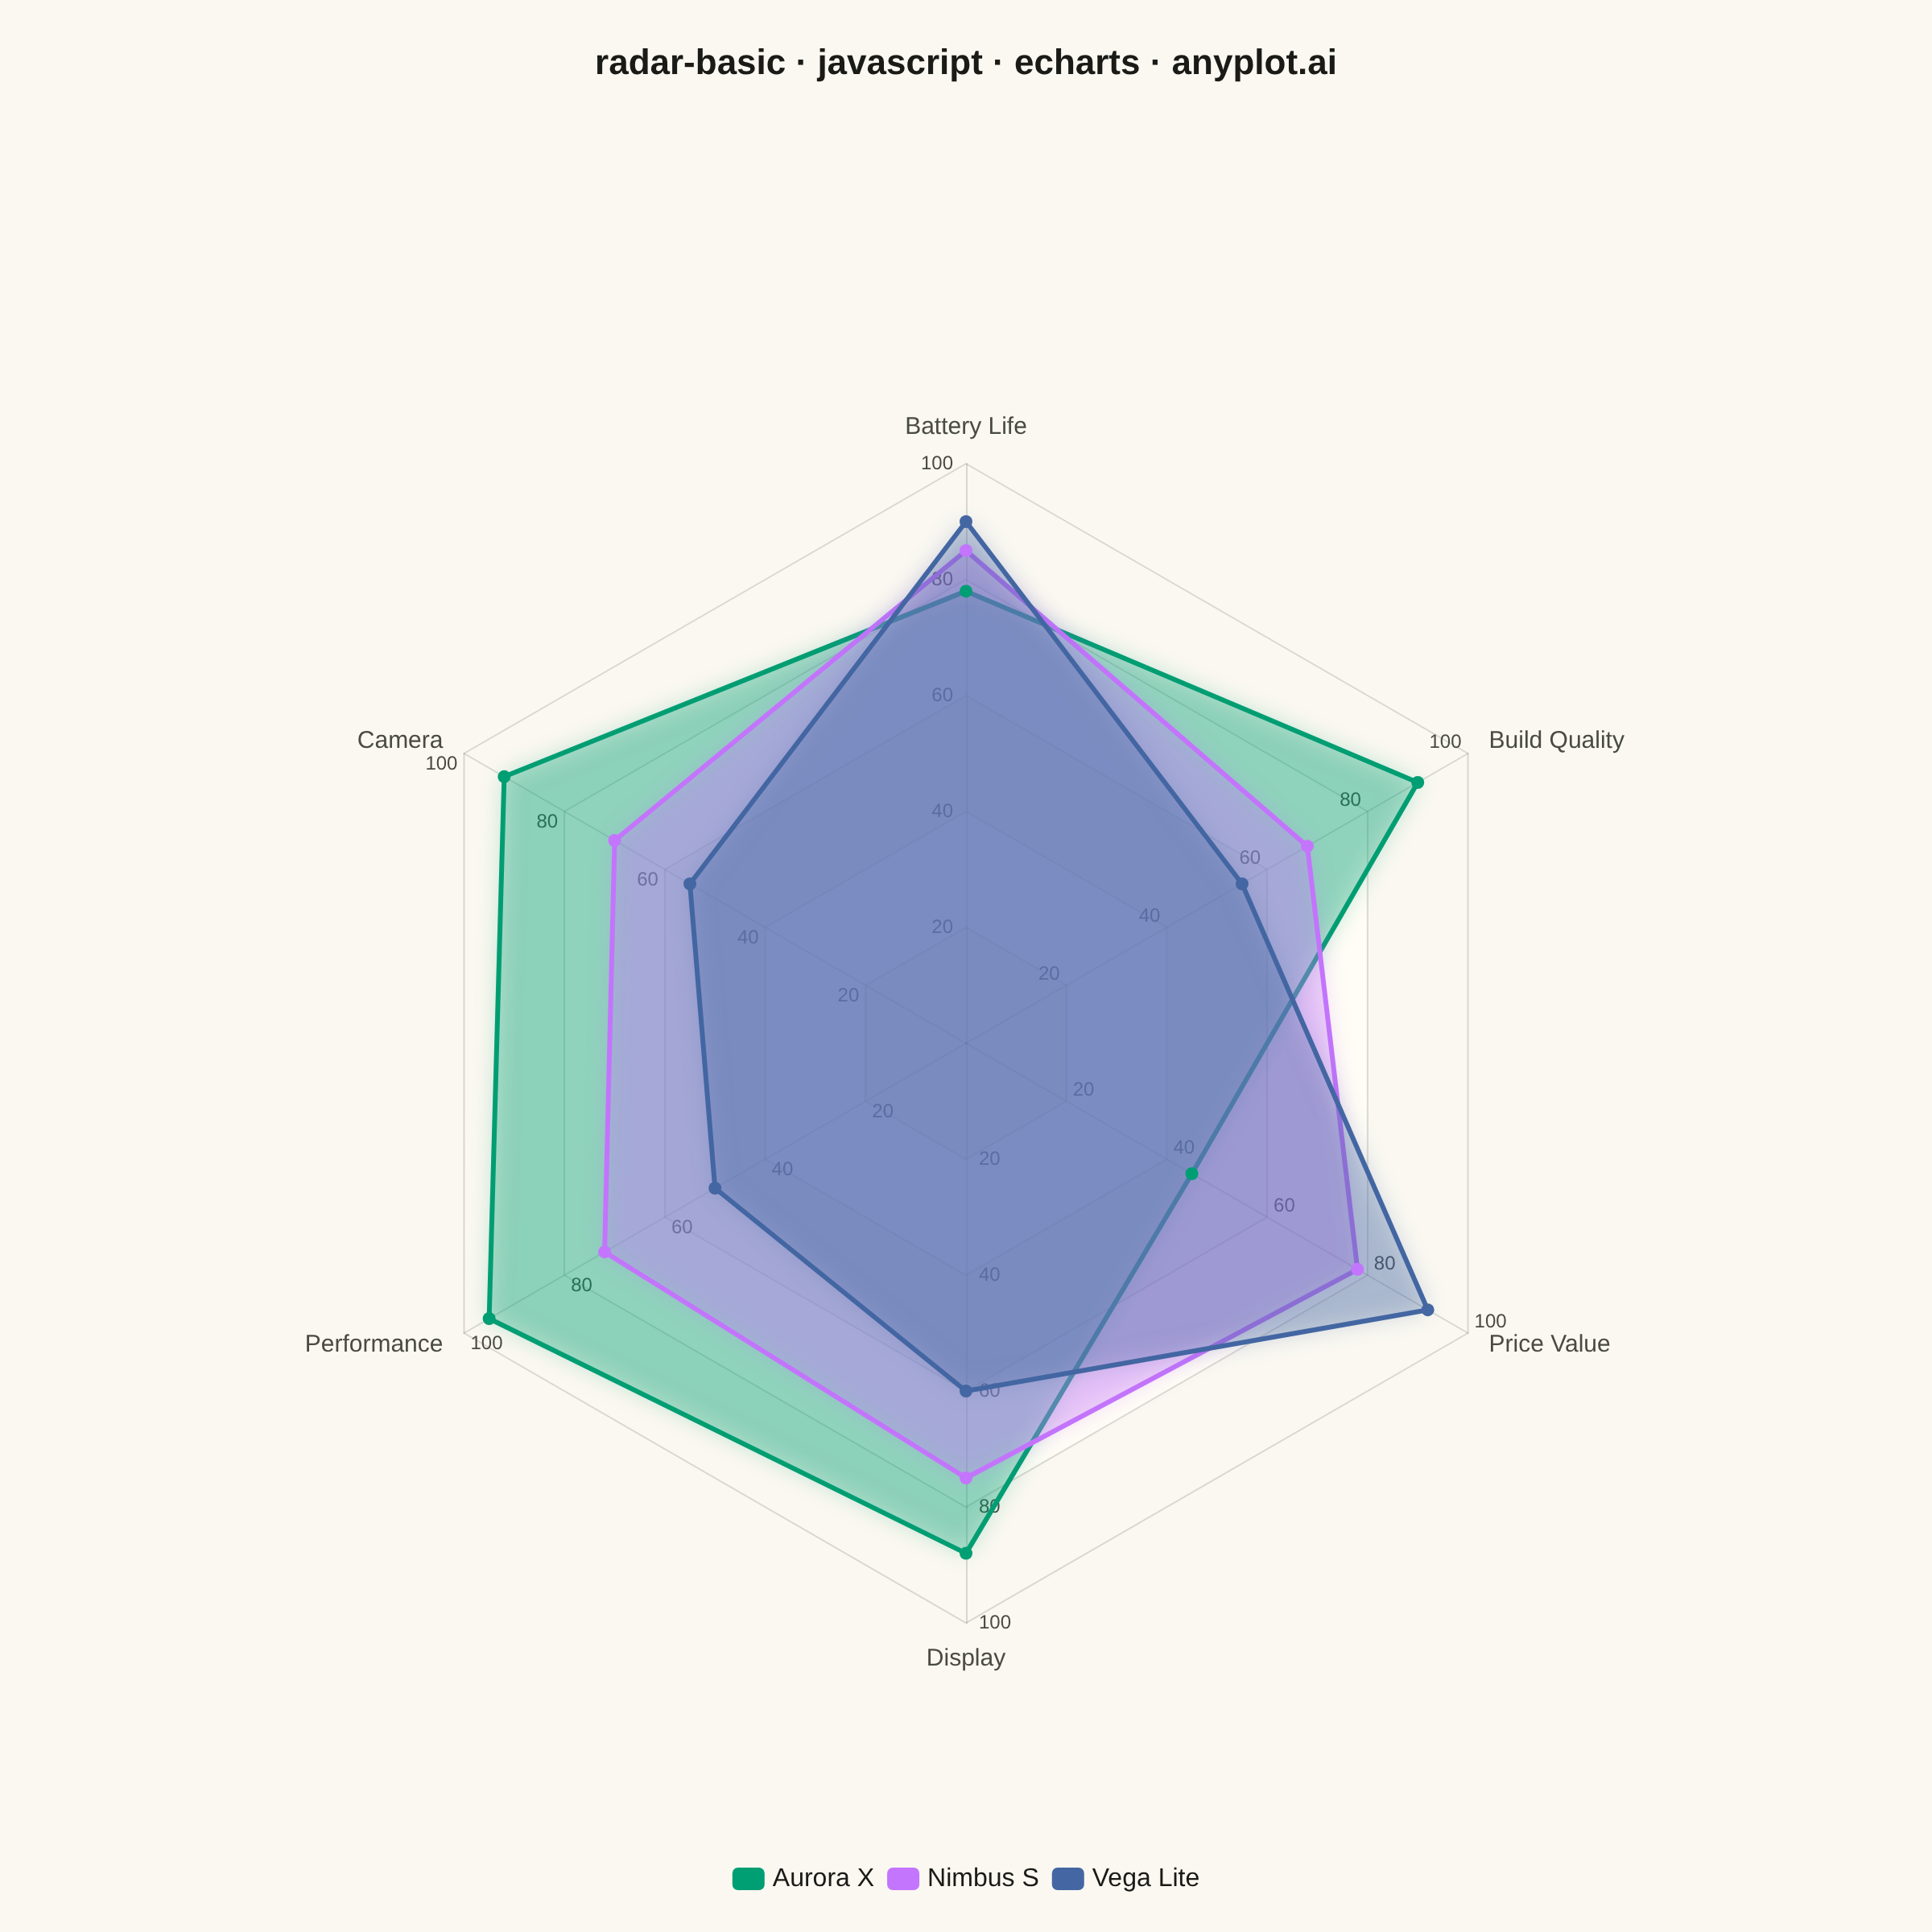
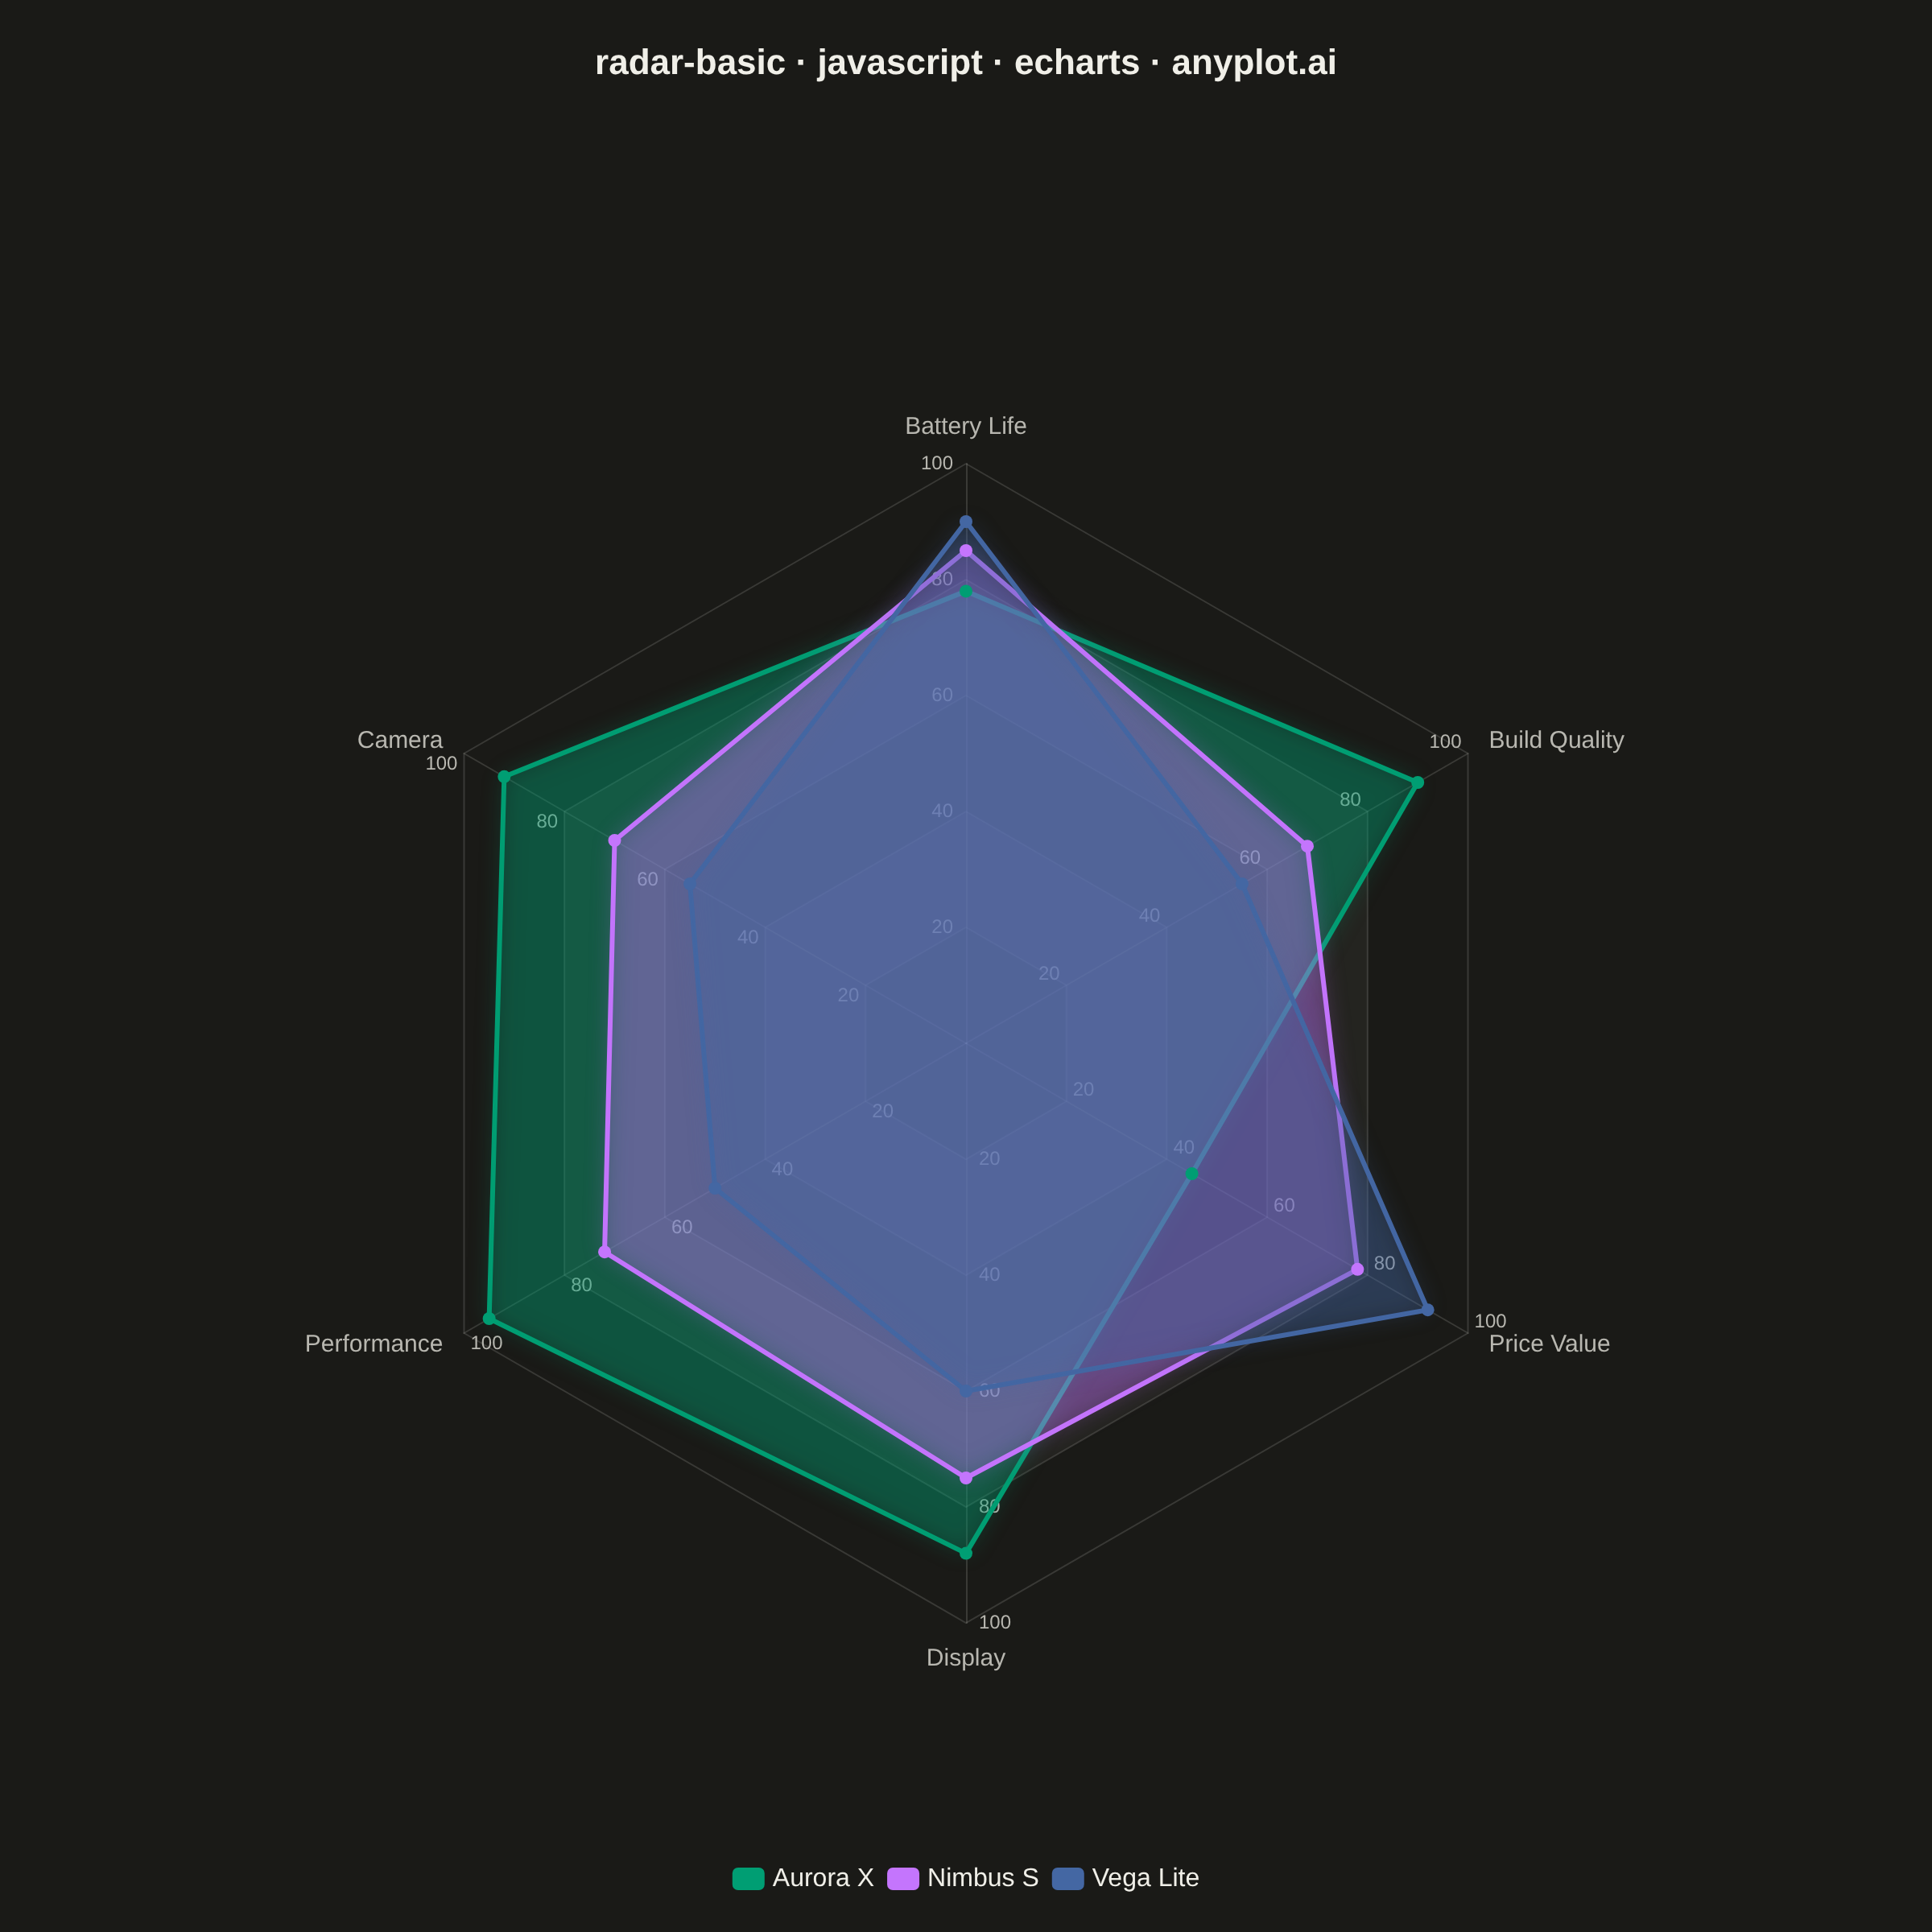
A radar chart (also known as spider or web chart) displays multivariate data on axes starting from a common center point, with values connected to form a polygon. Each axis represents a different variable, making it ideal for comparing multiple quantitative variables at once or visualizing strengths and weaknesses across categories.
// anyplot.ai
// radar-basic: Basic Radar Chart
// Library: echarts 6.1.0 | JavaScript 22.23.1
// Quality: 89/100 | Created: 2026-07-24
//# anyplot-orientation: square

const t = window.ANYPLOT_TOKENS;

// Data — three phone models compared across six product attributes (0-100 scale)
const indicators = [
  { name: "Battery Life", max: 100 },
  { name: "Camera", max: 100 },
  { name: "Performance", max: 100 },
  { name: "Display", max: 100 },
  { name: "Price Value", max: 100 },
  { name: "Build Quality", max: 100 },
];

const models = [
  { name: "Aurora X", values: [78, 92, 95, 88, 45, 90] },
  { name: "Nimbus S", values: [85, 70, 72, 75, 78, 68] },
  { name: "Vega Lite", values: [90, 55, 50, 60, 92, 55] },
];

const chart = echarts.init(document.getElementById("container"));

chart.setOption({
  animation: false,
  color: t.palette,
  backgroundColor: "transparent",
  title: {
    text: "radar-basic · javascript · echarts · anyplot.ai",
    left: "center",
    top: 24,
    textStyle: { color: t.ink, fontSize: 22 },
  },
  legend: {
    data: models.map((m) => m.name),
    bottom: 20,
    textStyle: { color: t.ink, fontSize: 16 },
    itemWidth: 20,
    itemHeight: 14,
  },
  radar: {
    center: ["50%", "54%"],
    radius: "60%",
    shape: "polygon",
    splitNumber: 5,
    indicator: indicators,
    name: { textStyle: { color: t.inkSoft, fontSize: 15 } },
    axisLine: { lineStyle: { color: t.grid } },
    axisLabel: {
      show: true,
      color: t.inkSoft,
      fontSize: 12,
      formatter: (value) => (value === 0 ? "" : String(value)),
    },
    splitLine: { lineStyle: { color: t.grid } },
    splitArea: { show: true, areaStyle: { color: [t.pageBg, t.elevatedBg] } },
  },
  series: [
    {
      type: "radar",
      data: models.map((m, i) => ({
        name: m.name,
        value: m.values,
        symbol: "circle",
        symbolSize: 8,
        lineStyle: { color: t.palette[i], width: 3 },
        itemStyle: { color: t.palette[i] },
        areaStyle: {
          color: t.palette[i],
          opacity: 0.25,
          shadowBlur: 14,
          shadowColor: t.palette[i],
        },
        emphasis: {
          lineStyle: { width: 5 },
          areaStyle: { opacity: 0.45 },
        },
      })),
    },
  ],
});
Runnable source as JSON, for any HTTP client: https://api.anyplot.ai/specs/radar-basic/echarts/code. Any spec id and library id listed in llms-full.txt fit the same URL shape; every URL below is complete and callable.
{
  "spec_id": "radar-basic",
  "language": "javascript",
  "library": "echarts",
  "page": "https://anyplot.ai/radar-basic/javascript/echarts",
  "hub": "https://anyplot.ai/radar-basic",
  "code_json": "https://api.anyplot.ai/specs/radar-basic/echarts/code",
  "spec_json": "https://api.anyplot.ai/specs/radar-basic",
  "render_light_png": "https://storage.googleapis.com/anyplot-images/plots/radar-basic/javascript/echarts/plot-light.png",
  "render_dark_png": "https://storage.googleapis.com/anyplot-images/plots/radar-basic/javascript/echarts/plot-dark.png",
  "interactive_light_html": "https://storage.googleapis.com/anyplot-images/plots/radar-basic/javascript/echarts/plot-light.html",
  "interactive_dark_html": "https://storage.googleapis.com/anyplot-images/plots/radar-basic/javascript/echarts/plot-dark.html",
  "quality_score": 89.0,
  "license": "MIT",
  "guide": "https://anyplot.ai/llms.txt"
}
Part of Basic Radar Chart on anyplot.ai.