The same plot in 14 other libraries — JavaScript: Chart.js, D3.js, Apache ECharts, MUI X Charts; Python: Altair, Bokeh, lets-plot, Matplotlib, Plotly, plotnine, Pygal, Seaborn; R: ggplot2; Julia: Makie.jl. Compare all 15 side by side: Basic Radar Chart in Python, R, Julia and JavaScript.
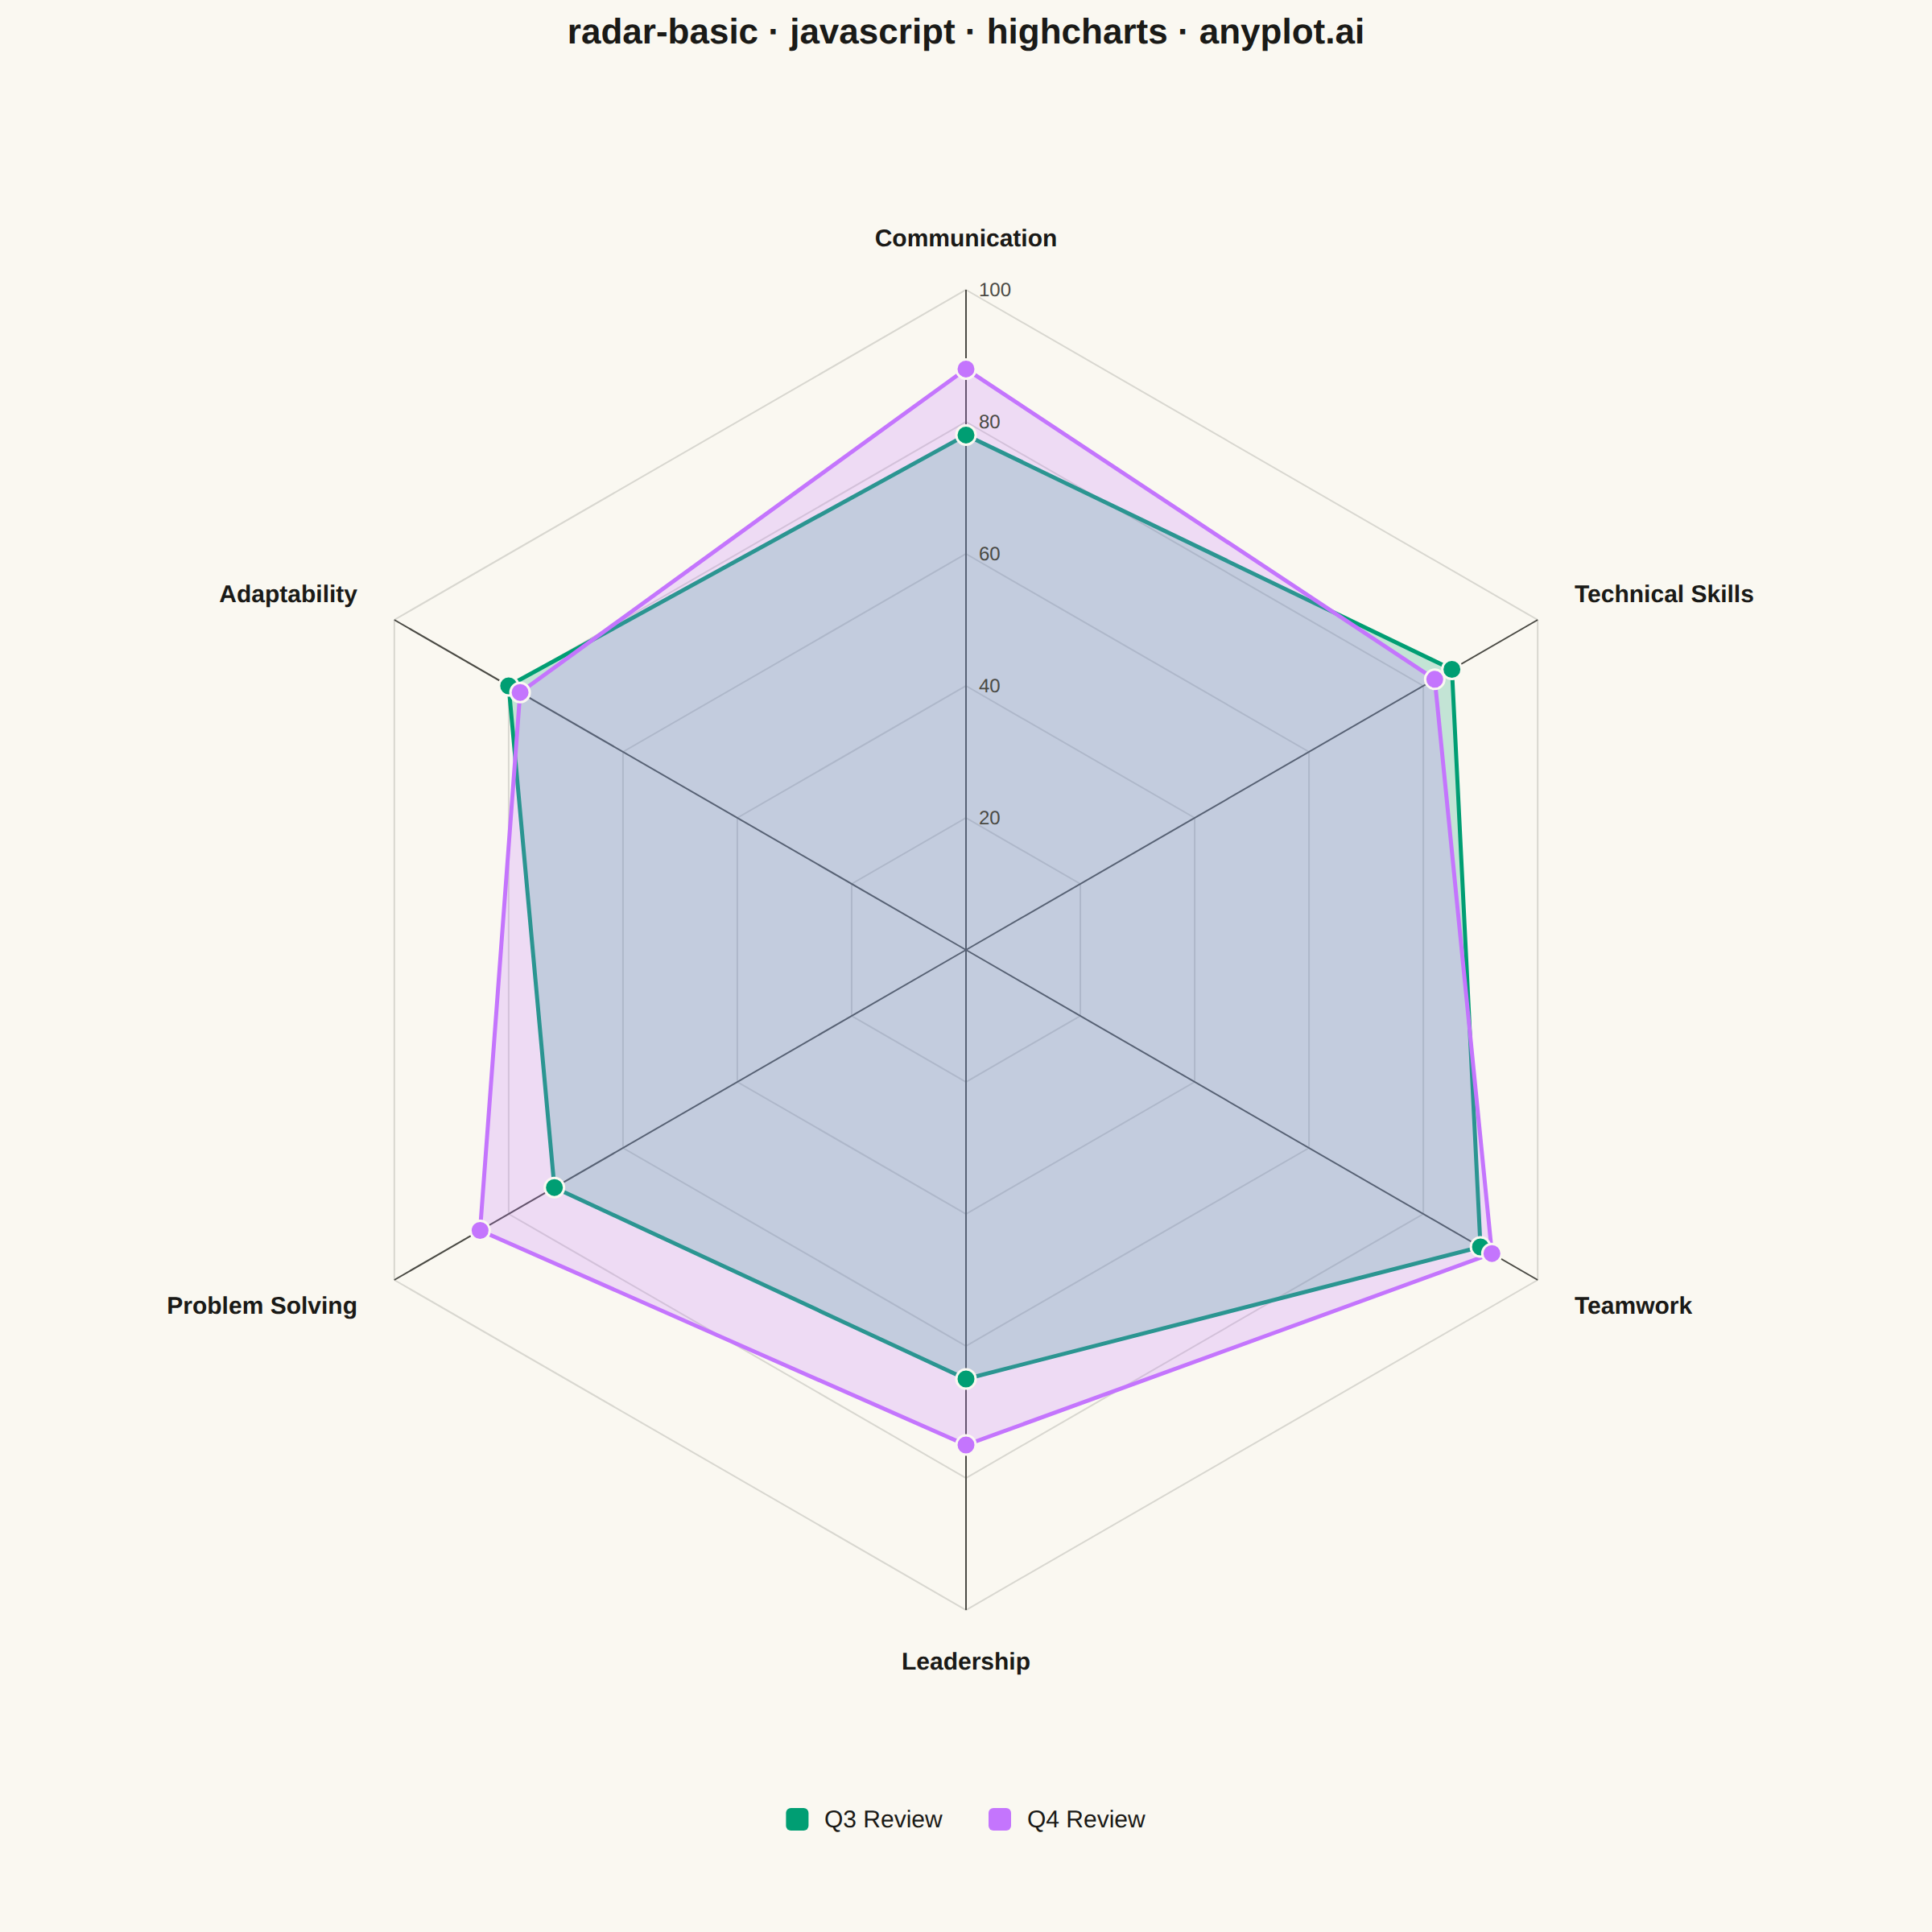
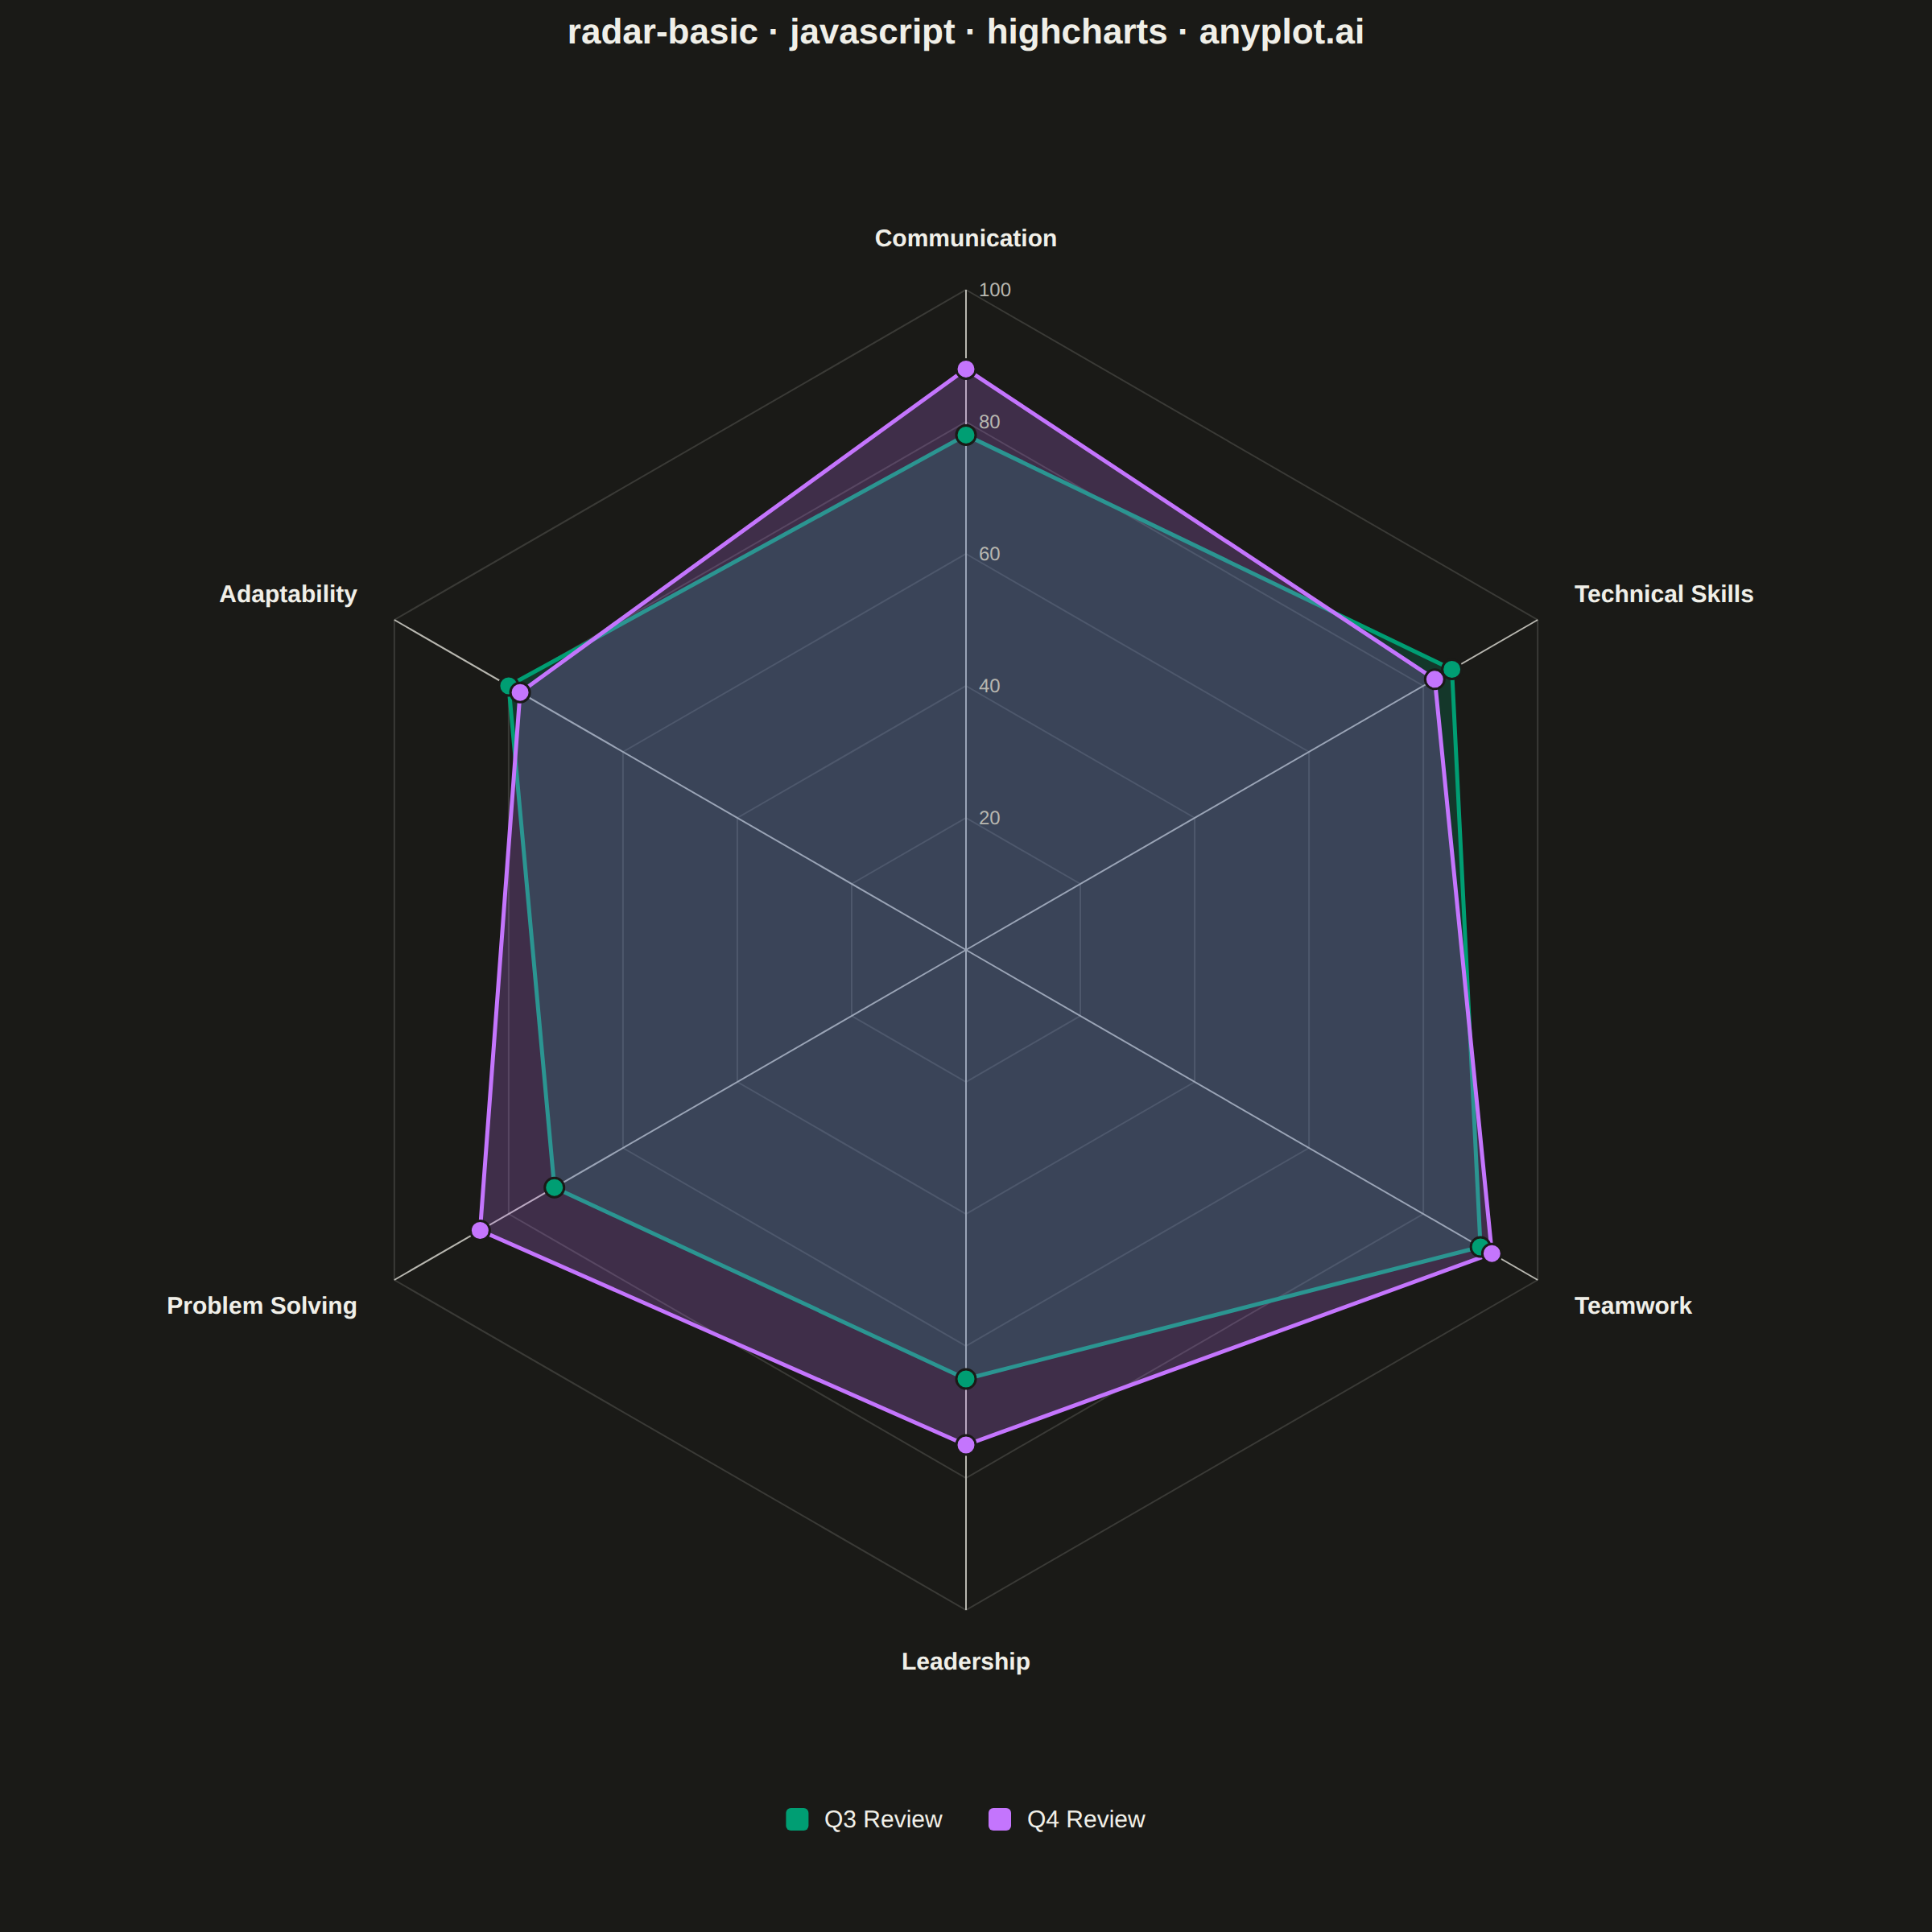
A radar chart (also known as spider or web chart) displays multivariate data on axes starting from a common center point, with values connected to form a polygon. Each axis represents a different variable, making it ideal for comparing multiple quantitative variables at once or visualizing strengths and weaknesses across categories.
// anyplot.ai
// radar-basic: Basic Radar Chart
// Library: highcharts 12.6.0 | JavaScript 22.23.1
// Quality: 91/100 | Created: 2026-07-24
//# anyplot-orientation: square

// Only the core `highcharts` bundle is loaded (no highcharts-more), so the
// native polar/radar series type isn't available. Instead we project each
// axis's polar coordinate to Cartesian ourselves and draw the grid, spokes,
// labels, and data polygons with the core SVG renderer — same technique the
// gauge-basic implementation uses for its needle overlay.
const t = window.ANYPLOT_TOKENS;

// --- Data (Employee performance review, two review cycles) -----------------
const categories = [
  "Communication",
  "Technical Skills",
  "Teamwork",
  "Leadership",
  "Problem Solving",
  "Adaptability",
];
const series = [
  { name: "Q3 Review", color: t.palette[0], values: [78, 85, 90, 65, 72, 80] },
  { name: "Q4 Review", color: t.palette[1], values: [88, 82, 92, 75, 85, 78] },
];
const MAX_VALUE = 100;
const RING_LEVELS = [20, 40, 60, 80, 100];
const n = categories.length;

const TITLE = "radar-basic · javascript · highcharts · anyplot.ai";
const titleFs = Math.max(15, Math.round(22 * Math.min(1, 67 / TITLE.length))) + "px";

// --- Chart (empty core chart used as a canvas for the renderer overlay) ----
const chart = Highcharts.chart("container", {
  chart: {
    backgroundColor: "transparent",
    animation: false,
    style: { fontFamily: "inherit" },
    margin: [110, 80, 130, 80],
  },
  credits: { enabled: false },
  title: {
    text: TITLE,
    style: { color: t.ink, fontSize: titleFs, fontWeight: "600" },
  },
  xAxis: { visible: false, gridLineWidth: 0, lineWidth: 0, tickLength: 0 },
  yAxis: { visible: false, gridLineWidth: 0, lineWidth: 0, tickLength: 0 },
  legend: { enabled: false },
  tooltip: {
    enabled: true,
    backgroundColor: t.elevatedBg,
    borderColor: t.grid,
    style: { color: t.ink },
    formatter() {
      return `<b>${this.series.name}</b><br/>${this.point.name}: ${this.point.custom.actualValue}`;
    },
  },
  plotOptions: { series: { animation: false } },
  series: [],
});

// Fix the (visible: false) axes to a known pixel-space extent so a real
// scatter series can be data-bound at the same polar-projected coordinates
// the renderer overlay uses below — this keeps the PNG output identical
// while giving the interactive HTML genuine Highcharts series/tooltip usage.
chart.xAxis[0].setExtremes(0, chart.plotWidth, false);
chart.yAxis[0].setExtremes(0, chart.plotHeight, false);

// --- Geometry ----------------------------------------------------------------
const cx = chart.plotLeft + chart.plotWidth / 2;
const cy = chart.plotTop + chart.plotHeight / 2;
const outerR = Math.min(chart.plotWidth, chart.plotHeight) / 2 - 70;

// angle 0 points straight up, axes proceed clockwise
const angleOf = (i) => -Math.PI / 2 + i * ((2 * Math.PI) / n);
const pointAt = (i, radiusFrac) => {
  const angle = angleOf(i);
  return [cx + outerR * radiusFrac * Math.cos(angle), cy + outerR * radiusFrac * Math.sin(angle)];
};

// --- Grid rings --------------------------------------------------------------
RING_LEVELS.forEach((level) => {
  const radiusFrac = level / MAX_VALUE;
  const path = ["M"];
  for (let i = 0; i < n; i += 1) {
    const [x, y] = pointAt(i, radiusFrac);
    path.push(...(i === 0 ? [x, y] : ["L", x, y]));
  }
  path.push("Z");
  chart.renderer
    .path(path)
    .attr({ stroke: t.grid, "stroke-width": 1, fill: "none", zIndex: 1 })
    .add();
});

// --- Spokes + axis labels -----------------------------------------------------
categories.forEach((label, i) => {
  const [ox, oy] = pointAt(i, 1);
  chart.renderer
    .path(["M", cx, cy, "L", ox, oy])
    .attr({ stroke: t.inkSoft, "stroke-width": 1, zIndex: 1 })
    .add();

  const angle = angleOf(i);
  const cos = Math.cos(angle);
  const sin = Math.sin(angle);
  const [lx, ly] = pointAt(i, 1 + 26 / outerR);
  const align = cos > 0.3 ? "left" : cos < -0.3 ? "right" : "center";
  chart.renderer
    .text(label, lx, ly + sin * 6 + 5)
    .attr({ align, zIndex: 5 })
    .css({ fontSize: "15px", fontWeight: "600", color: t.ink, fontFamily: "inherit" })
    .add();
});

// --- Ring scale labels (along the top spoke) ---------------------------------
RING_LEVELS.forEach((level) => {
  const [, ly] = pointAt(0, level / MAX_VALUE);
  chart.renderer
    .text(String(level), cx + 8, ly + 4)
    .attr({ align: "left", zIndex: 4 })
    .css({ fontSize: "12px", color: t.inkSoft, fontFamily: "inherit" })
    .add();
});

// --- Data polygons -------------------------------------------------------------
series.forEach((s) => {
  const vertices = s.values.map((value, i) => pointAt(i, value / MAX_VALUE));
  const path = ["M"];
  vertices.forEach(([x, y], i) => path.push(...(i === 0 ? [x, y] : ["L", x, y])));
  path.push("Z");

  chart.renderer
    .path(path)
    .attr({
      fill: s.color,
      "fill-opacity": 0.22,
      stroke: s.color,
      "stroke-width": 2.5,
      "stroke-linejoin": "round",
      zIndex: 3,
    })
    .add();

  vertices.forEach(([x, y]) => {
    chart.renderer
      .circle(x, y, 6)
      .attr({ fill: s.color, stroke: t.pageBg, "stroke-width": 1.5, zIndex: 4 })
      .add();
  });

  // Real Highcharts scatter series at the same vertex pixels (mapped through
  // the fixed-extent axes above) — markers stay hidden so the PNG is
  // untouched, but each point is genuinely data-bound and hoverable in the
  // interactive HTML, with the tooltip reporting the actual category/value.
  chart.addSeries(
    {
      type: "scatter",
      name: s.name,
      color: s.color,
      enableMouseTracking: true,
      stickyTracking: false,
      animation: false,
      marker: {
        enabled: false,
        radius: 7,
        states: { hover: { enabled: true, radius: 7, lineWidth: 1.5, lineColor: t.pageBg } },
      },
      data: vertices.map(([x, y], i) => ({
        x: x - chart.plotLeft,
        y: chart.plotTop + chart.plotHeight - y,
        name: categories[i],
        custom: { actualValue: s.values[i] },
      })),
    },
    false
  );
});
chart.redraw();

// --- Legend ---------------------------------------------------------------
const chipSize = 14;
const gap = 28;
const legendFs = 15;
const chipTextWidths = series.map((s) => s.name.length * 8.2);
const legendWidth = series.reduce(
  (sum, _s, i) => sum + chipSize + 10 + chipTextWidths[i] + (i < series.length - 1 ? gap : 0),
  0
);
let legendX = cx - legendWidth / 2;
const legendY = chart.plotTop + chart.plotHeight + 60;

series.forEach((s, i) => {
  chart.renderer
    .rect(legendX, legendY - chipSize / 2, chipSize, chipSize, 3)
    .attr({ fill: s.color, zIndex: 5 })
    .add();
  chart.renderer
    .text(s.name, legendX + chipSize + 10, legendY + chipSize / 2 - 2)
    .attr({ align: "left", zIndex: 5 })
    .css({ fontSize: `${legendFs}px`, color: t.ink, fontFamily: "inherit" })
    .add();
  legendX += chipSize + 10 + chipTextWidths[i] + gap;
});
Runnable source as JSON, for any HTTP client: https://api.anyplot.ai/specs/radar-basic/highcharts/code. Any spec id and library id listed in llms-full.txt fit the same URL shape; every URL below is complete and callable.
{
  "spec_id": "radar-basic",
  "language": "javascript",
  "library": "highcharts",
  "page": "https://anyplot.ai/radar-basic/javascript/highcharts",
  "hub": "https://anyplot.ai/radar-basic",
  "code_json": "https://api.anyplot.ai/specs/radar-basic/highcharts/code",
  "spec_json": "https://api.anyplot.ai/specs/radar-basic",
  "render_light_png": "https://storage.googleapis.com/anyplot-images/plots/radar-basic/javascript/highcharts/plot-light.png",
  "render_dark_png": "https://storage.googleapis.com/anyplot-images/plots/radar-basic/javascript/highcharts/plot-dark.png",
  "interactive_light_html": "https://storage.googleapis.com/anyplot-images/plots/radar-basic/javascript/highcharts/plot-light.html",
  "interactive_dark_html": "https://storage.googleapis.com/anyplot-images/plots/radar-basic/javascript/highcharts/plot-dark.html",
  "quality_score": 91.0,
  "license": "MIT",
  "guide": "https://anyplot.ai/llms.txt"
}
Part of Basic Radar Chart on anyplot.ai.