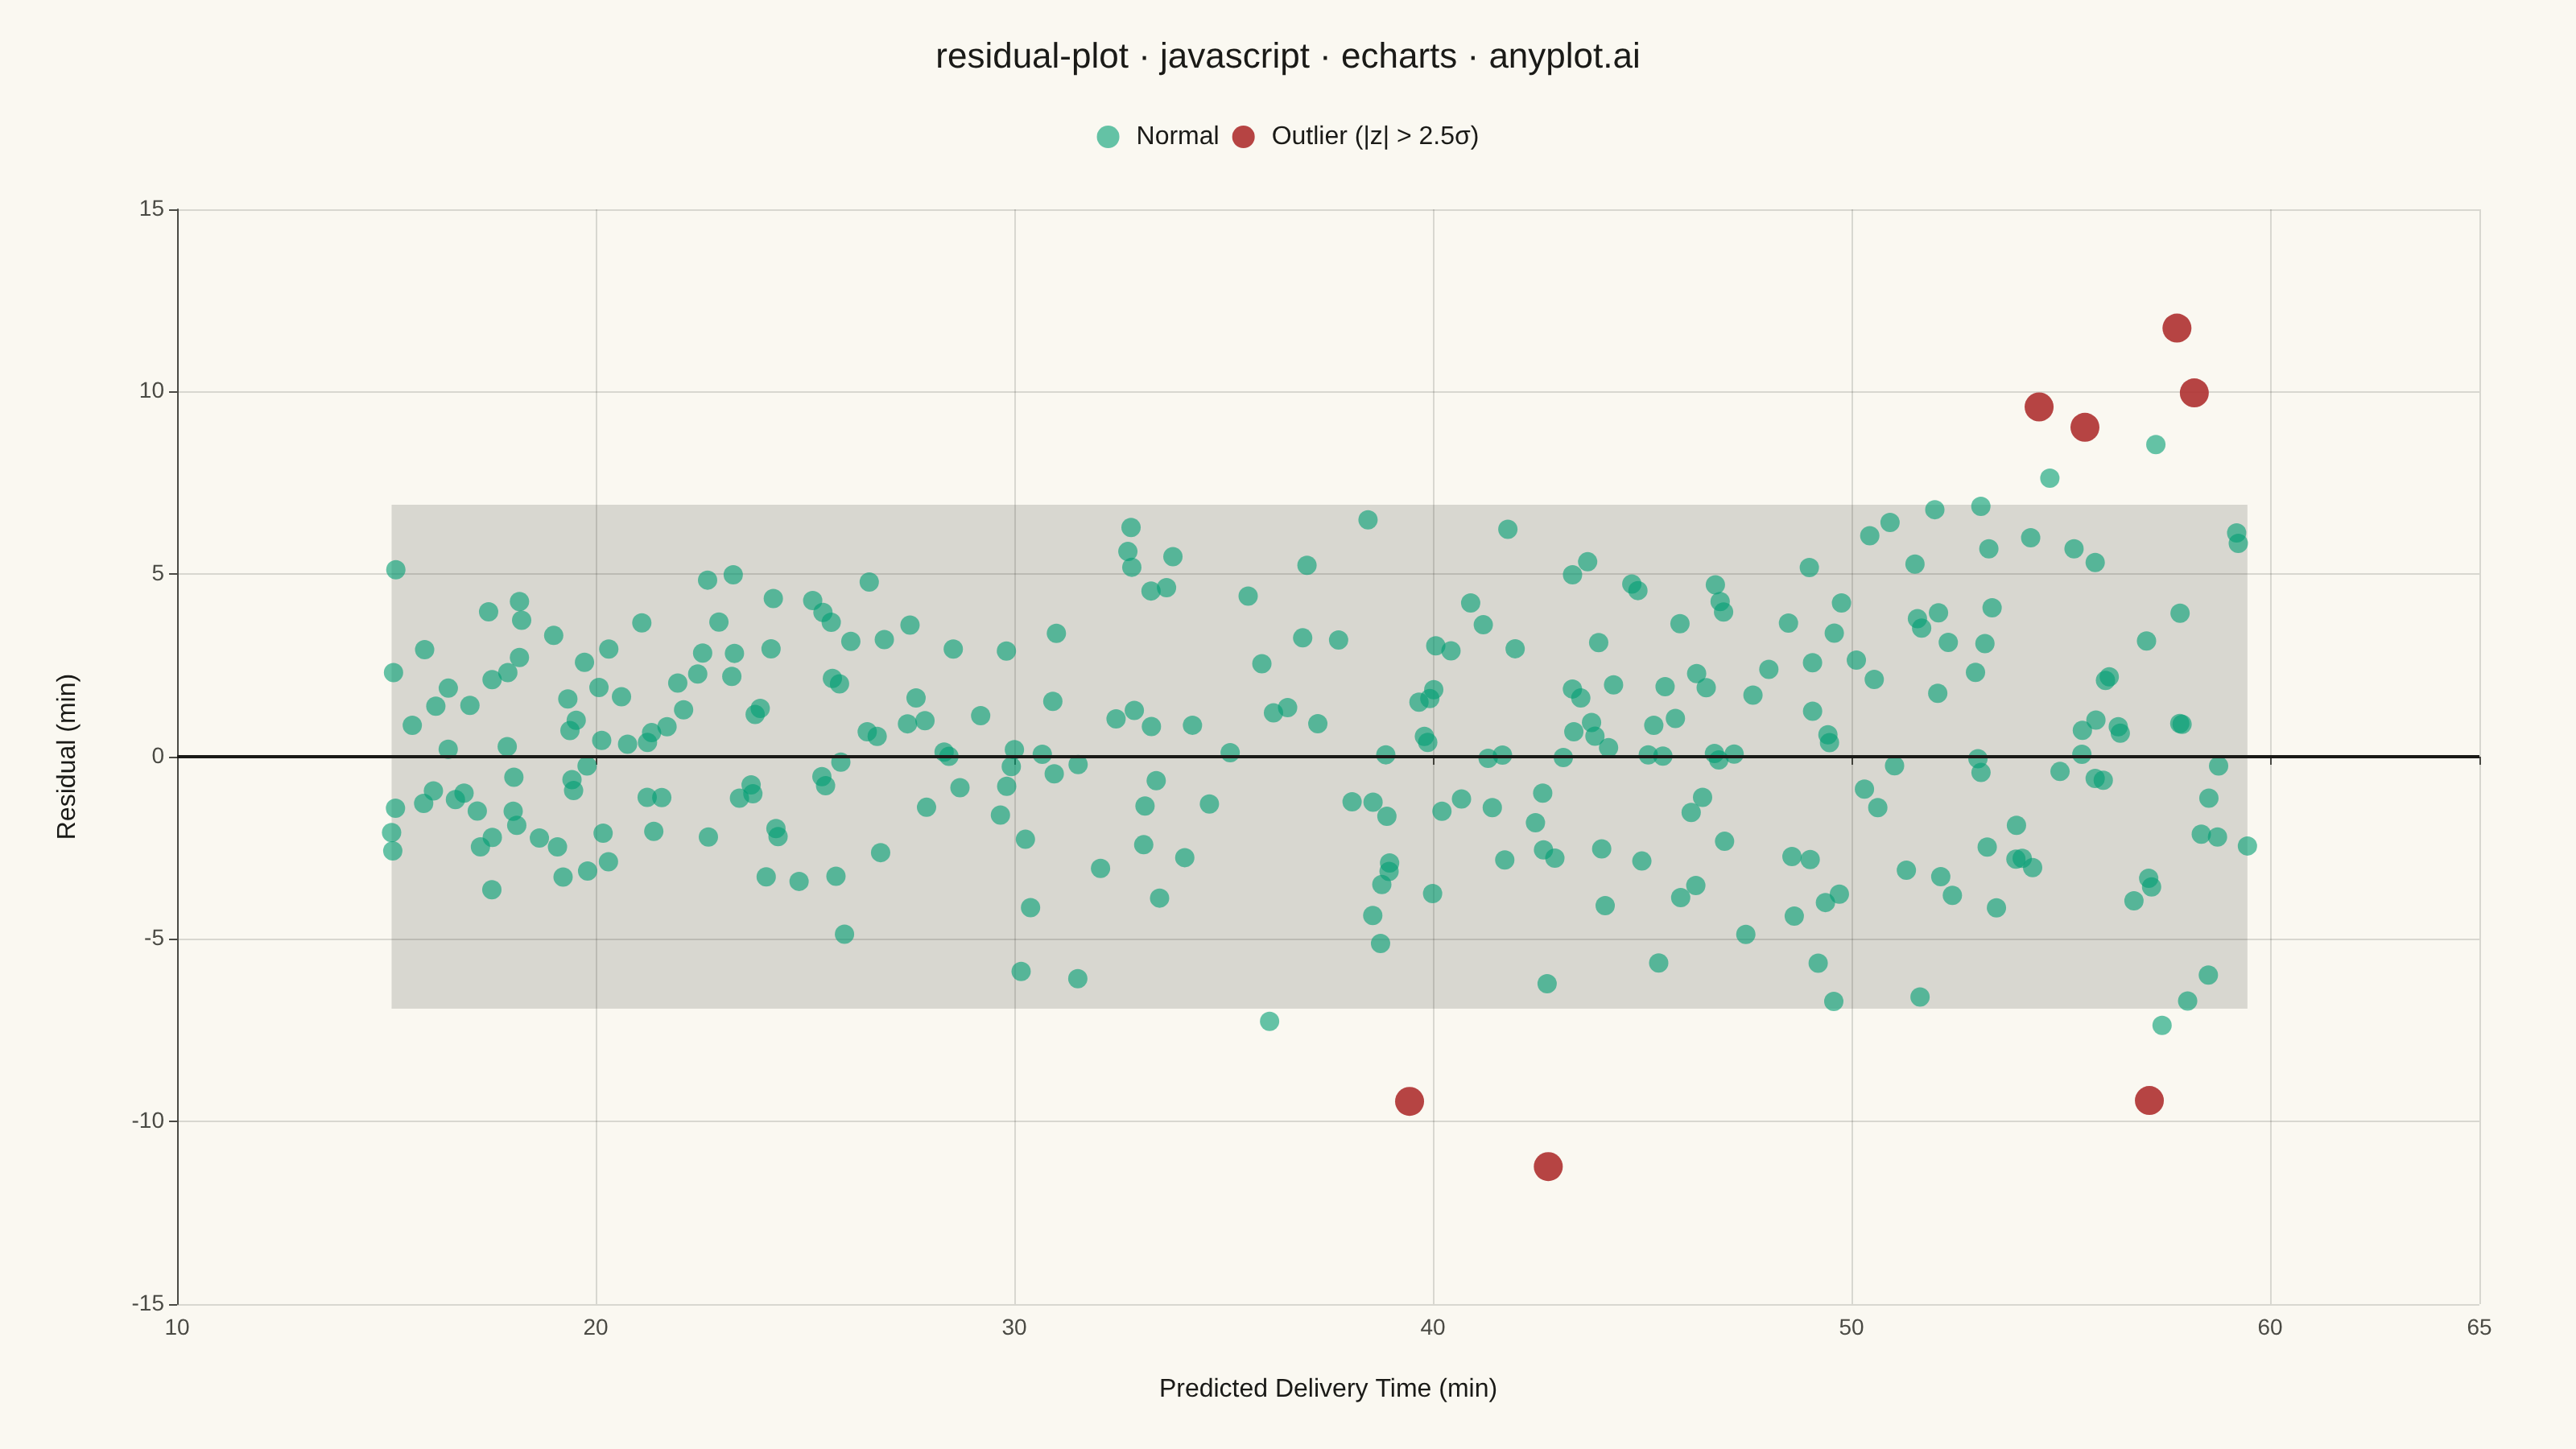
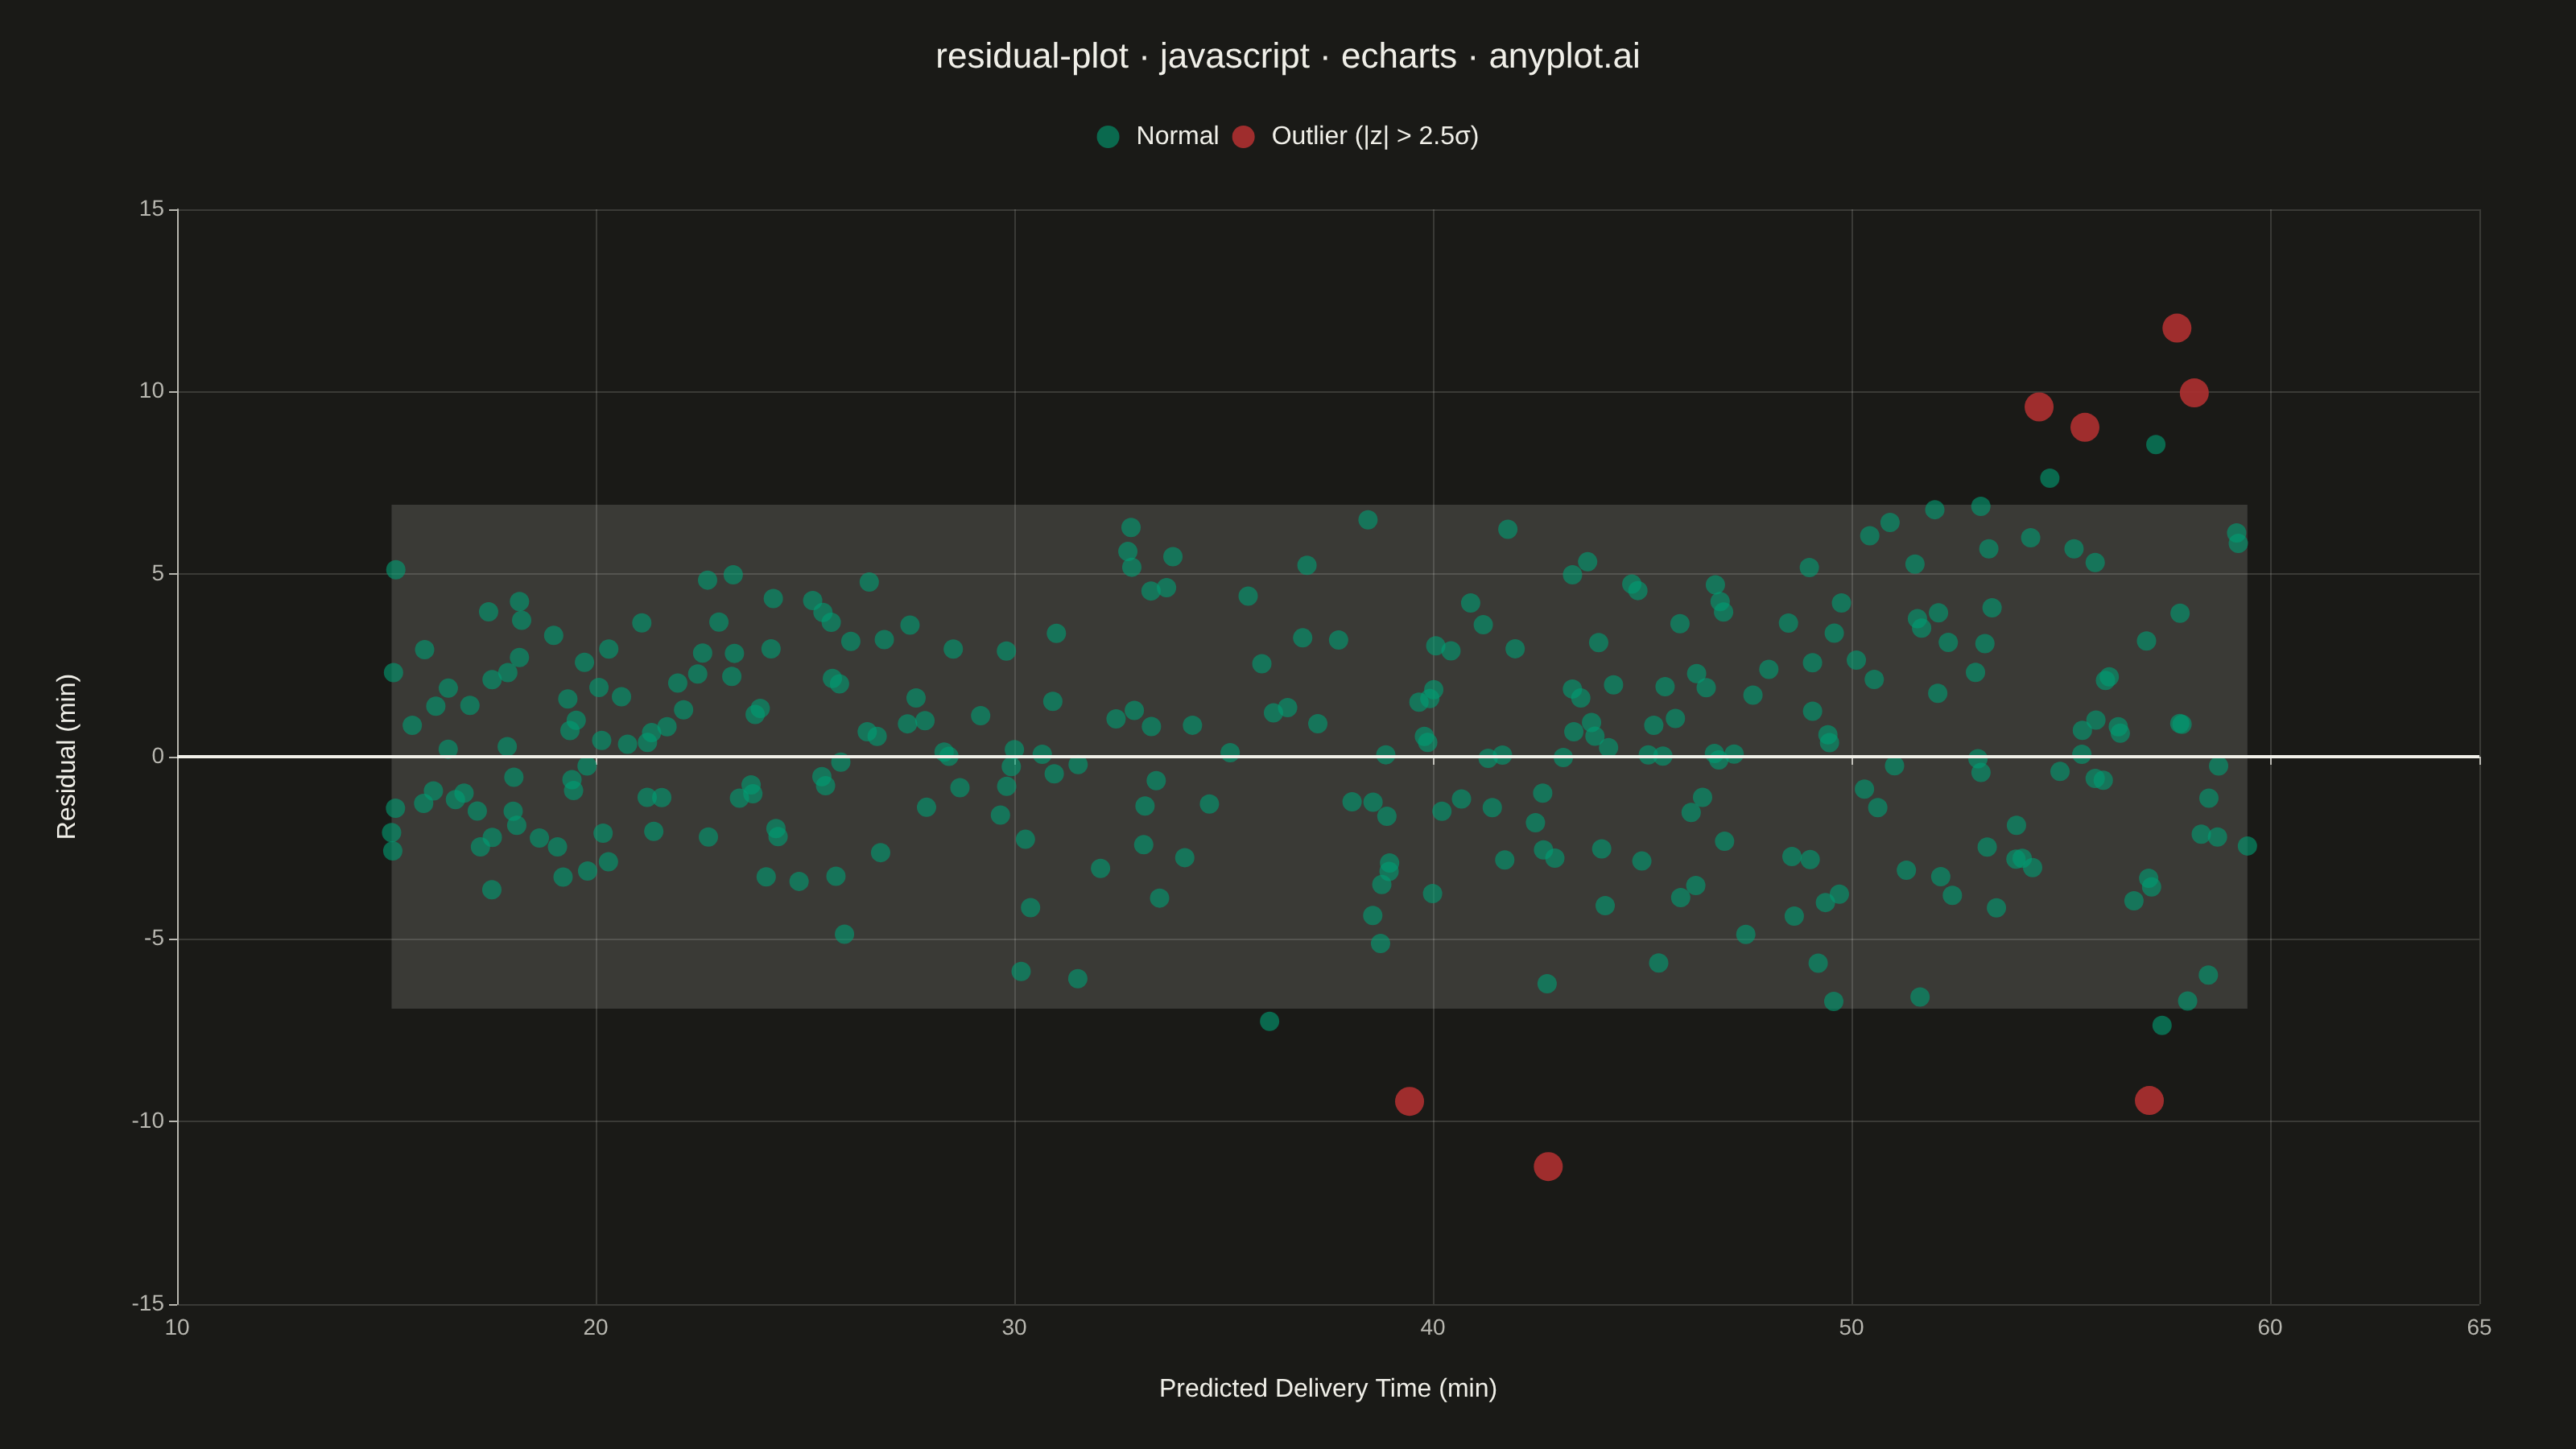
The same plot in 14 other libraries — JavaScript: Chart.js, D3.js, Highcharts, MUI X Charts; Python: Altair, Bokeh, lets-plot, Matplotlib, Plotly, plotnine, Pygal, Seaborn; R: ggplot2; Julia: Makie.jl. Compare all 15 side by side: Residual Plot in Python, R, Julia and JavaScript.
A residual plot displays the difference between observed and predicted values (residuals) against fitted values in regression analysis. This diagnostic visualization helps identify violations of regression assumptions including non-linearity, heteroscedasticity (non-constant variance), and outliers. A well-fitting model shows residuals randomly scattered around zero with no discernible pattern.
// anyplot.ai
// residual-plot: Residual Plot
// Library: echarts 6.1.0 | JavaScript 22.23.2
// Quality: 84/100 | Created: 2026-09-05

const t = window.ANYPLOT_TOKENS;

// --- Data (in-memory, deterministic) ---------------------------------------
let seed = 42;
const lcg = () => {
  seed = (seed * 1103515245 + 12345) & 0x7fffffff;
  return seed / 0x7fffffff;
};
const gaussian = () => {
  const u1 = Math.max(lcg(), 1e-9);
  const u2 = lcg();
  return Math.sqrt(-2 * Math.log(u1)) * Math.cos(2 * Math.PI * u2);
};

const n = 300;
const fitted = [];
const residuals = [];
for (let i = 0; i < n; i++) {
  const predictedMinutes = 15 + lcg() * 45; // predicted delivery time, 15-60 min
  const noiseScale = 1.2 + 0.06 * predictedMinutes; // mild heteroscedasticity
  fitted.push(predictedMinutes);
  residuals.push(gaussian() * noiseScale);
}

const mean = residuals.reduce((a, b) => a + b, 0) / n;
const variance = residuals.reduce((a, b) => a + (b - mean) ** 2, 0) / n;
const std = Math.sqrt(variance);
const outlierThreshold = 2.5 * std;

const normalPoints = [];
const outlierPoints = [];
fitted.forEach((value, i) => {
  const point = [value, residuals[i]];
  if (Math.abs(residuals[i]) > outlierThreshold) {
    outlierPoints.push(point);
  } else {
    normalPoints.push(point);
  }
});

const xMin = Math.floor((Math.min(...fitted) - 2) / 5) * 5;
const xMax = Math.ceil((Math.max(...fitted) + 2) / 5) * 5;
const bandLow = -2 * std;
const bandHigh = 2 * std;

// --- Init -------------------------------------------------------------------
const chart = echarts.init(document.getElementById("container"));

// --- Option -----------------------------------------------------------------
chart.setOption({
  animation: false,
  color: [t.palette[0], t.palette[4]],
  backgroundColor: "transparent",
  title: {
    text: "residual-plot · javascript · echarts · anyplot.ai",
    left: "center",
    top: 20,
    textStyle: { color: t.ink, fontSize: 22, fontWeight: 500 },
  },
  legend: {
    data: ["Normal", "Outlier (|z| > 2.5σ)"],
    top: 72,
    textStyle: { color: t.ink, fontSize: 16 },
  },
  tooltip: {
    trigger: "item",
    axisPointer: { type: "cross", lineStyle: { color: t.inkSoft, type: "dashed" } },
    formatter: (p) =>
      `${p.seriesName}<br/>Predicted: ${p.value[0].toFixed(1)} min<br/>Residual: ${p.value[1].toFixed(2)} min`,
  },
  grid: { left: 110, right: 60, top: 130, bottom: 90 },
  xAxis: {
    type: "value",
    name: "Predicted Delivery Time (min)",
    nameLocation: "middle",
    nameGap: 45,
    nameTextStyle: { color: t.ink, fontSize: 16 },
    min: xMin,
    max: xMax,
    axisLabel: { color: t.inkSoft, fontSize: 14 },
    axisLine: { lineStyle: { color: t.inkSoft } },
    splitLine: { lineStyle: { color: t.grid } },
  },
  yAxis: {
    type: "value",
    name: "Residual (min)",
    nameLocation: "middle",
    nameGap: 60,
    nameTextStyle: { color: t.ink, fontSize: 16 },
    axisLabel: { color: t.inkSoft, fontSize: 14 },
    axisLine: { lineStyle: { color: t.inkSoft } },
    splitLine: { lineStyle: { color: t.grid } },
  },
  series: [
    {
      name: "Normal",
      type: "scatter",
      data: normalPoints,
      symbolSize: 12,
      itemStyle: { color: t.palette[0], opacity: 0.6 },
      markLine: {
        symbol: "none",
        silent: true,
        lineStyle: { color: t.ink, width: 2, type: "solid" },
        label: { show: false },
        data: [{ yAxis: 0 }],
      },
      markArea: {
        silent: true,
        itemStyle: { color: t.grid },
        data: [
          [
            { yAxis: bandLow, xAxis: "min" },
            { yAxis: bandHigh, xAxis: "max" },
          ],
        ],
      },
    },
    {
      name: "Outlier (|z| > 2.5σ)",
      type: "scatter",
      data: outlierPoints,
      symbolSize: 18,
      itemStyle: { color: t.palette[4], opacity: 0.9 },
    },
  ],
});
Runnable source as JSON, for any HTTP client: https://api.anyplot.ai/specs/residual-plot/echarts/code. Any spec id and library id listed in llms-full.txt fit the same URL shape; every URL below is complete and callable.
{
  "spec_id": "residual-plot",
  "language": "javascript",
  "library": "echarts",
  "page": "https://anyplot.ai/residual-plot/javascript/echarts",
  "hub": "https://anyplot.ai/residual-plot",
  "code_json": "https://api.anyplot.ai/specs/residual-plot/echarts/code",
  "spec_json": "https://api.anyplot.ai/specs/residual-plot",
  "render_light_png": "https://storage.googleapis.com/anyplot-images/plots/residual-plot/javascript/echarts/plot-light.png",
  "render_dark_png": "https://storage.googleapis.com/anyplot-images/plots/residual-plot/javascript/echarts/plot-dark.png",
  "interactive_light_html": "https://storage.googleapis.com/anyplot-images/plots/residual-plot/javascript/echarts/plot-light.html",
  "interactive_dark_html": "https://storage.googleapis.com/anyplot-images/plots/residual-plot/javascript/echarts/plot-dark.html",
  "quality_score": 84.0,
  "license": "MIT",
  "guide": "https://anyplot.ai/llms.txt"
}
Part of Residual Plot on anyplot.ai.